Information content and policy implications of stock splits, new evidence from the saudi arabian capital market
Bạn đang xem bản rút gọn của tài liệu. Xem và tải ngay bản đầy đủ của tài liệu tại đây (2.69 MB, 140 trang )
INFORMATION CONTENT AND POLICY IMPLICATIONS OF STOCK SPLITS
NEW EVIDENCE FROM THE SAUDI ARABIAN CAPITAL MARKET
Reproduced with permission of the copyright owner. Further reproduction prohibited without permission.
Reproduced with permission of the copyright owner. Further reproduction prohibited without permission.
Information Content and Policy Implications of Stock Splits: New Evidence from the
Saudi Arabian Capital Market
A dissertation submitted in partial fulfillment
of the requirements for the degree of
Doctor of Philosophy
By
Ali Mofarreh Ali Serhan
May 2005
University of Arkansas
Reproduced with permission of the copyright owner. Further reproduction prohibited without permission.
UMI N um ber: 3201536
C o pyright 2005 by
Serhan, Ali M ofarreh Ali
A ll rights reserved.
IN F O R M A T IO N TO U SER S
T h e quality o f th is re productio n is d e p e n d e n t upon th e q uality o f th e copy
subm itted. B roken o r in distinct print, colored or p o o r q u ality illustrations and
photog ra phs, print ble ed-thro ugh, su b stand ard m argins, and im proper
a lig n m e n t can a d ve rsely a ffe ct reproduction.
In the unlikely e ve n t th a t the a u th o r did not send a co m p le te m anuscript
and th ere are m issing pages, th e se will be noted. A lso, if unauthorized
cop yrig ht m aterial had to be rem oved, a note w ill indicate th e deletion.
®
UMI
UMI M icroform 3201536
C op yrig h t 2006 by P roQ uest Inform ation and Learning C om pany.
A ll rights reserved. T his m icroform edition is protected a g ainst
u nauth orized copying u n d e r Title 17, U nited S tates Code.
P ro Q ue st Inform ation and Learning C om pany
300 North Z eeb Road
P.O. Box 1346
A nn A rbor, Ml 4 8 106 -1 346
Reproduced with permission of the copyright owner. Further reproduction prohibited without permission.
© 2005 by Ali Mofarreh Serhan
All Rights Reserved
Reproduced with permission of the copyright owner. Further reproduction prohibited without permission.
This dissertation is honorably dedicated to my parents.
iv
Reproduced with permission of the copyright owner. Further reproduction prohibited without permission.
ACKNOWLEDGEMENTS
Above all, all praises and thanks are due to Allah, the most merciful and the most
gracious, the lord of mankind, who blessed me with his guidance, boundless bounties,
ample mercy, and endless help and support. I am sincerely very thankful to him for his
favors upon me in my life and throughout my educational journey. In him I trust.
My parents deserve a special and sincere acknowledgement for keeping their
hearts attached to me and my family overseas. Without their permanent support, patience,
concerns, and constant prayers, I would not be able to attain my goals.
During my academic journey that ultimately led to finishing this dissertation,
there were many people who have made significant contributions to its success, and they
deserve acknowledgement and appreciation. I am highly indebted to my dissertation
advisor and committee chair, Professor Carolyn M. Callahan, for her profound insights,
constructive ideas and valuable inputs, encouragement and support, concern about me
and my family, and professional mentorship not only in my dissertation stage but also
during my entire doctoral program. I am also grateful to the other members of my
dissertation advisory committee, Professor Gary D. Ferrier, and Professor Rodney E.
Smith for their valuable inputs, encouragement, and support.
Though words are truly inadequate in capturing her real sacrifice, my wife,
Nourah, deserves sincere thanks and great appreciation for her tireless support,
assistance, patience, and sharing my pleasure and my pressure. My dissertation would
have never been accomplished without her. Sincere thanks also go to my children Adel,
Abdulkareem, Sarah, Hassan, Omar, Malik, and Yunis for their patience and sympathy.
v
Reproduced with permission of the copyright owner. Further reproduction prohibited without permission.
My gratitude goes to my brothers, sisters, and the rest of my broad family
members and friends, who permanently were very concerned about me and my family.
Their support and prayers for me are appreciated.
Finally, I am also appreciative and thankful to all the staff of the Accounting
Department at the Walton College of Business, especially the head of department,
Professor Karen Pincus, for their help and support.
vi
Reproduced with permission of the copyright owner. Further reproduction prohibited without permission.
TABLE OF CONTENTS
ACKNOWLEDGEMENTS.................................................................................................... v
1. INTRODUCTION............................................................................................................... 1
2. MARKET OVERVIEW..................................................................................................... 4
2.1 Historical Glance of the Market....................................................................................4
2.2 Market Growth...............................................................................................................6
2.3 Market Structure & Performance................................................................................10
2.4 Trading Process............................................................................................................13
2.4.1 Types of Trading Orders...................................................................................... 18
2.4.2 Trading Commission............................................................................................ 19
2.5 Market Indexes........................................................................................................... 20
3. THE SPLIT POLICY AND ITS IMPORTANCE.......................................................... 21
4. LITERATURE REVIEW AND THEORY.....................................................................23
4.1 Information Content of Stock Splits.......................................................................... 24
4.1.1 Stock Split Decision Incentives.......................................................................... 25
4.1.1 .a Signaling Hypothesis...................................................................................26
4.1.1 .b Trading Range Hypothesis.......................................................................... 28
4.1.1. c Liquidity Hypothesis.................................................................................30
4.1.1 .d Survey Research on Stock Splits................................................................31
4.1.2 Factors Determining the Market Response to Split Announcements............... 32
4.2 Stock Changes around Stock Split..............................................................................36
4.2.1 Ownership Structure............................................................................................ 36
4.2.2 Volatility Changes............................................................................................... 37
4.2.3 Number of Trades, Turnover, and Volume........................................................ 37
5. THE FIRST STUDY........................................................................................................ 38
5.1 Hypotheses Development........................................................................................... 38
5.2 Research Methodology............................................................................................... 39
5.2.1 Study Sample Selection.......................................................................................39
5.2.2 Data Collection.................................................................................................... 40
5.2.3 Research Design.................................................................................................. 41
5.3 Analysis and Results................................................................................................... 43
5.3.1 Sample Characteristics.........................................................................................43
5.3.2 Discussion.............................................................................................................51
5.3.3 Results...................................................................................................................61
5.4 Sensitivity Tests...........................................................................................................63
6. THE SECOND STUDY................................................................................................... 64
6.1 Hypotheses Development......................................................................................... 64
vii
Reproduced with permission of the copyright owner. Further reproduction prohibited without permission.
6.2 Research Methodology............................................................................................... 68
6.2.1 Study Sample Selection.......................................................................................68
6.2.2 Data Collection.................................................................................................... 68
6.2.3 Research Design and Model Specification........................................................ 69
6.3 Analysis and Results................................................................................................... 72
6.3.1 Sample Characteristics......................................................................................... 72
6.3.2 Descriptive Statistics of Model Variables..........................................................81
6.3.3 Correlations...........................................................................................................83
6.4 Regression Analysis and Discussion......................................................................... 86
6.4.1 Statistical Issues................................................................................................... 86
6.4.1.a Outliers..........................................................................................................86
6.4.1.b Multicollinearity.......................................................................................... 86
6.4.1 .c Heteroskedasticity..................................................................................... 87
6.4.2 Tests of Hypotheses............................................................................................. 87
6.5 Sensitivity Tests...........................................................................................................92
6.6 Conclusion and Implications......................................................................................92
7. THE THIRD STUDY........................................................................................................93
7.1 Hypotheses Development........................................................................................... 93
7.1.1 Ownership Structure............................................................................................ 93
7.1.2 Number of Trades, Turnover, and Volume.........................................................94
7.2 Research Methodology............................................................................................... 95
7.2.1 Study Sample Selection.......................................................................................95
7.2.2 Data Sources.........................................................................................................96
7.2.3 Research D esign.................................................................................................. 97
7.3 Analysis and Results................................................................................................... 98
7.3.1 Sample Attributes................................................................................................ 98
7.3.2 Tests of Hypotheses and Discussion................................................................. 107
7.3.2.a Ownership...................................................................................................107
7.3.2.b Trading Volume......................................................................................... I l l
7.3.2.C Number of Trades...................................................................................... 115
7.3.2.d Turnover......................................................................................................118
7.4 Conclusion and Implications.................................................................................... 121
8. LIMITATIONS................................................................................................................ 122
9. CONTRIBUTION........................................................................................................... 122
REFERENCES.................................................................................................................... 124
viii
Reproduced with permission of the copyright owner. Further reproduction prohibited without permission.
1.
INTRODUCTION
“A stock split (or forward split) is an event in which the firm decides to divide
each share of stock into multiple shares. Conversely, a reverse stock split is an event in
which a number of shares is combined into one new share” (Wu and Chan 1997). In
traditional theory, stock splits can be considered merely cosmetic changes in the equity
that have no economic significance to shareholders. However, empirical research does
not support this theory as stock split announcements are associated with positive
abnormal returns. The impact of stock split signals and their implications on share returns
and other investment aspects have been the focus of financial researchers for three
decades as evidenced by the large body of accounting and finance literature associated
with stock split issues.
The accounting and finance literature repeatedly documents a market reaction to
stock splits. The literature also provides plausible explanations of the motives driving
firms to initiate stock splits. One of the explanations provided is that stock splits serve as
a device to signal private information known by managers to market participants and
other interested parties (Brennan and Copeland, 1988) and (McNichols and Dravid,
1990). Another explanation suggests that firm managers intend to maintain the stock
price at a “preferred” or “optimal” trading range (Lakonishok and Lev 1987), whereas
Brennan and Hughes (1991) and Ikenberry et al. (1996) suggest that stock splits cause
investment analysts and dealers to reevaluate their firms and discover the private
information conveyed by managers (dual purpose). The financial literature also reveals
the factors that play a significant role in determining the magnitude of information
content of stock splits such as firm characteristics, split characteristics, and surrounding
1
Reproduced with permission of the copyright owner. Further reproduction prohibited without permission.
environment characteristics, including the degree of information richness in the trading
environment.
This study extends the literature on stock splits to an international stock market,
the Saudi Arabian capital market. It investigates a unique stock split policy urging
publicly traded firms to split their par values two-for-one. This policy was adopted on
December 14,1997, by the Ministerial Committee for Share Trading Supervision
(MCSTS), a governmental committee consisting of the minister of finance and national
economy, the minister of commerce and industry, and the governor of the Saudi
Monetary Agency.
The purpose of this research is to study the impact of this new public policy on
the market. I will approach this issue from three different perspectives. Each perspective
in itself comprises an independent research study. The first study investigates the market
response to the announcement of the new policy and the magnitude of abnormal returns
surrounding the announcement date. The study then investigates whether the policy
appears to have information content for market participants. The second study models
and relates the anticipated information content found in the announcement of the split
policy to the factors mentioned in prior literature to be responsible for driving split
information content and determines the magnitude and the direction of relationships
among them. The third study concentrates on investigating the changes made to the
market structure and whether or not the stated goals of the policy have been achieved.
In this research, decreeing stock split is empirically found to be associated with
information content. However, evidence gathered shows that the market reaction is mixed,
not in one direction. Some firms reacted positively (CAR=2.11%) considering the split
2
Reproduced with permission of the copyright owner. Further reproduction prohibited without permission.
decree as good news, while some other firms reacted negatively (CAR= -2.55%) considering
it as bad news. At the sector level, the cement industry is the only industry that demonstrates
positive cumulative abnormal returns. On the other hand, banking, manufacturing, and
service sector, in general, demonstrated negative cumulative abnormal returns. Surprisingly,
agriculture and electricity sectors demonstrated no reaction. No evidence that sectors differ in
their reactions is found. Further, the magnitude of abnormal returns is not associated with
share market price.
Examining the determinants of the market reaction to decreased stock split reveals
that only firm size and the book to market value ratio are significant. Firm size is
positively related to the market reaction, while book to market ratio is negatively related
to market reaction. These results imply that as the size of a firm increases, the magnitude
of abnormal return associated with the market reaction to the decreed stock split
increases, while as the book to market value ratio of a firm increases, the magnitude of
abnormal return decreases. The impact of firm size is greater in magnitude than that of
book to market ratio.
Finally, the stock split policy has attained some of its intended goals. First, there
is no empirical evidence that the total number of shareholders increased by the
implementation of the policy. Dissimilarly, volume is found to increase significantly for
some firms and decrease for other firms in the market. Similarly, number of trades is also
found to increase significantly for some firms and decrease for other firms in the market.
However, turnover, generally, has declined after the split. It can be concluded that the
execution of stock split has dual effects. These results have important implications for
Reproduced with permission of the copyright owner. Further reproduction prohibited without permission.
both policy makers and investors as they suggest that a stock split policy has differential
market effects that may be industry specific.
The remainder of this dissertation consists of eight sections. Section 2 provides an
overview of the Saudi stock market, while section 3 presents a detailed description of the
stock split policy enforced by the Saudi government. Section 4 furnishes a brief review of
previous stock split literature and provides a theoretical background for all three papers’
research hypotheses. Section 5, section 6, and section 7 are devoted to discuss separately
each study of the research papers of the dissertation. Each section presents research
hypotheses, methodology, analysis, and findings for each of the three respective studies.
Section 8 reports the caveats that could limit the scope of the results. Finally, section 9
indicates the incremental contribution made by conducting this research.
2. MARKET OVERVIEW
2.1 Historical Glance o f the Market
The first Saudi joint stock company, the Arab Automobile Company, was
established in the mid 1930’s. There were about 14 stock companies in 1975. In the late
1970’s, the number of large publicly traded companies and joint venture banks increased
due to Saudization1 of foreign banks and the rapid economic expansion. During this
period, major initial public offerings were made to generate the required capital for these
new firms.
In 1984, a Ministerial Committee, consisting of Minister of Finance and National
Economy, Minister of Commerce, and Governor of Saudi Arabian Monetary Agency
1 Saudization in this context means changing the nationality o f firms to Saudi nationality through selling
more than 50% o f their equity to Saudi citizens to become national companies as opposed to foreign firms.
4
Reproduced with permission of the copyright owner. Further reproduction prohibited without permission.
(SAMA), was formed by a royal decree to develop and set the standards, regulations, and
rules that promote the market operations. SAMA was delegated and charged with the
day-to-day regulation and supervision of the capital market. Share-trading intermediation
was also restricted to commercial banks since they operate under the umbrella of SAMA
in order to facilitate and improve the regulatory framework. Accordingly, commercial
banks established the Saudi Share Registration Company (SSRC) for the purpose of
providing central registration facilities for joint stock companies and settling as well as
clearing all shares trading transactions occurring in the market. An automated clearing
and settlement system was introduced in 1989 via sophisticated computer systems. The
Electronic Securities Information System (ESIS), which was developed and operated by
SAMA, was also introduced to the market in 1990 in order to provide market participants
with all trading information such as bid-ask share prices, number of trades, volume,...,
and daily market index. Moreover, ESIS was developed to enable investors to enter their
buying or selling orders and to follow up their status.
In October 6, 2001, “Tadawul,”2 the second electronic generation of securities
trading, clearing, and settlement system was launched to replace the old system (ESIS).
“Tadawul” is a highly sophisticated computer system. It allows electronic trading
accounts for all investors and provides depository service of traded shares. This system
also permits selling and buying several times during the day, along with other advanced
capabilities. Tadawul thus integrated the ESIS daily trading system with that of SSRC for
clearing and settlement into a comprehensive electronic system with more powerful
capabilities.
2 Tadawul is an Arabic word, which means trading. It refers to the name o f the current security trading
system.
5
Reproduced with permission of the copyright owner. Further reproduction prohibited without permission.
2.2 Market Growth
The market growth in capital, number of transactions, volume, and Riyal’s value
of traded volume increased significantly. Between 1990 and 1997, the year in which
stock split was adopted by the government, market capitalization increased by 130%, and
the all share index also increased by 99.8%. Volume also increased by 1747%,
transactions by 441% and value of traded shares by 1309%.
In contrast, between 1990 and 2003, those market indicators have increased
dramatically. Market capitalization has increased by 508%, the all share index by
352.9%, volume by 32641%, transactions by 4327%, and value of traded shares by
13300%. Table 1 depicts market growth in these indicators between 1990 and 2003,
showing the gradual year- by- year growth in the market.
TABLE 1
Development in Market Indicators 3
Year
1990
1991
1992
1993
1994
1995
1996
1997
1998
1999
2000
2001
2002
2003
Transactions
(thousands)
85
90
272
319
357
292
284
460
377
438
498
605
1034
3763
Shares Traded
(millions)
17
31
272
60
152
117
138
314
295
528
555
692
1736
5566
Value of traded
shares (billions)
4.403
8.527
13.698
17.36
24.871
23.226
25.397
62.06
51.509
56.578
65.292
83.601
133.787
596.510
Market
Cap.(billions)
97
181
206
198
145
153
172
223
160
229
254
275
281
590
All Share
Index
980
1,788
1,889
1,793
1,282
1,368
1,531
1,958
1,413
2,058
2,258
2,430
2,518
4,438
3 Monetary values are in Riyal, which is the local currency o f Saudi Arabia. Exchange rate is 3.75 Riyals
for a US Dollar.
6
Reproduced with permission of the copyright owner. Further reproduction prohibited without permission.
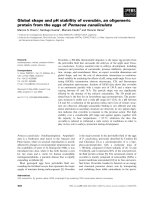
The number of transactions has grown year after year from 85000 in 1990 to
460,000 in 1997 and eventually to 3,763,000,000 in 2003. The graph on Figure 1 reflects
the steadfast growth in the number of transactions, and the huge jumps that happened in
2002 and 2003.
FIGURE 1
Growth in Transactions
w
|
|
c
H
o
|
4000
3500
3000
2500
2000
1500
1000
500
z
0
s
|
Transactions
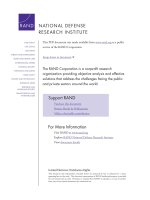
Volume (number of shares traded) increased between 1990 and 1992 from 17
million shares to 272 million shares, an increase of 15 times. From 1993 to 1996, it
declined from the level reached in1992 with an increasing trend. From 1997 on, the
volume increased dramatically until it reached five billion and five hundred sixty six
million shares in 2003, an increase of almost 17 times from 1997. The chart on Figure 2
represents the growth took place in the number of shares traded. The huge jump
happened in year 2002 and 2003.
7
Reproduced with permission of the copyright owner. Further reproduction prohibited without permission.
FIGURE 2
Growth in Shares Traded
Shares Traded
Year
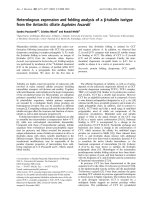
Market capital also grew between 1990 and 1997. It grew from 97 billions Saudi
Riyals (SR) in 1990 to SR 223 billions in 1997, an increase of 130%. Between 1997 and
2003, market capital grew vividly from SR 223 billions in 1997 to 590 billions in 2003,
with an increase of 165 %. Market growth is represented in the chart on Figure 3.
FIGURE 3
Growth in Market Capital
700
600
500 400 300 200
100 «
-♦— Market Capital
Years
8
Reproduced with permission of the copyright owner. Further reproduction prohibited without permission.
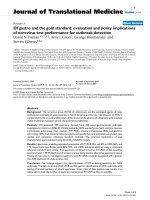
The value of traded shares grew as the volume in the market grew. This value
grew from SR 4.403 billions in 1990 to SR 62.06 billions in 1997, with an increase of
approximately SR 58 billions (1309 %). Furthermore, the value increased more between
1997 and 2003 to SR 596 billions with an increase of approximately SR 534 billions from
the value in 1997 (860 %). The historical growth in the value of traded shares is depicted
in Figure 4.
FIGURE 4
Growth in the Value of Traded Shares
Value of Traded Shares
o
05
05
T—
05
CM
o>
T—
a>
T—
05
co
05
05
T—
o>
o>
T—
LO
05
05
v-
CO
05
05
05
05
T
— T—
05
o
05
o
05
T
—o
CM
CO
05
05
vo
o
CM
CM
O
O
CM
CO
O
O
CM
Year
The market index rose by 99.8% from 1990 to 1997. Return on the market index,
therefore, almost doubled in less than eight years. Surprisingly, the market index also
increased 2480 points in the year 2003 from its level in 1997. This skyrocketing rise
represents 127% increase over index reading in 1997. Totally, the market index rose
353% between 1990 and 2003. The chart depicted in Figure 5 reflects this trend.
9
Reproduced with permission of the copyright owner. Further reproduction prohibited without permission.
FIGURE 5
Growth in the Market Index
5000 n
*
4000 A
1
3000-]
|
2000
-1
S 1000
-j
0
H
index
1--------------1-------------- 1--------------1-------------- 1--------------1---------------1--------------1-------------- 1--------------1-------------- 1--------------1-------------- r
Years
2.3 Market Structure & Performance
The Saudi capital market is the largest capital market in the Middle East. It
operates in the largest economy in the region. It consists of seven sectors: banking,
manufacturing, cement, services, electricity, agriculture, and telecommunications sector,
which has been launched recently with new two telecommunications firms.
As of December 31, 2003, the total number of listed firms in the Saudi capital
market was 70 firms that are distributed among the market sectors. The banking sector
includes 9 national banks. The manufacturing sector includes 24 companies. The cement
sector includes 8 companies. The service sector includes 18 companies. The
telecommunications sector included one company. The agricultural sector includes 9
companies. Finally, the electricity sector includes one large company that came into
existence from merging several working electricity companies in all provinces of the
country.
10
Reproduced with permission of the copyright owner. Further reproduction prohibited without permission.
At the end of 2003, based on Tadawul 2003 report, the entire market
capitalization was approximately SR 590 billions. The largest sector by market
capitalization is the banking sector, which at the end of this year was capitalized at SR
176.2 billion, 30% of the total market capitalization. The second largest sector by market
capitalization was the manufacturing sector with SR 134 billions, 22.73%. The
telecommunications sector occupied the third with SR 126.83 billions, 21.5%. The fourth
sector in capitalization was the electricity sector with SR 84.4 billions, 14.3% of market
capitalization. The Cement, service, and agricultural sectors occupied the fifth, the sixth,
and the seventh respectively, with SR 43 billions (7.3%) for the cement sector, 23 billions
(4%) for the service sector, and 2.5 billions (0.42%) for the agricultural sector.
In terms of transactions, the number of transactions executed in the market during
2003, based on Tadawul report, was 3.8 million transactions. The most active sector was
the service sector with about 1.22 millions transactions, 32% of total transactions
executed in the market. The least active sector was the cement sector with about 109
thousands transactions, 2.9 % of transactions executed in the market.
The volume traded in the market during 2003, based on the same previously
mentioned report, was approximately 5.6 billion shares. The most active sector in volume
traded was the service sector with about 2.3 billion shares, 41% percent of volume of the
entire market, whereas the least active sector with respect to volume traded was the
banking sector with approximately 87 million shares, 1.6%. On the other hand, the value
of shares traded in the whole market was approximately SR 596.5 billions where the
manufacturing sector had the biggest stake in this value by attaining SR 171.55 billion in
11
Reproduced with permission of the copyright owner. Further reproduction prohibited without permission.
value traded, 28.8 % of the market traded value. The least sector in value traded was the
agricultural sector with 8.5 billions, 1.4% of the market.
The total number of outstanding shares of the entire market as of December 31,
2003 is 2,347,147,371 common shares. The largest sector in number of shares was the
electricity sector, which had about 833.318 million shares, 35.5% of the total number of
shares in the market. The least sector in number of shares was the agricultural sector with
36 million shares, 1.5 % of the total number of shares in the market.
During the fiscal year of 2003, the total earnings attained for all listed firms in the
market added up to SR 18,991.85 millions, the portion of each market sector was as
follows:
The banking sector SR 8.259 billions, 43.4% of the market earnings
The manufacturing sector SR 3.671 billions, 19.3% of the market earnings
The cement sector SR 2.171 billions, 11.4% of the market earnings
The service sector SR 276.83 millions, 1.4 % of the market earnings
The electricity sector SR 1.077 billion, 5.6% of the market earnings
The telecommunications sector SR 3.545 billions, 18.66% of the market earnings
The agricultural sector SR -10.09 millions, a mixture of some gains and some losses
The banking industry is, therefore, the most profitable sector in the market,
followed by the manufacturing industry and the telecommunications industry.
Shareholders’ equity at the end of 2003 for the entire market reached SR 182.8
billions. The distribution of this amount across market sectors makes the manufacturing
sector at the top of all sectors with SR 48.05 billions, 26.3% of the market. The banking
sector is second with SR 43.2 billion of shareholders’ equity, 23.6% of the market equity.
12
Reproduced with permission of the copyright owner. Further reproduction prohibited without permission.
The third sector is the electricity sector with shareholders’ equity of SR 42.8 billions,
23.4 % o f the market equity. The telecommunications sector, service sector, cement
sector, and agricultural sector follow in terms of shareholders’ equity respectively.
The dividends distributed to shareholders for the year 2003 by the entire market
were SR 11.348 billions. The banking sector alone distributed SR 6.4 billions, the largest
dividends among market sectors. This amount represents 56.4 % of the total market
dividends. The least sector in dividend distribution was the agricultural sector with
dividends of only 13.75 millions.
In 2003, Earning per share (EPS) ranged from SR 41.05 to SR 5.51 for the
banking sector. In the manufacturing sector, the range of EPS was from SR 16.78 to -SR
7.53. The cement sector had a range of EPS of SR from 35.56 to SR 5.63. EPS of the
service sector ranged from SR 19.73 to SR -14.12. The electricity sector had EPS of SR
1.97 as it consists only of one large company. The telecommunications sector also
consists of one company with EPS of SR 11.82. Finally, the agricultural sector’s EPS
ranged from SR 2.86 to SR -2.32. The banking, cement, and telecommunications sectors
were the best sectors in the market in terms of EPS. Furthermore, all listed firms in the
three sectors generated profit. In contrast, the manufacturing, service, and agricultural
sector had low EPS in general with some unprofitable firms.
2.4 Trading Process
The trading process in the stock market has evolved gradually with the
advancements introduced to the working mechanism of the market. So, if we are to
understand the progress made in trading process, we need to trace back the advancements
made to the market mechanism.
13
Reproduced with permission of the copyright owner. Further reproduction prohibited without permission.
Before early 1980’s, the stock market was informal. The trading process during
that period was primitive and manual. For investors to buy or sell at this time, they
needed to meet personally or through informal intermediaries to brokers and trade with
each other the number of shares they wanted to trade. The proof of ownership of shares
was “certificate of shares”, which indicated the number of shares owned by an investor in
the respective company. The certificate was issued by the joint stock companies. When a
trade was agreed upon by the buyer and the seller, they or their representatives went to
the company in which the shares were traded to transfer the ownership of shares from the
seller to the buyer. A new certificate of shares would then be issued for the buyer
including the number of shares traded. Also another certificate of shares would be issued
for the seller if not all of the shares in the earlier certificate of shares were sold. The
trading process thus took nearly a week, including the time needed by departments of
shareholders relations in joint stock companies to transfer the ownership.
Trading during this era was ineffective, inconvenient, impractical, and time
consuming. Meanwhile, it did not enable investors to trade large number of shares easily.
All these trading barriers drove high transaction costs.
In 1984, a Ministerial committee for share trading supervision (MCSTS) was
appointed by the Saudi government to include the minister of finance and national
economy, the minister of commerce, and the Governor of SAMA. The goal of this
committee was to supervise share trading and develop the rules and regulations that
govern share trading market. MCSTS delegated the authority of daily trading supervision
and regulations of this trading to SAMA. SAMA, in its turn, established a new division,
Shares Trading Control, within its organizational structure to cope with the new
14
Reproduced with permission of the copyright owner. Further reproduction prohibited without permission.
delegated task. In the meantime, SAMA delegated share intermediation to banking sector.
“Banks are, however not allowed to buy and sell stocks for their own accounts, act as
market makers, or maintain inventory for trading purposes”(Henry Azzam, 1997). SAMA
delegated share intermediation to banks because the banking sector is under its direct
supervision and owns a widespread network of banking branches in all over the country
that can serve as the best intermediaries for share trading. The decision of delegation of
intermediation to the banking sector, in my opinion, is effective and efficient for three
reasons. First, it saved the efforts in establishing a new organizational body to be in
charge of intermediation in the stock market. Second, It made it easier for individuals
investors to approach the banking branch nearest to them and place an order. Finally,
SAMA could supervise the banking sector easily in terms of intermediary activities since
this sector had been under its supervision since 1952.
In this stage, share trading became easier than it was in the earlier period.
Investors could buy and sell through banking branches provided stock intermediation
service without the burden of searching for stock owners to trade with. However, the
procedures of finalizing trades were very slow and manually done. When a trade took
place, the bank would document the transaction and send the documentation to the
publicly traded firm whose shares were traded. The firms then would take the necessary
procedures to transfer the ownership of traded shares from the seller to the buyer and
reissue a “certificate of shares” as a proof of ownership.
Although some trading convenience and a somewhat formal market had been
created by banking intermediary role, the trading system still had more to improve.
Keeping in permanent contacts with publicly traded firms to transfer the shares
15
Reproduced with permission of the copyright owner. Further reproduction prohibited without permission.