BIG SHOES TO FILL THE POTENTIAL OF SEAWALLS TO FUNCTION AS ROCKY SHORE SURROGATES
Bạn đang xem bản rút gọn của tài liệu. Xem và tải ngay bản đầy đủ của tài liệu tại đây (1.16 MB, 100 trang )
BIG SHOES TO FILL: THE POTENTIAL
OF SEAWALLS TO FUNCTION AS
ROCKY SHORE SURROGATES
SAMANTHA LAI
BSc. (Hons.), NUS
A thesis submitted for the degree of Master of Science
Department of Biological Sciences
National University of Singapore
2013
Declaration
I hereby declare that this thesis is my original
work and it has been written by me in its entirety.
I have duly acknowledged all the sources of
information which have been used in the thesis.
This thesis has also not been submitted for any
degree in any university previously
____________________
Samantha Lai
August 2013
Acknowledgements
I would like to extend my heartfelt gratitude to my supervisor, Dr. Peter Todd,
whom without which, I would never have taken up this MSc, much less see it to
completion. He has been unfailingly supportive, encouraging and been an endless
source of advice. Being in his lab has been one of the best experiences of my life, and
has changed me for the better (I hope).
I have to thank my fellow EMEL labbies: fellow seawall auntie, Lynette, for
suffering with me, through fieldwork, endless specimen sorting, and painful statistic
courses; and the Twinnies, Siti and Mei Lin, for being there for me every time I
needed a sympathetic ear, good advice, or a cold beer. You guys are more than
friends, you’re family.
A huge thank you to all my friends and fieldwork volunteers, who have helped
in one way or another throughout my project: Samuel, Ross, Ian, Aizat, Brian,
Henrietta, Jamie, Desmond, Aaron, Ambert, Karmun, ZiXing, Karen, Yasmin, Yuen
May, Wan Ting and Kareen.
I am also grateful to the Singapore Delft-Water Alliance, who had provided
me with a salary, a grant and allowed me to pursue my Master’s while working as a
Research Assistant.
Thank you to: Shao Wei, Sentosa Development Corporation, and Shangri-La
Rasa Sentosa, for allowing me to conduct my research on Tanjong Rimau; MINDEF
and SAF Mapping Unit, who have kindly permitted me to use their topographical
maps to map the coastal changes in my first chapter; and the boat crew of Heng Lee
Charter, for being extremely helpful even at 5am in the morning.
Finally, although I know no amount of thanks will ever suffice, I want to thank
my parents, who have been so endlessly (and unquestioningly) supportive, even when
it meant taking over the freezer to store twelve months’ worth of specimens. Last but
not least, thank you Keith, for being my rock.
i
Table of contents
Acknowledgements .........................................................................................................i
Table of contents ........................................................................................................... ii
Summary ....................................................................................................................... iv
List of Tables................................................................................................................. vi
List of Figures ..............................................................................................................vii
General introduction to the thesis ................................................................................. 1
Chapter 1: Coastal change in Singapore: Habitats lost and gained ............................ 6
1.1 Introduction.......................................................................................... 7
1.2 Materials and methods........................................................................ 10
1.3 Results ............................................................................................... 13
1.3.1 Mangrove forests .............................................................. 13
1.3.2 Intertidal reef flats ............................................................ 10
1.3.3 Sand and mudflats ............................................................ 13
1.3.4 Present coastline and seawall distribution ......................... 13
1.4 Discussion .......................................................................................... 17
Chapter 2: Are seawalls good surrogates for rocky shores communities? ............... 23
2.1 Introduction........................................................................................ 24
2.2 Materials and methods........................................................................ 29
2.2.1 Study sites ........................................................................ 29
2.2.2 Survey technique .............................................................. 31
2.2.3 Measurement of physical parameters ................................ 32
2.2.4 Statistical analyses ............................................................ 33
2.3 Results ............................................................................................... 35
2.4 Discussion .......................................................................................... 42
ii
Chapter 3: Trophic ecology of the intertidal: A dual stable isotope (δ 13C, δ15N)
analyses of dominant seawall and rocky shore species ............................................... 49
3.1 Introduction........................................................................................ 50
3.2 Materials and methods........................................................................ 55
3.2.1 Sampling method .............................................................. 55
3.2.2 Stable isotope analysis ...................................................... 55
3.3 Results ............................................................................................... 58
3.4 Discussion .......................................................................................... 67
Overall conclusions of the thesis ................................................................................. 72
References .................................................................................................................... 76
iii
Summary
Land reclamation and coastal development have converted or degraded large
areas of natural intertidal habitats in Singapore, resulting in the loss of mangrove
forests, coral reefs and sand/mudflats. The disappearance of these habitats was
documented between the 1950s and the 1990s, but there has been no assessment of
the changes that have occurred during the past two decades. Chapter 1 quantifies the
significant coastal transformations over this period and evaluates the future of marine
habitat conservation and sustainability in Singapore. Analyses of topographical maps
indicate that total cover of intertidal coral reef flats and sand/mudflats has decreased
largely due to extensive land reclamations, while mangrove forests have increased
slightly due to restoration efforts, greater protection, and relative isolation from
development. However, 15 and 50-year projections based on Singapore’s 2008
Master Plan and 2011 Concept Plan show that all habitats are predicted to shrink
further in coming years. In their place, the total length of seawalls is set to increase,
from 319.23 km of presently to more than 600 km by 2060.
Most studies have focused on the destructive nature of marine artificial
structures; however researchers are beginning to move beyond their negative impacts
and focusing on assessing and modifying artificial habitats as surrogates for natural
ones. Given the ubiquity of seawalls and their potential for supporting coastal
communities, it is important that conservationists embrace ecological engineering as
an additional tool to conserve near shore biodiversity. Chapter 2 focuses on
comparing the communities on seawalls with those of natural rocky shores to evaluate
the artificial habitat’s potential as a surrogate of the natural one. A year-long survey
of both habitats revealed that seawalls had a different community structure to rocky
iv
shores, with lower algal and faunal diversity in general, but a higher presence of
detritivorous isopods. These results suggest that seawalls Singapore lack the primary
productivity to support high trophic levels, leading to a fewer number of species and
abundance overall. There was, however, a substantial overlap in the species found in
both habitats, indicating that while seawalls are still limited by the lower primary
productivity, they have the potential to host a similar range of species to rocky shores.
Understanding the trophic interactions of common intertidal species can help
further elucidate the ecological causes for the community differences observed
between seawalls and rocky shores. In Chapter 3, δ15N and δ13C isotopes were used
to examine the diets of several common species found in both habitats. The isotopic
values were highly variable due to the diverse diets of many of the species, although
there was little evidence to show that the diets were substantially different between
habitats. Turf algae were the most dominant food source among the herbivores, while
these herbivores were the dominant food species for the secondary consumers. The
detritivorous isopods (abundant on seawalls) were, however, of a much lower trophic
level, and most likely fed on decaying algae. This supports the conclusions from
Chapter 2, i.e. that seawalls lack the productivity to sustain the higher trophic levels
and complexity needed for high biodiversity. These findings allude to the possibility
of improving seawall capacity to support greater diversity by increasing algal
diversity and abundance.
v
List of Tables
Table 2.2.1
Transect width, length and shore angle of both seawalls and rocky
shores at each site.
Table 2.3.1
Pair-wise comparisons between rocky shore and seawall
communities for each site over all months. * - significance < 0.05,
** - significance < 0.01, *** - significance ≤ 0.001
Table 3.3.1
δ13C (‰) and δ15N (‰) (average ± SE) of common sources
(suspended particulate matter and algae) and consumers
(crustaceans and molluscs) on rocky shores and seawalls.
Table 3.3.2
Range of proportion contributions of six sources towards the diets
of primary consumers from the IsoSource mixing model.
Table 3.3.3
Range of proportion contributions of six sources towards the diets
of secondary consumers from the IsoSource mixing model.
vi
List of Figures
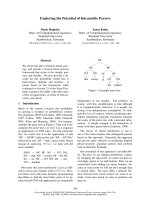
Fig. 1.3.1
Distribution of mangroves in 2011 (in red, from present study),
1993, 1975 and 1953 (from Hilton and Manning, 1995).
Fig. 1.3.2
Distribution of coral reefs in the Southern Islands (in blue) and
sand/mudflats around P. Ubin and P. Tekong (in red) in 2011.
Fig. 1.3.3
Distribution of seawalls (in orange) in 2011.
Fig. 1.3.4
Coastline changes proposed in the 2008 Master Plan (blue) and
2011 Concept Plan (red dotted line).
Fig. 2.2.1
Map of Singapore with study sites marked with
Fig. 2.2.2
Calculation of transect width based on average shore angle (x°).
Fig. 2.3.1
Average algal species richness (green) and faunal species richness
(red) over the year on rocky shores and seawalls.
Fig. 2.3.2
PCO plot of the community in each habitat, of each site every
month, overlaid with correlated variables of r >0.5 – turf algae,
Cronia margariticola and Ligia exotica. Blue – seawall; green –
rocky shore
Fig. 2.3.3
CAP plot of the community in each habitat, of each site every
month. Orange squares – St. John’s 1; blue triangles – St. John’s
2; green triangles – P. Tekukor; red squares – Sentosa.
Fig. 2.3.4
Correlation between average algal species richness (green) and
faunal species richness (red) with shore height chart datum in both
rocky shores and seawalls.
Fig. 2.3.5
PCO plot of the community in each habitat of each site, with
overlaid of correlated variables of r > 0.5 – slope angle and
rugosity. Blue – seawall; green – rocky shore.
Fig 3.3.1
Scatterplot of average δ13C (‰) vs δ15N (‰) values of food
sources (error bars indicate SE). Green triangles - algae (SPM is
out of graph), black circles - consumers. SPM excluded from plot
for better resolution.
Fig. 3.3.2
Average δ15N (‰) for each taxon (error bars indicate SE). Green
triangles - algae (SPM is out of graph), black circles - consumers.
Boxes delineate algae and primary consumers (A), carnivores (B),
and barnacles (C).
Fig. 4.1.1
Seagrass patch in the reclaimed sandy lagoon between two
seawalls, with Tanah Merah ferry terminal visible in background.
Photo courtesy of Ria Tan.
vii
General introduction to the thesis
1
The conservation of biodiversity is becoming increasingly difficult in urban
environments. Traditionally, environmental managers have aimed to protect native
species by safeguarding their habitats from degradation, allowing them to thrive
within protected areas (Rosenzweig, 2003). However, in cities and countries where
populations can reach very high densities, the demand for land can supersede the need
to conserve natural spaces (Miller, 2005). Singapore is a prime example of this
struggle between conservation and development. This city-state’s economic output,
social structure and physical landscape has transformed radically over the past
century. From a British colonial trading outpost, Singapore now has one of the
highest gross domestic product (GDP) per capita and standards of living in the world
(World Bank, 2012). The resident population has also grown dramatically, from just
over 2 million people in 1970 to 3.8 million in 2012, in a country with a total area of
just 714 km2 (Singapore Department of Statistics, 2013). This combination of rising
affluence and expanding population has created great pressure on the very limited
land area, and the Singapore Government has addressed this problem partly by
reclaiming large stretches of land along the coast. Reclamation has caused many of
Singapore’s natural coastal habitats, and consequently associated biodiversity, to be
irreversibly lost (Hilton and Manning, 1995).While there have been attempts to
conserve marine biodiversity through protection of key habitats (e.g. Sungei Buloh
Wetland Reserve), this strategy is seen as impractical among policy-makers due to the
value of the land, and incompatible with the Government’s priority of economic
development. It is becoming increasingly apparent that to maximise the efficacy of
conservation in Singapore, other options aside from habitat protection need to be
employed.
2
Restoration and reconciliation are two such options. Restoration aims to
return a degraded environment back to its original state, thus restoring its function
and value (Edwards and Gomez, 2010). While this has been attempted for mangroves
in Singapore (Liow, 2000), it is similar to the habitat conservation approach in that it
requires a commitment to repair and maintain an area in its natural state, necessarily
excluding it from human utility (other than activities in line with the area’s
conservation). Additionally, restoration of a habitat is rarely fully successful and is
almost always costly, especially in the case (of Singapore) where the habitats have
been completely destroyed or are extremely degraded. More recently, the concept of
reconciliation has been introduced as an alternative to restoration and habitat
protection (Rosenzweig, 2003). Reconciliation seeks to modify anthropogenic
structures and habitats to improve their capacity to support wild species, while still
allowing them to serve their intended functions. It has the additional benefit of
encouraging interactions between humans and the natural environment in an
increasingly disconnected society, which can serve to improve public support for
conservation as well as enhance personal well-being (Miller, 2005). There have been
attempts at reconciliation in a variety of habitats. In China, cliff faces of abandoned
quarries were drilled with holes to encourage the growth of native climbing plants
(Wang et al., 2009), while in the United Kingdom, roof garden substrates have been
altered to mimic nesting sites of the black redstart, Phoenicurus ochruros (Grant,
2006). Current efforts are underway to improve the ability of these gardens to recruit
invertebrates of conservation concern (Grant, 2006). In Singapore, park connectors
were created to improve biological connectivity between green areas (e.g. nature
reserves, parks etc.) while serving as a recreational space for the general public
(Sodhi et al., 1999).
3
Given that Singapore is an island-state with many artificial coastal structures
(e.g. man-made beaches, jetties, seawalls, breakwaters), there are plenty of
opportunities for reconciliation. The potential of these types of urban habitats have
not gone unnoticed elsewhere. Seawalls in particular, have been extensively studied
in temperate regions as surrogates for other hard substrate habitats such as rocky
shores, and there have been various attempts to improve the species carrying capacity
of these structures. Chapman and Underwood (2011) categorised the efforts into
‘soft’ and ‘hard’ approaches. The soft approach requires the removal or
rearrangement of the wall, replacing it with natural habitats (e.g. marshes, sand
dunes) or creating a hybrid environment, which combines natural vegetation with the
walls. The hard approach, on the other hand, deals with physical manipulation of the
wall, either by changing the slope angle or increasing its surface complexity, to
improve its ability to recruit intertidal assemblages. These two strategies have
different outcomes as the resulting habitats are often suited for a different assemblage
of species. The soft approach favours soft-sediment infauna, while the hard approach
is generally more relevant to hard-substrate benthic taxa.
In this thesis, I examine the potential for seawall reconciliation in Singapore,
in particular, the capacity of these walls to act as surrogates for rocky shore species.
Rocky shores used to be common along the southern coastline of Singapore stretching
inshore from the intertidal coral reef flats, but have been reduced to a single 300 m
stretch on the mainland (Todd and Chou, 2005). They are, however, still present on
several of the Southern Islands, although most have been fragmented by seawalls and
jetties. If rocky shore communities can recruit onto the seawalls, they may yet be
conserved in the face of future coastal development. Chapter 1 provides an overview
of coastal change in Singapore in the last two decades and a projection of future
4
changes for the next 15 to 50 years, and documents the increasing pervasiveness of
seawalls as a novel coastal habitat. Chapter 2 examines the communities currently
existing on seawalls around the Southern Islands in Singapore, and compares them to
those in adjacent natural rocky shores to assess their suitability as a rocky shore
surrogates. To further elucidate and understand the findings of Chapter 2, trophic
interactions of common species are investigated in Chapter 3 using stable isotopes.
5
Chapter 1
Chapter 1: Coastal change in Singapore:
Habitats lost and gained
6
Chapter 1
1.1 Introduction
Coastal populations worldwide have been growing rapidly. In 2003,
approximately three billion people lived within 200 km of the sea, and this number is
set to double within the next 15 years (Creel, 2003). As these cities are predicted to
expand, land reclamation is one of the few options available for satisfying demands
for space. The rate of accompanying coastal armouring may also be accelerated by
sea level rise and more frequent storms as a consequence of global climate change
(Moschella et al., 2005). The resulting loss of natural shores and gain in artificial ones
has profound implications on how marine species can be conserved in this urban
setting. The extreme urban development in the island nation of Singapore serves as an
highly illustrative case study of the ecological future that many coastal cities may
eventually face, especially in still less developed but currently rapidly developing
countries.
Singapore’s coastal landscape has been altered extensively since British
colonial establishment in 1819. As it has grown into a Southeast Asian economic
powerhouse, its coastline has been slowly shifting seawards via land reclamation to
accommodate ports, industries, infrastructure, parks, and homes. Many opine that
Singapore’s development has been at the expense of its natural habitats (Brook et al.,
2003; Chou, 2006; Castelletta et al., 2008) and that the government’s priorities have
been geared towards economic progress largely ignoring the need to maintain
biodiversity and forgoing opportunities to integrate growth with ecological
sustainability (Hilton and Manning, 1995). Widely-employed management tools, such
as environmental impact assessments (EIAs) are inadequately developed and there is
no legislation making them mandatory (Chun, 2007). Even when they are conducted,
7
Chapter 1
they are often restricted to the immediate stakeholders, and exclude public
involvement (Chou, 2008). Singapore has only two marine protected areas, both of
which are located on coastal areas of the mainland, with very little protection
accorded to the variety of marine habitats situated around its offshore islands. What
little legislation to safeguard marine biodiversity and habitats exists is limited and
outdated, and lacks the applicability and scope to deal with contemporary
environmental issues (Lye, 1991, Chun, 2007).
Hilton and Manning (1995) documented the historical coastal changes of
Singapore up to 1993 and showed that coastal habitats had been systematically
converted or destroyed, and their evaluation of the government’s approach to
sustainable development was candidly critical. From 1922 to 1993, areas of
mangroves (75 km2 reduced to 4.83 km2), coral reefs (32.2 km2 reduced to 17 km2)
and intertidal sand/mudflats (32.75 km2 reduced to 8.04 km2) shrank dramatically.
During this time, the percentage of natural coastline dropped from 95.9% to 40%.
However, the extensive coastal straightening that resulted from the multitude of land
reclamation projects actually led to an overall decrease in coastline from 528.84 km
in 1953 to 480.19 km in 1993. Hilton and Manning (1995) projected that, by 2030,
land reclamation would eventually increase the coastline to 531.81 km. They
ultimately concluded that the Singapore government’s approach to managing
resources was not in line with their stated commitments to protect biodiversity and
achieve sustainable development.
It has been eighteen years since Hilton and Manning’s (1995) paper was
published and Singapore’s physical, as well as social landscape has changed
significantly during this time. The resident population has swelled by over 40%, to
reach 3.8 million in 2012. Demand for land remains high, and reclaiming land from
8
Chapter 1
coastal areas remains one of Singapore’s key strategies to alleviating this need. Land
area has also increased by 14% to 714.3 km2 (Singapore Department of Statistics,
2013). The length of Singapore’s artificial coastlines has concomitantly increased,
while natural shoreline has decreased. Reclamation is so extensive along the southern
coast of Singapore, that the only remaining natural stretch is a 300 m wide rocky
shore in Labrador Park (Todd and Chou, 2005). As the coastline becomes
progressively altered, there is a need for paradigm shift in the way artificial habitats
are perceived and designed. These habitats include armoured revetments built to
protect the coast; and usually come in the form of seawalls, representing a variety of
slopes, materials and designs, which have the potential to host substantial levels of
biodiversity (Glasby and Connell, 1999). It is imperative that the current extent of
natural and artificial shores, and how these habitats are likely to be impacted in the
future, is known. Hence, this paper aims to quantify the transformations to
Singapore’s coastline over the past two decades and predict future changes based on
the Singapore Government’s 2008 Master Plan and 2011 Concept Plan.
9
Chapter 1
1.2 Materials and methods
Estimates of mangrove, coral reef and intertidal sand/mud flats were obtained
from the 2002 and 2011 1:50,000 topographic maps published by the Singapore
Armed Forces Mapping Unit. The boundaries of each fragment of habitat were traced
in ArcGis 10.0 (ESRI®, 2012) which was also used to calculate the area of each
habitat. Hilton and Manning (1995) performed this using the squares method,
although differences in estimation due to technique are not likely to be very large.
Areas of remaining mangroves marked in the topographic maps included
remnant patches that once lined the estuaries of Sungei (=River) Poyan and S. Besar
along the northern coastline, both of which have now been converted to freshwater
reservoirs. These remnants are no longer connected to the marine environment, and
were therefore not calculated within the total area of mangroves. On the other hand,
some fragments not recorded in the topographic maps were included based on a
contemporary publication by Yee et al. (2010) which documented the extent of
mangroves in 2010. Accessible areas were ground-truthed by the first author to
confirm their presence in 2013. Compared to Hilton and Manning (1995), these
estimates of mangrove area are probably more accurate as (1) the ArcGIS mapping
technique employed in this study is less likely to overestimate the area in complex
configurations than the squares method; (2) the areas marked out in this study were
based on ground-truthed data collected by the authors and Yee et al. (2010).
My estimates of the intertidal coral reef and sand/mudflat areas were based
solely on the topographic maps. The categorisation of the reef flat areas and sand/mud
flats can be challenging as the delineation between intertidal sands and reefs is not
always clear, and there tends to be an overlap of the two habitats, particularly in the
10
Chapter 1
Southern Islands. Parts of the intertidal areas around Pulau (=Island) Pawai, P.
Senang and P. Semakau, previously labelled as ‘intertidal sands’ are marked as coral
reefs in contemporary maps. The coral reef areas marked out on the topographic maps
used here represent intertidal reef flats only. The sub-tidal reef slopes are excluded,
but as these are steep and shallow, they represent a small area relative to the intertidal
flat. Some underestimations are possible, but these would be consistent with Hilton
and Manning’s (1995) past calculations, hence allowing for direct comparisons.
The present length of seawalls was determined based on satellite images from
Google Earth™ mapping service (Google, 2009), data collected from groundtruthing, and observations from various researchers who have conducted studies
around Singapore’s coasts. Seawalls were traced onto the 2011 topographic map
using ArcGis 10.0 (ESRI®, 2012) and grouped into three categories: sloping and ungrouted, sloping and grouted, and vertical. Sloping walls generally have a slope
between 14 to 35° (Lee et al., 2009b) and consist of granite rip rap that is often
grouted with mortar to fill in the crevices between rocks. Vertical walls are typically
made of cement and are usually found in port areas. Categorisation was based on the
satellite images (the resolution was generally high enough to discern between sloping
and vertical walls), personal observations, or inferred from the use of the area (e.g.
walls in docks were assumed to be vertical).The total area covered by sloping
seawalls was obtained by multiplying the total length by 10.54 m, i.e. the average
width of seawalls calculated from seawall measurements provided by Lee et al.
(2009). It was not possible to calculate the average width of vertical seawalls as these
data are not published and the ports and docks where they are found have restricted
access. The total length of the coastline around Singapore (combining both mainland
11
Chapter 1
and offshore islands) was obtained by adding the non-armoured and natural lengths of
the coastline, which were also digitised using ArcGis 10.0 (ESRI®, 2012).
The predicted conversion of coastal habitats over the next decade, including
changes in mangrove, coral reef and sand/mudflat areas, as well as seawall length,
were determined using the 2008 Singapore Urban Redevelopment Authority’s (URA)
Master Plan and 2011 Concept Plan. The Master Plan is a statutory land use plan that
directs development over the next 10 to 15 years while the longer-termed Concept
Plan guides development over the next 40 to 50 years (URA, 2008). Natural habitats
in areas slated for future development or reclamation were considered to be
destroyed, and the new resultant coastlines were assumed to be protected with
seawalls. Habitats not directly affected by the developments were presumed to remain
the same size over the period.
12
Chapter 1
1.3 Results
The area of intertidal reef flat and sand/mudflat have declined further since the
last estimates of the natural coastal habitats in Singapore in 1993 (Hilton and
Manning, 1995). Over the last two decades, continued development and land
reclamation along the southern coastline and offshore islands of Singapore has led to
the loss of many of these vital habitats. However, mangrove areas have increased due
to the lack of development along the northern coast, coupled with active restoration
efforts.
1.3.1 Mangrove forests
Estimates from the 2002 topographical map show that total mangrove area in
Singapore had increased to 6.26 km2 relative to the 4.87 km2 recorded in 1993 (Hilton
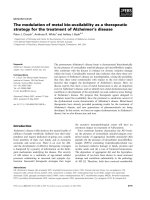
and Manning, 1995). Comparing the distributions of mangroves in Hilton and
Manning’s (1995) 1993 map (Fig.1.3.1), it is clear that the bulk of the increase has
occurred at S. Buloh and P. Ubin. Mangroves in areas that remained undisturbed also
expanded, such as on the military training islands of P. Pawai (0.26 km2 in 1993 to
0.48 km2 in 2002), P. Tekong (0.73 km2 to 1.62 km2) and P. Senang (0.15 km2 to 0.17
km2).
Based on the 2011 map the total area of mangroves increased further, albeit
marginally, to 6.44 km2. However, according to the 2008 Master Plan, more than 33%
of this existing mangrove forest is at risk of being lost. The mangroves in S. Simpang
and S. Khatib Bongsu (0.23 km2), P. Seletar (0.12 km2), P. Tekong (0.76 km2) and S.
Mandai (0.20 km2) are all slated to be reclaimed, while future development on P.
Ubin threatens another 0.82 km2. If these losses are realised, Singapore will only
retain 5.64% (4.23 km2) of its original 75 km2 mangrove area by the end of the 2030.
13
Chapter 1
Fig. 1.3.1: Distribution of mangroves in 2011 (in red, from present study), 1993, 1975 and 1953 (from Hilton and Manning, 1995).
9
Chapter 1
1.3.2 Intertidal reef flats
The period between 1993 and 2002 was marked by several large reclamation
projects, by the end of which the area of intertidal coral reef habitat was just 10.13
km2. The most prominent changes include: 1) the reclamation of the Ayer group of
(ten) islands and their fringing reefs for the petrochemical industry; 2) the merging of
island Buran Darat with Sentosa Island to create land for a marina and exclusive
residences (Ramcharan, 2002); and 3) the construction of the bund around Semakau
landfill (Chou et al., 2004), which covered the fringing reef on P. Sakeng, the eastern
shore of P. Semakau and the patch reefs in between. The remaining reef along the
coast of P. Semakau was protected during the reclamation process (Chou and Tun,
2007) and an extensive 1.23 km2 of reef flat was still present in 2002.
A total of 9.51 km2 of intertidal coral reef was present in 2011 as indicated on
the map (Fig. 2). This decline (much smaller compared to the 1993 to 2002 period)
was due to reclamation works to connect and extend P. Seringat and Lazarus Island,
which resulted in the loss of the fringing reefs and two small patch reefs northwest of
P. Seringat. In addition, the P. Bukom petrochemical complex was expanded to
encompass the islands of P. Bukom Kechil, P. Ular and P. Busing.
Three patch reefs (Terumbu [=Patch reef] Pemalang Besar, T. Pemalang
Kechil and T. Sechirit) currently present in the unused cell of P. Semakau, totalling
0.39 km2, will eventually be covered as the landfill is filled up. Several other reefs are
expected to be lost in the years to come. The small island of P. Tekukor and a patch
reef east of it are slated for reclamation in the 2008 Master Plan. In the 2011 Concept
Plan, two large areas around P. Bukom and P. Semakau (Fig. 1.3.2) are marked out
10
Chapter 1
for ‘possible reclamation’, which could result in the destruction of many of the large
patch reefs such as T. Pempang Tengat (0.31 km2) and T. Pempang Darat (0.28 km2).
11