Blind estimation of FIR channels using spatial separation
Bạn đang xem bản rút gọn của tài liệu. Xem và tải ngay bản đầy đủ của tài liệu tại đây (8.28 MB, 144 trang )
BLIND ESTIMATION OF FIR CHANNELS USING
SPATIAL SEPARATION
Y M SASIRI S YAPA
NATIONAL UNIVERSITY OF SINGAPORE
2004
BLIND ESTIMATION OF FIR CHANNELS USING
SPATIAL SEPARATION
Y M SASIRI S YAPA
(BSc. Eng., University of Moratuwa, Sri Lanka)
A THESIS SUBMITTED
FOR THE DEGREE OF MASTER OF ENGINEERING
DEPARTMENT OF ELECTRICAL AND COMPUTER ENGINEERING
NATIONAL UNIVERSITY OF SINGAPORE
2004
i
Acknowledgement
I would like to take this opportunity to express my warmest thanks to many
who have contributed to the production of this thesis. Without their support,
this thesis could not have been written.
I am deeply indebted to my supervisors Dr. A. Rahim Leyamn and Prof.
Tjhung Tjeng Thiang, whose help, stimulating suggestions, supervision, creative
advice and encouragement helped ignite and refine the ideas that is this thesis.
My appreciation also goes to my parents and family, who were always there
for me, and supported me in all my decisions.
I would also like to thank the Electrical and Computer Engineering Department at NUS and the A STAR Institute for Infocomm Laboratories for giving
me the opportunity, and providing a congenial environment conducive to my
research.
Lastly, but not least I would like to thank all my friends who made my stay
in Singapore enjoyable.
ii
Contents
Acknowledgement
i
Contents
ii
List of Figures
v
List of Tables
vii
Abbreviations
viii
Notations
x
Summary
xi
Chapter 1. Introduction
1.1
1
The mobile media . . . . . . . . . . . . . . . . . . . . . . . . . . .
1
1.1.1
Small scale fading and the multipath model . . . . . . . .
3
1.1.2
Inter Symbol Interference . . . . . . . . . . . . . . . . . .
7
Blind Estimation . . . . . . . . . . . . . . . . . . . . . . . . . . .
13
1.2.1
The blind estimation problem . . . . . . . . . . . . . . . .
15
1.2.2
Statistical and deterministic algorithms . . . . . . . . . . .
17
1.3
Finite alphabet algorithms . . . . . . . . . . . . . . . . . . . . . .
23
1.4
Motivation and Thesis outline . . . . . . . . . . . . . . . . . . . .
27
1.2
Chapter 2. Spatial Structures and Tools
31
2.1
Introduction . . . . . . . . . . . . . . . . . . . . . . . . . . . . . .
31
2.2
The Multiple Output Channel . . . . . . . . . . . . . . . . . . . .
31
Contents
iii
2.3
The spatial structure and clustering . . . . . . . . . . . . . . . . .
35
2.4
The spatial tools and contention clustering . . . . . . . . . . . . .
40
2.4.1
The Primary Clustering algorithm . . . . . . . . . . . . . .
42
2.4.2
Secondary clustering . . . . . . . . . . . . . . . . . . . . .
49
1-D derivatives of the spatial structure . . . . . . . . . . . . . . .
50
2.5.1
The Deterministic Indices . . . . . . . . . . . . . . . . . .
51
Summary . . . . . . . . . . . . . . . . . . . . . . . . . . . . . . .
54
2.5
2.6
Chapter 3. Blind Sequence Detection
55
3.1
Introduction . . . . . . . . . . . . . . . . . . . . . . . . . . . . . .
55
3.2
State Driven Sequence Estimation (SDSE) . . . . . . . . . . . . .
56
3.3
The core SDSE algorithm . . . . . . . . . . . . . . . . . . . . . .
63
3.4
Issues when implementing SDSE . . . . . . . . . . . . . . . . . . .
64
3.4.1
Sign ambiguity . . . . . . . . . . . . . . . . . . . . . . . .
64
3.4.2
Dependency on the channel matrix . . . . . . . . . . . . .
64
3.4.3
Dependency on the TITO structure . . . . . . . . . . . . .
66
3.5
Results and discussion . . . . . . . . . . . . . . . . . . . . . . . .
70
3.6
Summary . . . . . . . . . . . . . . . . . . . . . . . . . . . . . . .
76
Chapter 4. Blind Channel Estimation
78
4.1
Introduction . . . . . . . . . . . . . . . . . . . . . . . . . . . . . .
78
4.2
Channel Estimation by Difference Sets (CEDS) . . . . . . . . . .
79
4.2.1
The CEDS algorithm . . . . . . . . . . . . . . . . . . . . .
82
Channel Estimation by Twin Indexing (CETI) . . . . . . . . . . .
83
4.3.1
The CETI algorithm . . . . . . . . . . . . . . . . . . . . .
89
Improving and correcting CEDS and CETI . . . . . . . . . . . . .
90
4.4.1
Sign and Permutation Correction . . . . . . . . . . . . . .
90
4.4.2
Cost based Heuristic search (CBHS) . . . . . . . . . . . .
94
Results and Discussion . . . . . . . . . . . . . . . . . . . . . . . .
98
4.3
4.4
4.5
Contents
4.6
iv
Summary . . . . . . . . . . . . . . . . . . . . . . . . . . . . . . . 104
Chapter 5. Future work and Conclusion
5.1
106
Extending spatial algorithms . . . . . . . . . . . . . . . . . . . . . 107
5.1.1
T -element Transmitter Constellations . . . . . . . . . . . . 107
5.1.2
Extending spatial algorithms to MIMO channels . . . . . . 111
5.2
Future Work in spatial algorithms
5.3
Conclusion . . . . . . . . . . . . . . . . . . . . . . . . . . . . . . . 119
Bibliography
. . . . . . . . . . . . . . . . . 115
123
v
List of Figures
1.1
Multipath propagation . . . . . . . . . . . . . . . . . . . . . . . .
2
1.2
Multipath propagation . . . . . . . . . . . . . . . . . . . . . . . .
4
1.3
FIR structure of multipath channels . . . . . . . . . . . . . . . . .
7
1.4
Smearing of received signal by ISI . . . . . . . . . . . . . . . . . .
9
1.5
Filter structures and algorithms used for ISI cancelation . . . . .
12
1.6
A linear trasversal adaptive filter structure . . . . . . . . . . . . .
14
1.7
Schematic of the blind estimation problem . . . . . . . . . . . . .
15
1.8
The Single Input Multiple Output channel model . . . . . . . . .
17
1.9
Classification of blind estimation algorithms . . . . . . . . . . . .
22
1.10 The embedding of data used for blind estimation . . . . . . . . .
23
2.1
2D structure of a vector space created by channel of L = 2 . . . .
36
2.2
2D structure corrupted by noise . . . . . . . . . . . . . . . . . . .
37
2.3
Signal and noise hyper-spheres . . . . . . . . . . . . . . . . . . . .
39
2.4
Separation criteria for clustering algorithms . . . . . . . . . . . .
41
2.5
Sub clustering in the two-step primary clustering algorithm
. . .
42
2.6
Cluster extraction . . . . . . . . . . . . . . . . . . . . . . . . . . .
46
2.7
Order estimation using clustering algorithms . . . . . . . . . . . .
48
2.8
Factors affecting order estimation . . . . . . . . . . . . . . . . . .
48
2.9
Linear projections and population distribution in noise . . . . . .
53
3.1
Typical state transition diagram . . . . . . . . . . . . . . . . . . .
58
List of Figures
vi
3.2
Typical state transition diagram . . . . . . . . . . . . . . . . . . .
59
3.3
Visualization of the decoding process . . . . . . . . . . . . . . . .
62
3.4
A Single input single output state . . . . . . . . . . . . . . . . . .
67
3.5
Alternate route search . . . . . . . . . . . . . . . . . . . . . . . .
68
3.6
SDSE algorithm with correction modules . . . . . . . . . . . . . .
69
3.7
Selecting output states with d1 . . . . . . . . . . . . . . . . . . .
71
3.8
The symmetry of the state diagram
. . . . . . . . . . . . . . . .
72
3.9
Performance of the SDSE algorithm . . . . . . . . . . . . . . . . .
74
3.10 The effect of the channel length, L on SDSE . . . . . . . . . . . .
75
3.11 The effect of the data set size, N on SDSE . . . . . . . . . . . . .
76
4.1
Elemental vector structure . . . . . . . . . . . . . . . . . . . . . .
80
4.2
Elemental vector structure . . . . . . . . . . . . . . . . . . . . . .
81
4.3
Elemental vector structure . . . . . . . . . . . . . . . . . . . . . .
85
4.4
Probability of extraction of channel columns . . . . . . . . . . . .
87
4.5
Symbol transition decoding for permutation correction . . . . . .
92
4.6
Performance of the CEDS algorithm
. . . . . . . . . . . . . . . .
95
4.7
The CEDS algorithm as a function of the data set, N . . . . . . .
99
4.8
The CETI algorithm’s reliance on the data set size, N . . . . . . . 101
4.9
The CETI algorithm . . . . . . . . . . . . . . . . . . . . . . . . . 103
4.10 the CBHS module . . . . . . . . . . . . . . . . . . . . . . . . . . . 103
4.11 Difference vector set structure . . . . . . . . . . . . . . . . . . . . 104
5.1
A 16 - element symmetric transmitter constellation, C16
. . . . . 108
5.2
The complex channel . . . . . . . . . . . . . . . . . . . . . . . . . 111
5.3
The Multiple input multiple output channel . . . . . . . . . . . . 112
5.4
Extracting a Two Input Two Output channel using CETI . . . . . 115
5.5
Permutation in extracting MIMO channels . . . . . . . . . . . . . 116
5.6
Derivatives of the spatial structure . . . . . . . . . . . . . . . . . 117
vii
List of Tables
1.1
Distribution density of blind algorithms, categorywise . . . . . . .
28
3.1
Time Indexed state array . . . . . . . . . . . . . . . . . . . . . . .
59
3.2
State Transition Table and symbol extraction . . . . . . . . . . .
62
4.1
Twin indexing through channel coefficients . . . . . . . . . . . . .
88
viii
Abbreviations
VLF:
SHF:
LOS:
T-R:
ISI:
DFE:
TDL:
ZF:
MMSE:
GSM:
HOS:
SOS:
SISO:
HMM:
SIMO:
FA:
BPSK:
QPSK:
QAM:
SNR:
CR:
LSS:
PAM:
DSPK:
ILSP:
VA:
EBSD:
IBSD:
Very Low Frequency
Super High Frequency
Line Of Sight
Transmitter - Receiver separation
Inter Symbol Interference
Decision Feedback Equalizer
Tap Delay Line
Zero Forcing
Minimum Mean Square Error
Global System Mobile
Higher Order Statistics
Second Order Statistics
Single Input Single Output
Hidden Markov Model
Single Input Multiple Output
Finite Alphabet
Binary Phase Shift Keying
Quadrature Phase Shift Keying
Quadrature Amplitude Modulation
Signal to Noise Ratio
Cross Relation method
Least Squares Smoothing
Pulse Amplitude Modulation
Differential Phase Shift Keying
Iterative Least Square with Projection algorithm
Viterbi Algorithm
Explicit Blind Sequence Detection
Implicit Blind Sequence Detection
Abbreviations
ML:
MAP:
VA:
EBSD:
LSE:
CBHS:
CEDS:
CETI:
SDSE:
MIMO:
ix
Maximum Likelihood
Maximum A Posterior
Viterbi Algorithm
Explicit Blind Sequence Detection
Least Significant Elements
Cost Based Heuristic Search
Channel Estimation By Difference Sets
Channel Estimation by Twin Indexing
Sequence Driven Symbol Estimation
Multiple Input Multiple Output
x
Notations
Basic Elements:
M
v
a
S
f unc()
δ()
Γ()
A Matrix
A Vector
A Scalar
A Set
A Function
The Delta Function
The Gamma Function Function
Notations Used
M or v
M†
{a}
∗
abs[]
sgn[]
sum[]
max[]
min[]
Diag[v]
[v]i
[M]ij
|v|
f unce []
Transposition
Inverse or pseudo inverse of a matrix
An element
Convolution operator
Absolute value
Signum function
Summation
Maximum
Minimum
A Matrix with v as diagonal
The ith element of v
The element at the indices (i,j) of the matrix M
Magnitude of the vectorv
Element by element operator of the function f unc[]
xi
Summary
Mobile communication has become one of the fastest growing technologies
of the twenty first century. However, inherent properties of the wireless media
place fundamental limitations on the capacity of such mobile systems. One of the
main problems faced in wireless communication is Inter Symbol Interference (ISI).
Traditionally, ISI has been compensated using adaptive equalizers with training
data. However, recent demand for high bandwidth has made these algorithms
obsolete with more efficient blind algorithms taking their place.
In this thesis, we present a new class of deterministic blind algorithms. Instead of using only the channel structure, algorithms presented in this thesis
utilize data structures that are created by the Finite Alphabet (FA) property as
transmitted data is impinged onto a mobile channel. In this thesis, we examine
both direct sequence estimation and blind channel estimation based on the data
structures created by the FA property. We begin our thesis by first introducing
and examining the structure of the data that is created. This, we label as spatial
data in our thesis. Then, we proceed to outline two spatial tools, the Primary
and Secondary clustering algorithms that are used for processing the spatial data
described above.
We first present the State Driven Sequence Estimation (SDSE) algorithm,
Summary
xii
which we have implemented for blind sequence detection. This algorithm uses the
spatial structure to derive a state transition table, which when complemented by
actual time data can be used to extract transmitted symbols within a sign ambiguity. Later, we present two channel estimation algorithms. Both, the Channel
Estimation by Difference Sets (CEDS) and Channel Estimation by Twin Indices
(CETI) utilize vectors that are generated from the spatial structure. However,
the manner they utilize these vectors differ, resulting in different behaviors in the
two algorithms.
Lastly we conclude our thesis, extending our work with subtle modifications
thereby enabling it to include complex transmitter constellations and Multiple
Input Multiple Output systems into its repertoire.
1
Chapter 1
Introduction
1.1
The mobile media
Wireless communication has become one of the fastest growing technologies
of the twenty first century. Starting from the late 19th century, when Marconi
began experimenting with the transmission and reception of “Hertzian Waves”,
wireless systems have evolved to become a technology capable of providing instantaneous high bandwidth links to mobile users. The current research thrust on
wireless systems is concentrated on the last two aspects mentioned above: To provide a higher bandwidth to a more mobile user. The mobile media is an important
consideration in designing wireless systems. Inherent properties of the wireless
media place fundamental limitations on the capacity of mobile systems. The characteristics of the mobile channel are affected by the environment it encompasses.
The environment results in creating a multitude of propagation modes. These
modes vary from direct line of sight (LOS) to a mixture of scattered, reflected
1.1 The mobile media
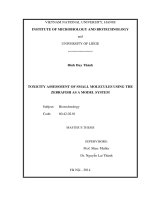
2
Figure 1.1: Multipath propagation
and diffracted modes depending on the clutter present within the channel. This
lends to the random nature of the mobile channel, and consequently its difficulty
in being modeled. Characterization of the wireless channel has been traditionally
separated into two categories [1]. They are, Large scale fading that predicts the
average signal strength for an arbitrary transmitter receiver (T-R) separation,
and small scale fading that characterizes the rapid random fluctuations of signal strength over distances comparable to its wavelength. This is illustrated in
Fig 1.1 where the T-R separation is denoted by d. Large scale fading is due to
the nature of radio waves, and their modes of propagation with respect to the
environment. The main components that factor into Large scale fading are,
1.1 The mobile media
3
• Free space path loss given by
P L(dB) = −10 log10
Gt Gr λ2
(4πd)2
(1.1)
Gt and Gr are transmitter and receiver gains respectively, while λ is the the
carrier wavelength.
• Ground reflections
• Diffraction due to edges such as buildings and mountains
• Scattering due to objects within the media.
In the real world, these four components interact to produce complex fading
characteristics. However, with the advent of radio, television and microwave
links, modeling of large scale fading became a necessity. This pushed open the
door for empirical modeling, and the models proposed by Okumura [2], Hata [3]
and Walfisch & Bertoni [4] provides the means to predict average signal strength
across many terrains with reasonable accuracy.
1.1.1
Small scale fading and the multipath model
Small scale fading is due to the rapid, random, fluctuations of the amplitude,
phase, and frequency, of a received radio signal over a time period, or distance
comparable to its wavelength. It is primarily due to objects like cars, buildings
and trees that clutter the mobile media. These objects cause transmitted rays
with slightly different angles of departure to undergo different perturbations on
1.1 The mobile media
4
Figure 1.2: Multipath propagation
each surface they reflect, scatter, or diffract on. This results in the signals being
almost completely uncorrelated by the time they incident on the receiver antenna.
Furthermore, the change of the environment; swaying of trees, rain, humidity, etc,
creates additional complexities by inducing temporal variations in the signals.
Both effects, temporal and spatial randomness, limit the capacity of wireless
systems.
Consider the multipath channel shown in Fig. 1.2. It consists of P paths,
where each path p ∈ {1, ..., P }, is defined by its respective path length {γp }, and
its attenuation coefficient {ap }. Let s(t) be the transmitted signal at time index t.
Then, for a narrow band transmission, the superposition of the multipath signals
1.1 The mobile media
5
can be written using the real operator
,
P
y˜(t, γ¯ ) =
ap s(t − γp /c)exp (j2π[fc t − γp /λc ])
(1.2)
p=1
where λc and fc are the wavelength and frequency of the carrier respectively. In
the equation, the speed of light is denoted by c and the time index by t. The
mean path length traversed γ¯ , is defined by
1
γ¯ =
P
P
γp
(1.3)
p=1
Defining τp = γp /c, Eqn. (1.2) reduces to the more familiar form:
P
ap s(t − τp )exp(−j2πfc τp ) exp(j2πfc t)
y˜(t) =
(1.4)
p=1
Then, under the assumptions of both a time invariant channel, and the existence
of a large number of multipaths, the received baseband signal can be modeled by
the integral,
+∞
y(t) =
h(τ )s(t − τ )dτ
(1.5)
−∞
where h(τ ) = a(τ )exp(−j2πfc τ ). Here, a(τ ) is the continuous-time form of ap .
Eqn. (1.5) reveals that the channel under these assumptions operate in a similar
manner to a linear filter with an impulse response of h(τ ). For a discrete system
1.1 The mobile media
6
this integral further simplifies to,
L
y(nT ) =
h(lT )s(nT − lT )
(1.6)
l=0
when the output r(t) is sampled every T s and given that the channel has a finite
impulse response of L + 1 symbols. This, with a slight abuse of notation can be
written in the simpler form,
N
y(n) =
hl sn−l
(1.7)
l=0
where hl
h(lT ) and sn
s(nT ) for the nth transmitted symbol.
The underlying assumption of time invariance holds in high speed communication systems. This is because there, the data packets are relatively shorter
in duration with respect to the coherence time of the channel. The coherence
time of a channel is the time which the impulse response of the media is highly
correlated. The assumption of a finite channel length has also been verified by
practical measurements. These experiments show that the bulk of the energy of
a received symbol is concentrated in a finite time frame from the reception of the
first ray.
Eqn. (1.5) suggests that the mobile channel can be mathematically modeled
as a linear filter under the above two assumptions. However, modern wireless
communication systems are primarily based on digital transmissions. Thus, Eqn.
(1.6) provides a more accurate portrayal of the mobile media. This mathematical
1.1 The mobile media
7
Figure 1.3: FIR structure of multipath channels
structure represents a Finite Impulse Response (FIR) transversal filter, and this
is illustrated in Fig 1.3.
1.1.2
Inter Symbol Interference
The FIR structure evident in Fig 1.3 indicates that mobile channels create
delayed and attenuated replicas for each symbol that is transmitted through the
media. Thus, what incidents on the receiver is not only the transmitted symbol,
but a superimposition of all the delayed signals that the media creates. This
has the effect of smearing the symbol in time as shown in the first graph of Fig
1.4. Time-dispersion of the channel causes received symbols to trail for more
than its allocated time period. Thus, components of one symbol begin to affect
the received signal of adjacent symbols. This effect is known as Inter Symbol
Interference (ISI). It corrupts the received signal, thereby preventing accurate
reconstruction of the transmitted symbols. Fig 1.4 illustrates how time dispersion
ultimately results in a received signal that has little or no resemblance to the
1.1 The mobile media
8
transmitted symbols. In such cases, accurate reconstruction of the transmitted
symbol sequence is almost impossible without additional processing.
Time-dispersion in mobile channels is quantified using the rms delay spread
parameter, στ . This parameter is empirically derived using the power delay profile
of a given channel. For channels that are Wide Sense Stationary with Uncorrelated Scattering (WSSUS) the power delay profile, p(t) can be derived from the
channel parameters [1] as,
p(t) = 0.5|h(t)|2
(1.8)
The rms delay spread is the square root of the second central moment of the
power delay profile and it is defined as
στ
τ¯2 − τ¯2
(1.9)
where
τ¯ =
τ¯2 =
p(τk )τk
k p(τk )
2
k p(τk )τk
k p(τk )
k
(1.10)
(1.11)
and k ∈ {0, ..., ∞}. Viewing from the frequency domain, the rms delay spread
transforms into a coherence bandwidth. The physical interpretation of the coherence bandwidth, Bc is framed by a high correlation between of the two channels
seen from two frequencies separated by less than Bc .
Although as mentioned previously, the channel distorts the received signal
1.1 The mobile media
Figure 1.4: Smearing of received signal by ISI
9
1.1 The mobile media
10
to almost beyond recognition, there are tools available in communications to
overcome and undo such distortions inserted by the media. They are,
Diversity
Diversity is a tool that is used to compensate for fading where the signal
level drops to below the threshold of receptability in a receiver. It hinges on
the premise that if more than one replica of a signal is received on uncorrelated
channels, then the probability that all signals will fade simultaneously decreases
rapidly with the number of received signals.
A number of methods exist to provide identical signals that arrive through
uncorrelated channels.
• Spatial diversity - Here, the receiver antennae must be separated physically
by more than half a wavelength to minimize channel correlation.
• Time diversity - For time diversity, the transmissions must be separated by
more than the coherence time of the channel.
• Frequency diversity - In this case, transmission frequencies should differ by
more than the coherence bandwidth.
• Polarization diversity - This form of diversity depends on the fact that the
properties of mobile channels are dependant on the plane of polarization of
the transmitted carrier.
These schemes provide the means to enhance the received signal so that the depth
and duration of fades is appreciably reduced.
1.1 The mobile media
11
Channel Coding
Channel coding adds redundant data bits onto the transmitted symbol sequence so that even if a few bits are lost during fading, they can still be estimated or detected using the additional bits embedded onto the transmission.
However, coupling additional bits onto the transmitted sequence reduces the raw
data transmission rate.
Channel decoding generally takes place after detection . Thus, it is essentially
a post detection scheme. Within channel coding, there are three main techniques
that is widely used in mobile communications. Application of the type of coding
depends on the requirements of the communication link. These factors include the
bi-directionality of the link, the nature of the communication system: whether it
is broadcast, multicast or unicast, and the bandwidth reduction that is tolerable.
The three families of channel coding available are,
• Block codes
• Convolution codes and
• Turbo codes
Channel coding is generally independent of modulation schemes. However, with
the advent of Orthogonal Frequency Division Multiplexing (OFDM), new spacetime coding techniques that combines antenna or space diversity, coding and
modulation have been proposed. These schemes offer high coding gains without
any bandwidth expansion.