Enhanced broadband absorption is silicon micro structures by laser processing for solar cells
Bạn đang xem bản rút gọn của tài liệu. Xem và tải ngay bản đầy đủ của tài liệu tại đây (4.94 MB, 132 trang )
ENHANCED BROADBAND ANTI-REFLECTION IN
LASER PROCESSED SILICON NANO-STRUCTURE
ARRAYS FOR SOLAR CELLS
FU XIAOTIAN
(B. Eng. (2nd Upper.) NUS)
A THESIS SUBMITTED
FOR THE DEGREE OF MASTER OF ENGINEERING
DEPARTMENT OF ELECTRICAL AND COMPUTER
ENGINEERING
NATIONAL UNIVERSITY OF SINGAPORE
2014
DECLARATION
I hereby declare that the thesis is my original work and it has been written by me
in its entirety.
I have duly acknowledged all the sources of information which have been used in
this thesis.
This thesis has also not been submitted for any degree in any university
previously.
Name: FU XIAOTIAN
Signature: _________________
Date: _________________
Acknowledgements
ACKNOWLEDGEMENTS
I would like to express my heartfelt appreciation and gratitude to my supervisors,
Prof. Hong Minghui, Dr. Bram Hoex and Dr. Ian Marius Peter for their invaluable
guidance and great support throughout my Master project. Without their valuable
advice and encouragements, the progress of this project will not be as smooth as it
is. I am deeply grateful to Prof. Hong Minghui for the high standard he held on
me. Without his dedicate care, my research work would be slow down. His acute
sense and strict attitude in research field inspire and give me great help.
It is my pleasure to recognize all the members in Laser Microprocessing Lab for
sharing their experience in research and giving me kind help and useful discussion.
Special thanks would be expressed to Dr. Luo Fangfang, Dr. Du Zheren, Mr.
Yang Jing and Mr. Wang Dacheng for your help in both my study and life, and I
deeply appreciate the time shared with you. I wish you best luck in your career.
I am grateful to all the members from Monocrystalline Silicon Wafer Group and
Simulation Group in Solar Energy Research Institute of Singapore (SERIS) for
giving me their kind advice and experience in research. The scholarship provided
by SERIS for my Master degree is gratefully acknowledged.
Last but the most importantly, I would like to give my great thanks to my parents
for their great encouragement and constant support during my years of pursuing
degree in National University of Singapore.
i
Table of contents
TABLE OF CONTENTS
ACKNOWLEDGEMENTS ..................................................................................... i
TABLE OF CONTENTS ........................................................................................ ii
SUMMARY .......................................................................................................... vii
LIST OF FIGURES ............................................................................................... ix
LIST OF SYMBOLS ........................................................................................... xiii
CHAPTER 1 INTRODUCTION ............................................................................ 1
1.1
Background .................................................................................................. 1
1.2
Motivation .................................................................................................... 2
1.3
Research objectives...................................................................................... 4
1.4
Organization of thesis .................................................................................. 5
CHAPTER 2 BACKGROUND AND LITERATURE REVIEW .......................... 7
2.1
Silicon solar cells ......................................................................................... 7
2.1.1
Introduction .......................................................................................... 7
2.1.2
Optical properties of silicon ................................................................. 8
2.1.3
Optical loss ......................................................................................... 11
ii
Table of contents
2.1.4
Surface texturing................................................................................. 13
2.1.5
Light trapping ..................................................................................... 15
2.2
Light scattering by nanoparticles (NPs) ..................................................... 18
2.2.1
Properties of surface plasmons ........................................................... 19
2.2.2
Surface plasmon excitation................................................................. 21
2.3
Numerical simulation ................................................................................. 23
CHAPTER 3 EXPERIMENTAL SETUP AND FABRICATION DETAILS ..... 27
3.1
Introduction ................................................................................................ 27
3.1.1
Laser micro-lens array (MLA) lithography ........................................ 27
3.1.2
Laser interference lithography (LIL) .................................................. 29
3.1.2.1 Principle of LIL............................................................................... 30
3.1.2.2 Lloyd’s mirror setup........................................................................ 31
3.1.3
3.2
Top-down fabrication of silicon nanowires ........................................ 33
Fabrication details ...................................................................................... 36
3.2.1
Substrate selection and wafer cleaning............................................... 36
3.2.1.1 RCA I cleaning................................................................................ 36
3.2.1.2 RCA II cleaning .............................................................................. 37
3.2.1.3 5% Hydrofluoric Acid Dip.............................................................. 37
3.2.2
Photoresist coating.............................................................................. 38
iii
Table of contents
3.2.3
Exposure and develop......................................................................... 40
3.2.3.1 Concentric rings nano-structure arrays ........................................... 40
3.2.3.2 Silicon nanowire arrays................................................................... 40
3.2.4
Metallic thin film deposition .............................................................. 41
3.2.5
Lift-off ................................................................................................ 43
3.2.6
Chemical etching and 3D nano-structures fabrication ....................... 46
CHAPTER 4 HYBRID 3D SILICON SURFACE NANO-STRUCTURE
ARRAYS FOR SOLAR CELLS BY LASER MICRO/NANO-PROCESSING.. 49
4.1
Introduction ................................................................................................ 49
4.2
Characterization methods........................................................................... 50
4.2.1
Optical microscope (OM) imaging ..................................................... 50
4.2.2
Scanning electron microscope (SEM) imaging .................................. 51
4.2.2.1 Silicon concentric nano-rings array ................................................ 51
4.2.2.2 Silicon nanowires array................................................................... 53
4.2.3
UV-Vis spectroscopy.......................................................................... 56
4.2.3.1 Silicon concentric nano-rings array ................................................ 57
4.2.3.2 Silicon nanowires array with different pillar heights ...................... 59
4.2.3.3 Silicon nanowires array with different pillar diameters .................. 62
4.3
“Mushroom”-shape silicon nanowires array.............................................. 64
iv
Table of contents
4.3.1
Scanning electron microscope (SEM) image ..................................... 66
4.3.2
UV-Vis spectroscopy.......................................................................... 67
4.4
Theoretical analyses of enhanced light trapping in hybrid 3D silicon nano-
structures array ...................................................................................................... 69
4.4.1
Optical performance ........................................................................... 69
4.4.1.1 Reflectance of silicon nano-structures array ................................... 69
4.4.1.2 Absorption of silicon nano-structures array.................................... 71
4.4.2
4.5
E-field distribution in single standing nano-structure ........................ 72
Summary .................................................................................................... 76
CHAPTER 5 BROADBAND ENHANCEMENT OF ANTI-REFLECTION IN
SILICON MICRO/NANO-STRUCTURES ......................................................... 78
5.1
Introduction ................................................................................................ 78
5.2
Experimental details................................................................................... 79
5.2.1
Metallic nanoparticles deposition ....................................................... 79
5.2.2
Pyramid micro-structures ................................................................... 79
5.2.3
Laser surface texturing ....................................................................... 81
5.2.4
Thermal annealing of metallic nanoparticles...................................... 82
5.3
Characterization ......................................................................................... 84
5.3.1
Scanning electron microscope imaging .............................................. 84
v
Table of contents
5.3.1.1 Flat silicon with metallic nanoparticles deposition ......................... 84
5.3.1.2 Pyramid micro-structure with metallic nanoparticles deposition ... 85
5.3.1.3 Laser surface texturing with metallic nanoparticles’ deposition .... 86
5.3.2
UV-Vis spectroscopy.......................................................................... 89
5.3.2.1 Silicon micro/nano-structures with metallic nanoparticles’
deposition....................................................................................................... 89
5.3.2.2 Silicon back surface texturing ......................................................... 97
5.4
Summary .................................................................................................... 99
CHAPTER 6 CONCLUSIONS AND FUTURE WORK ................................... 101
6.1
Research achievements ............................................................................ 101
6.2
Suggestion for the future work................................................................. 103
References: .......................................................................................................... 105
vi
Summary
SUMMARY
Light collection efficiency act as a key factor affecting the performance of many
optical and optical-electronic devices. For silicon wafer solar cells, the high
reflection at the front surface, due to its high refractive index, is a hindrance to the
devices’ light collection efficiency. To minimize unwanted reflection and increase
light trapping, anti-reflection surfaces by micro/nano-texturing are one of the
most promising candidates, which is featuring an improved anti-reflection as well
as enabling the probability of manufacturing high-efficiency solar cells on a large
scale. This thesis focuses on broadband enhancement of light absorption for solar
cells by silicon surface texturing using laser micro/nano-processing.
Laser technology has become one of the commonly applied techniques for highefficiency silicon wafer solar cell fabrication. In this thesis, laser interference
lithography (LIL) and micro-lens array (MLA) lithography are adopted as maskfree and efficient techniques, associated with metal catalyst assisted chemical
etching, to fabricate silicon nano-structures arrays. The surface anti-reflection
performance and light trapping are significantly improved by sub-wavelength
structures at ultra-high aspect ratios, which create gradient refractive index from
air ambient to wafer substrate. Furthermore by varying the surface geometry and
feature design of the nano-structures arrays, the light absorption in the nanostructures are boosted by extending the light travelling path and changing the
silicon volume ratio at the nano-structures layers. Meanwhile, with the decoration
vii
Summary
of metallic nanoparticles on silicon nano-structures, the surface plasmon
resonance can be excited to further enhance broadband anti-reflection, achieving
an ultra-low reflection across the broad spectrum from 300 to 1200 nm.
viii
List of figures
LIST OF FIGURES
Chapter Two
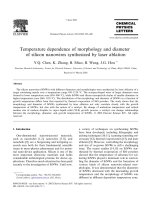
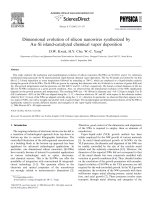
Figure 2.1 Evolution of silicon solar cell efficiency [36] ....................................... 7
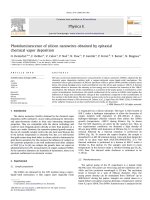
Figure 2.2 In the wavelength regime 300 nm < λ < 1200 nm, which is relevant to
silicon solar cell operation, the absorption coefficient 𝛼0 and correspondingly the
absorption length 𝐿𝛼 of c-Si strongly depend on wavelength. [39]...................... 10
Figure 2.3 Schematic illustration of optical loss processes in a solar cell [43]. ... 12
Figure 2.4 Comparison of light travelling path on flat and textured silicon surfaces.
............................................................................................................................... 14
Figure 2.5 Silicon surface structures fabricated by (a) KOH etching, (b) catalystassisted chemical etching, (c) plasma etching and (d) femtosecond laser induced
texturing [25] [48]. ................................................................................................ 15
Figure 2.6 Schematic diagram illustrating reflection and transmission of light for a
pyramidal textured silicon solar cell [43]. ............................................................ 17
Figure 2.7 Schematic illustration of plasmon collective oscillation of a spherical
gold colloid, showing the displacement of the conduction electron charge cloud
relative to the nuclei [54]. ..................................................................................... 20
Figure 2.8 SPP excitation configurations: (a) Otto geometry (b) Kretschmann
geometry, (c) diffraction on a grating, and (d) diffraction on surface features [60].
............................................................................................................................... 21
Figure 2.9 Rayleigh expansion for the diffracted fields [70]. .............................. 25
Chapter Three
Figure 3.1 Schematic of the experimental setup used for laser micro-lens array
lithography. ........................................................................................................... 28
ix
List of figures
Figure 3.2 Schematic illlustration of a standing wave generated by the
interference of two coherent laser beams.............................................................. 31
Figure 3.3 Schematic illlustration of a Lloyd's mirror setup for laser interference
lithography of periodic structures on photoresist.................................................. 32
Figure 3.4 Scanning electron micrographs showing (a) the arrays of silicon
nanowires prepared by using inductively coupled plasma etching [81]; and (b) the
arrays of silicon nanopillars fabricated by optical lithography and reactive ion
etching [82]. .......................................................................................................... 33
Figure 3.5 Scanning electron micrographs of Ag–Si after treatment in an aqueous
solution containing (a) 5.3 M HF and 0.18 M H2O2 for 1 min; (b) 5.3M HF and
1.8M H2O2 for 1 min. Inset shows an enlarged image at the top surface region
[89]. ....................................................................................................................... 35
Figure 3.6 Measurement of the film thickness using a step profiler. .................... 39
Figure 3.7 Schematic drawing of an electron beam evaporator. ........................... 42
Figure 3.8 Process flow for the single-layer lift-off process................................. 45
Figure 3.9 Schematic illustration of catalyst assisted wet etching process........... 47
Figure 3.10 Schematic diagram depicting the experimental setup for catalyst
assisted wet etching............................................................................................... 48
Chapter Four
Figure 4.1 Optical microscope top view images of fabricated (a) silicon concentric
nano-rings array and (b) silicon nanowires array.................................................. 51
Figure 4.2 SEM micrographs of silicon concentric nano-rings arrays fabricated at
heights of (a) 750 nm, (b) 3 µm and (c) 12µm. .................................................... 53
Figure 4.3 SEM micrographs of silicon nanowires array fabricated with (a) 300
nm diameter and pillars’ height of (b) 300 nm, (c) 1 µm, (d) 6 µm, (e) 12 µm and
(f) 40 µm. .............................................................................................................. 54
Figure 4.4 SEM image of silicon nanowires array fabricated with (a) less than
half period, (b) half period and (c) larger than half period diameters of the pillars
at the same height.................................................................................................. 56
x
List of figures
Figure 4.5 Reflectance spectra of silicon concentric nano-rings arrays with (a)
750 nm, (b) 3 µm and (c) 12 µm ring heights. ...................................................... 58
Figure 4.6 Measured reflectance spectra of silicon nanowires arrays with (a) 1
µm, (b) 6 µm, (c) 12 µm and (d) 40 µm pillar heights. ........................................ 61
Figure 4.7 Measured reflectance spectra of silicon nanowires array with pillar
diameters of (a) less than, (b) equal to and (c) larger than half period. ................ 63
Figure 4.8 Schematically cross section view of LIL-based lift -up process. ........ 64
Figure 4.9 Schematic process flow for the fabrication of 3D silicon nanostructures array fabrication without using a lift off process.................................. 65
Figure 4.10 SEM micrograph of a "mushroom"-shape silicon nanowires array. . 67
Figure 4.11 Measured reflection spectra of silicon nanowires array with and
without the "mushroom"-shape crowns. ............................................................... 68
Figure 4.12 Measured spectrally resolved reflectance of planar silicon, normal
and “mushroom”-shape silicon nanowires. ......................................................... 70
Figure 4.13 Measured spectrally resolved absorption spectra of planar, normal
and “mushroom”-shape silicon nanowires. ......................................................... 72
Figure 4.14 Plot of the simulated absolute value of square of electric field in ydirection (abs(Ey)2) for (a) planar and (b) “mushroom”-shape nanowires structures
at wavelengths of 300 nm and (c) 1000 nm. ......................................................... 75
Chapter Five
Figure 5.1 (a) Top view and (b) cross section SEM images of the KOH etched
silicon surface. ...................................................................................................... 80
Figure 5.2 (a) Schematic diagram of the laser ablation for silicon surface texturing
and (b) a SEM image of the resulting c-Si surface. .............................................. 82
Figure 5.3 Schematic of silicon nanowires array with metallic nanoparticles'
decoration. ............................................................................................................. 83
Figure 5.4 SEM images of (a) Ag, (b) Au, (c)Ag/Au and (d) Cu/Ag/Au metallic
nanoparticles' decoration of flat silicon surfaces. ................................................. 84
xi
List of figures
Figure 5.5 SEM images of metallic nanoparticles' decoration of the KOH etched
silicon surface. ...................................................................................................... 85
Figure 5.6 SEM images of the laser-textured silicon surfaces being decorated with
(a) Ag/Au, and (b) Cu/Ag/Au alloy nanoparticles ................................................ 86
Figure 5.7 SEM images of metallic nanoparticles' decoration of the silicon
nanowires array at heights of (a) 500 nm, (b) 3 µm, (c) 12 µm and (d) 40 µm. ... 88
Figure 5.8 Measured reflection spectra of flat silicon surfaces with and without
the metallic nanoparticles' decoration. .................................................................. 89
Figure 5.9 Measured reflection spectra of the KOH etched silicon surface with
and without metallic nanoparticles' decoration. .................................................... 92
Figure 5.10 Measured reflection spectra of laser textured silicon surfaces with and
without metallic nanoparticles' decoration............................................................ 93
Figure 5.11 (a) SEM image and (b) Measured reflection spectra of silicon
nanowires arrays with and without metallic nanoparticles' decoration................. 95
Figure 5.12 Measured reflection spectra of 320 µm-thick laser-textured Si front
surfaces without and with the backside surface texturing. .................................... 98
Figure 5.13 Measured reflection spectra of 320, 530, 890 µm-thick front side
laser-textured Si sample with the backside surface texturing. .............................. 99
xii
List of symbols
LIST OF SYMBOLS
c-Si
Crystalline silicon
PV
Photovoltaic
ARC
Anti-reflection Coating
RI
Refractive Index
NPs
Nanoparticles
EM
Electromagnetic
FCA
Free Carrier Absorption
SPR
Surface Plasmon Resonance
SPPs
Surface Plasmon polaritons
TIR
Total Internal Reflection
UV
Ultraviolet
IR
Infrared
NIR
Near Infrared
°C
Degree Celcius
VLS
Vapor-Liquid-Solid
CE
Catalytic Etching
xiii
List of symbols
MLA
Micro-lens Array
ROC
Radius of Curvature
LIL
Laser Interference Lithography
D
Grating dimension
P
Periodicity
NA
Avogadro’s constant
n
Refractive index
λ
Wavelength
k
Boltzmann constant
θ
Two light waves intersect angle
h
Arrays thickness
OM
Optical Microscopy
SEM
Scanning Electron Microscopy
RCWA
Rigorous coupled-wave analysis
xiv
Chapter 1 Introduction
CHAPTER 1
INTRODUCTION
1.1
Background
Silicon surfaces covered by a layer of micro- or nano-structures, which effectively
suppresses reflection, while simultaneously enhance the scattering and absorption
of light, have attracted great interest for their fundamental properties and
potentially practical applications [1-4]. Ever-increasing demand for high
efficiency of various optical and opto-electronic devices has driven the design and
fabrication to achieve excellent anti-reflection performance [1-4]. Among the
various opto-electronic devices, solar cell has attracted much attention. Solar
electricity, as a source of clean and renewable energy free from contaminations
and carbon emissions, is regarded as one of the best solutions to replace fossil based electricity for future electricity supply [5, 6]. The direct conversion from
solar energy to electricity can be realized by solar cells based on the photovoltaic
(PV) effect [7]. When light, intrinsically electromagnetic (EM) wave, impinges on
a different media, it is partially reflected due to the refractive index (RI)
mismatching. In this case, high reflection at the interfaces affects the performance
of the devices [8-11]. Therefore, the surface anti-reflection becomes an important
factor to enhance its cell efficiency [12-14]. In order to minimize unwanted
reflection and improve the light absorption efficiency, different types of anti1
Chapter 1 Introduction
reflection surfaces have been widely studied for solar cells, like anti-reflection
thin film deposition and surface texturing. Among all of these, nano-structures
have received steadily growing research interest due to their unique optical
properties and potential applications superior to their bulk counterparts [15-17].
Recent advances in surface micro/nano-fabrication and thin film deposition
technologies provide versatile approaches to decorate silicon surfaces with
engineered structures to reduce optical reflection, especially for silicon solar cells
with an absorber layer of a few micrometers.
Following Feynman’s challenge that “there is plenty of room at the bottom” [18],
the capability in sculpting silicon with extraordinary precision and efficiency is
very much needed for the development of nanotechnology. Extensive effort has
been devoted by various research groups in the quest for greater structural control
at the nanometer level [19] to precisely generate such miniscule structures. The
resulting nano-structures show complex and interesting optical properties, which
lead to a large number of opportunities, including but not limited to the potential
applications in the areas of optical and opto-electrical devices.
1.2
Motivation
For monocrystalline silicon solar cells, the most commonly adopted light trapping
structures are pyramidal textures [20, 21], which have feature sizes of a few
micrometers (2~10 µm). However, with reducing the thickness of silicon solar
cells to no thicker than a few micrometers, they are no longer favored as absorber
2
Chapter 1 Introduction
layers. Meanwhile, the crystalline silicon (c-Si) solar cells exhibit a comparably
weaker absorption at near-bandgap spectrum due to the indirect bandgap of
silicon, which results in a narrow absorption spectrum. To bypass these
limitations, nano-scale textured silicon surface provides the better solution for
omnidirectional and broadband anti-reflection [2, 22-28]. As photon management
schemes for c-Si solar cells with thin absorber layers, such silicon nano-structures
usually possess unique photon management properties to compensate for light
absorption loss when arranged into random or regular arrays.
With the fabrication of surface nano-structure arrays on silicon substrates, high
optical absorption is indicated because of the strong light trapping by multiple
scattering of the incident light among silicon nano-structures and the optical
antenna effect [29-32]. Therefore, the surface anti-reflection properties can be
further improved by the effective graded refractive index (RI) from subwavelength structures. The effective RI depends on the volume fraction of silicon
and air to compensate the RI mismatching at the interface [33, 34]. This causes
low reflectance and eliminates antireflective coating step required in the
manufacturing process. With further adopting the metallic nanoparticles together
with the nano-structures, a broadband reflection spectrum can be promised. Hence,
the fabrication of c-Si solar cells decorated with three-dimensional (3D) nanostructures, which vary in features, has attracted a great deal of interest among
researchers as it renders the design of high-efficiency solar cells with possibly
reduced material cost.
3
Chapter 1 Introduction
1.3
Research objectives
The aim of this study was to explore the techniques for the fabrication of precisely
located and well-arranged 3D nano-structures arrays on silicon using micro-lens
array (MLA) and laser interference lithography (LIL). To further improve the
antireflection performance and light trapping efficiency of silicon based solar
cells.
The focus of this research can be divided into several parts. Firstly, this study
focuses on the large-area synthesis of silicon nanowire arrays with tunable size,
length and period. This approach makes use of interference lithography,
anisotropic etching of silicon, electron-beam (E-beam) evaporation of Ag and Au
layer, lift-off, and catalyst assisted etching.
Secondly, a study is carried out to investigate the optical performance of the
silicon nano-structured surfaces when various surface geometries were applied.
The methods of MLA, LIL and multiple etching are adopted to fabricate the
nanorings array and “mushroom”-shape silicon nanowires with varying feature
sizes and periods.
Finally, in order to reduce the reflection in a broadband region, metallic
nanoparticles are deposited to the aforementioned nano-structures. The tunability
in the size and distribution of the synthesized metallic nanoparticles are examined
by varying the deposited film thickness and annealing temperature. Meanwhile, a
back surface texturing is applied to further enhance the reflection reduction at a
broadband range.
4
Chapter 1 Introduction
1.4
Organization of thesis
This thesis is divided into six chapters and their contents are listed as follows:
Chapter One gives an introduction on the anti-reflection performance of optical
and opto-electrical devices, especially solar cells. An introduction of the c-Si
surface micro/nano-structures fabrication is indicated. The motivation, objective
and contribution of this study are also addressed.
Chapter Two describes the fundamental physics of antireflection for silicon based
solar cell. The optical properties of silicon solar cell are introduced. The current
antireflection and light trapping techniques are discussed with their advantages
and limitations. A theoretical introduction of light scattering and absorption
affected by metallic nanoparticles deposited on the substrate are also included.
Chapter Three describes the methods and techniques of the fabrication process. A
detailed procedure of the fabrication of silicon micro/nano-structures arrays by
laser processing is presented.
Chapter Four investigated the fabricated silicon surface structures for their antireflection performance. The reflection in the silicon surface nano-structures arrays
are shown according to different designs of their features in both experimental
measurement and numerical simulation.
Chapter Five investigates the anti-reflection enhancement of the silicon
micro/nano-structures by two means, which are metallic nanoparticles deposition
and back surface texturing. Their anti-reflection performance is discussed.
5
Chapter 1 Introduction
Chapter Six provides the conclusions of this study as well as recommendation for
future work.
6
Chapter 2 Background and literature review
CHAPTER 2
BACKGROUND AND LITERATURE REVIEW
2.1
Silicon solar cells
2.1.1
Introduction
Silicon wafer solar cells currently dominate the photovoltaic market with a market
share of ~ 90%. The first silicon wafer solar cell with a pn junction was fabricated
in the 1950s at Bell Labs by Chapin et al [35]. This solar cell only had an energy
conversion efficiency of 6% but as can be seen in Figure 2.1 the efficiency of the
c-Si wafer solar cell has been improved significantly in recent years up to 25.6%
[36].
Figure 2.1 Evolution of silicon solar cell efficiency [36]
7
Chapter 2 Background and literature review
Optimizing the solar cell efficiency is all about minimization of losses. Therefore,
the boost of silicon solar cells efficiency comes with its priority in our study. The
dominant losses of a silicon wafer solar cell are optical, resistive, and
recombination losses. In this thesis we will only focus on a reduction of optical
losses particularly for ultrathin c-Si solar cells.
2.1.2
Optical properties of silicon
When light impinges on the silicon surface, it is partially reflected due to the
optical contrast between c-Si and air. The reflection coefficient 𝑅𝑆𝑖 can be
calculated by the well know Fresnel equations. The transmitted light penetrates
into the material, where it is attenuated due to absorption. The rate of absorption
is determined by the law of Lambert-Beer,
𝐼(𝑥 ) = (1 − 𝑅𝑆𝑖 )𝑒 (−𝛼𝑒𝑓𝑓 𝑥) 𝐼0
(2.1)
which characterizes the intensity of a light beam that has traveled a distance 𝑥
inside a material with effective absorption coefficient 𝛼𝑒𝑓𝑓 , relative to an incident
intensity 𝐼0 . The absorbed photons either lose their energy by generating
electron/hole pairs at a rate 𝐺 = 1⁄𝑡 (optical generation), where 𝑡𝑒 is the
𝑒
excitation time constant, or by exciting free carriers (free carrier absorption, FCA).
The excited carriers eventually thermalize and transfer their energy as heat in the
lattice by carrier/lattice collisions. The optically generated electron/hole pairs
eventually recombine radiatively, or likewise produce heat by non-radiative
8
Chapter 2 Background and literature review
recombination, unless they are extracted out of the material as e.g. happens in a
solar cell. The time constant for recombination is denoted by the carrier lifetime 𝜏.
The most important quantities and dependencies of the energy transfer of light to
silicon will be described as following.
Absorption by optical generation of charge carriers
In opto-electric semiconductors, the generation of electron/hole pairs occurs for
incident photons with energies ℎ𝜈 > 𝐸𝑔 . The generation rate is 𝐺 =
𝐼𝜎𝑜𝑝𝑡
⁄ ,
ℎ𝜈
with 𝐼 being the absorbed intensity, 𝜎𝑜𝑝𝑡 the optical absorption cross section and
ℎ𝜈 the photon energy. For silicon, the photon energies required for optical
generation are ℎ𝜈 > 𝐸𝑔 = 1.12 eV (corresponding to 𝜆 = 1107 nm).
However, silicon is an indirect band gap semiconductor, as the energy maximum
of the valence band and the energy minimum of the conduction band are located
at different values of crystal momentum [37]. Therefore, the absorption of a
photon with an energy below the direct bandgap of c-Si requires an interaction
with the crystal lattice (phonon absorption or emission), which leads to a strong
dependence of the band-to-band absorption coefficient 𝛼0 on 𝜆. Only for photon
energies ℎ𝜈 > 3.4 eV ( 𝜆 = 365 nm), corresponding to the direct band gap of
silicon, the absorption coefficient saturates around 𝛼0 ≈ 106 cm−1. Figure 2.2
depicts 𝛼0 as well as the corresponding penetration depth 𝐿𝛼 in the range 250 nm
< 𝜆 < 1300 nm [38].
9