A Modified Phenylfluorone Method for Determining Organotin Compounds in the ppb and Subppb Range
Bạn đang xem bản rút gọn của tài liệu. Xem và tải ngay bản đầy đủ của tài liệu tại đây (1.07 MB, 3 trang )
Journal of Analytical Toxicology, Vol. 4, January/February 1980
A Modified Phenylfluorone Method for Determining
Organotin Compounds in the ppb and Sub-ppb Range
L.R. Sherman* and T.L. Carlson
Department of Chemistry, The University of Akron, Akron, OH 44325
This research was supported by Edna McConnel Clark Foundation, New York, NY.
*Author to whom correspondence should be sent.
Methods and Materials
Reagents
Introduction
Yrialkyl organotin compounds (OTC) are used as biocidal
agents in controlled-release antifouling preparations (1), molluscicides (2) and mosquito larvicides (3). In order to determine
organotin emission rates from dispensing pellets, and monitor
residual toxicant levels in the hydrosphere, absorbing solid
and biological specimens, it is imperative that analytical
methods be developed that will accurately assess ultra-low concentrations. The method must be specific for organotin species
and overcome interference from the ubiquitous inorganic tin
background.
The phenylfluorone method has been proven to be a superior
analytical method having sensitivity in the tzg range when the
colored material is subjected to chloroform extraction (4). The
use of sensitizers, cetyltrimethylammonium bromide (CTAB),
and cetylpyridinium bromide (CPB), enhances tin IV -catechol
violet complex color formation, but gives a bathocromic shift
(5,6,7). The use of C T A B with phenylfluorone at pH 1.2 yields
an intense k,,o~ at 530 nm and has been successfully utilized in
the range of 0.1 to 4 ppm tin (8). The technique reported herein
is a modification of the latter method keyed to the specific determination of O T C in the sub part-per-billion range.
All reagents used were of the highest available purity and
no pretreatment was required.
Sodium Hydroxide (50%). 50 g of NaOH pellets were dissolved in distilled water and diluted to 100 mL after cooling.
OTC Stock Solution. 44.5 mg of bis(tri-n-butyltin) oxide
(TBTO) ( M & T Chemical Co., Rahway, NJ (C.A. registry
number 56-35-9) Assay (9) 98.9%) was dissolved in 95% ethanol,
quantitatively transferred to a 500 mL volumetric flask and
diluted to volume in the same solvent to yield 35.5 /~g of tin
per mL.
TBTO Standard Solution. 3.0 mL of OTC stock solution
was diluted to 100 mL with 95% ethanol to prepare a 1.068
~ g / m L tin solution. This standard was prepared fresh as needed.
Phenylfluorone. I0 mg of phenylflluorone (Eastman Kodak
Co., Rochester, NY) 2,6,7-tri-hydroxy-9-phenylisoxanthane-3one, was dissolved in 25 mL of ethanol containing 0.2 m L of
concentrated sulfuric acid, and dilute to 100 mL with ethanol.
This solution is stored in the dark and further diluted to a 10-4
M solution when used.
CTAB. 0.10 g of cetyltrimethylammonium bromide (Eastman Kodak Co., Rochester, NY) was dissolved in warm distilled water and diluted to 100 mL; 1.0 mL was further diluted to
25 mL when used.
Preparation of Calibration Curve
Standard T B T O solution, 0-4.0 ug (0,1,2,3, & 4 mL), was
added to 200 mL of distilled water and extracted with two 20
mL aliquots of hexane. Extracts were then added to 1 mL of
cone. H2SO4 in a 30 mL beaker and the hexane slowly evaporated under reflux conditions. When HzSO4 reflux initiated,
30% hydrogen peroxide was added one drop at a time to the
sample to destroy the organic material and oxidize the tin.
Heating continued until the colorless refluxing acid filled approximately 2/3 of the beaker. About 15 mL of distilled water
and 2.2 mL of CTAB were added to the cooled samples, 50%
N a O H was used to adjust pH to 1.2, and materials were quantitatively transferred to 25 mL flasks. 1 mL of phenylfluorone
and distilled water, previously adjusted to pH 1.2 with H2SO4,
was added to dilute the samples to volume. After 40 minutes at
Reproduction(photocopying)of editorialcontentof thisjournalis prohibitedwithoutpublisher'spermission.
31
Journal of Analytical Toxicology, Vol. 4, January/February 1980
room temperature, the samples were measured on a Bechman
25 U.V.-Vis. spectrophotometer at the ,X.m~near 535 nm using
water as the blank.
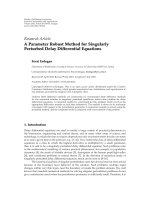
Table I. Effect of Hexane Extraction Upon
the Analysis of TBTO
Fleld Samples
Sample
A number of controlled release monolithic molluscides containing T B T O have been field tested on St. Lucia Island in the
Caribbean. Environmental samples of water, soil, plants, fish,
and other aquatic life have been collected and have been qualitatively tested for OTC as follows:
Water Samples: 200 mL of water was extracted with hexane
as described above for the TBTO curve.
Solid Samples: The soils were extracted with hexane and the
hexane removed as described above. 2 mL of H2SO4 was used.
Plants, Fish, and Other Aquatic' Specimens: These were
totally dissolved in 2-4 mL sulfuric acid and analyzed as described previously.
1. Extraction
2. Extraction
3. Extraction
4. Extraction
Extractions
A set of standard T B T O samples were prepared as outlined
in the experimental section under TBTO Standards and were
extracted with 1,2,3, and 4 -10 mL samples of hexane and determined as described under Preparation of Calibration Curve.
The results, given in Table I, indicate that two bexane extractions will quantitatively remove T B T O from an aqueous sample. The results for all the samples were within the experimental
limitations of the method; however, because the single extraction was less than quantitative, a second extraction is recommended to avoid errors.
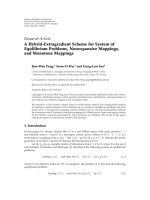
Addition of Inorganic Tin
To each of five standard T B T O samples was added 3.156 #g
of inorganic tin. The samples were extracted and processed as
field samples. The results are tabulated in Table 11. Although
the percent of recovered tin varied randomly from one sample
to the next, the average for the two sets of samples indicates
that inorganic tin is not extracted with the organotin and that
there is negligible suppression or enhancement of the color
development.
The Slope of the Lines
The slope of the line, calculated by the method of least
squares, for the inorganic tin standards was 0.0346 and the
intercept was 0.0144. The slope of the TBTO curve was 0.0344,
and intercept was 0.0580 with an average correlation coefficient
of 0.975. Three different technicians have been using this
method; their first sample usually produced a slope of tess than
0.030 and a correlation coefficient of approximately 0.94. As
their technique improved, the slope was enhanced. After three
or four attempts, the correlation coefficient was better than 0.99
with a standard deviation of 0.0133 or less. The slope o f t h e O T C
and inorganic tin is definitely within experimental values; however, when corrected for the different procedure they are about
20% greater than the published values(8) and reflect an improvement in the analytical method. The large difference in the inter-
32
Analysis
% Recovered
21.6
21.6
21.6
21.6
20.5
21.6
22.3
21.6
94.9
100.0
103.2
100.0
Table II. Effect of Inorganic Tin Upon Analysis of TBTO
Samples
Results
ppb Sn
0
1.
2.
3.
4.
Micrograms*
Sn as TB TO
Added to
200 mL of H20
0.00
1.08
2.16
3.24
4.32
Micrograms
Recovered % Recovered
Set l Set2 Set1 Set2
0.00
0.94
2.03
3.26
5.10
0.00
0.00
1.05 87.0
2 . 3 1 94.0
2.77 100.8
4.29 118.0
Average
99.9
0.00
97.2
108.9
85.5
99.3
97.2
"Each sample contained 5.710,ug of tin sulfate.
cepts is due to either colored impurities in the hexane, sulfuric
acid and hydrogen peroxide, or due to the fact that different
spectrophotometers and cells were used in preparing the two
curves. Furthermore, only unmatched 1 X 1 cmcells wereavailable in preparing the O T C curve whereas matched 1 X 10 mm
cells were available in preparing the inorganic curve.
Field Samples
A large number of environmental samples (approximately
400) consisting of water, soil, plants, fish, and other aquatic
life were recovered from the test area on St. Lucia Island in the
Caribbean and have been analyzed for residual OTC. The environmental samples were treated as described above and the
organotin assayed as tin varies from non-detectable to 44 ppb,
which corresponds to 8.8 ~ug of tin. Most of the samples contained between .250 and 1.00 ug of tin (10). Although the data
is readable to three significant figures, reproducibility of replicated environmental samples was about + I in the second
significant figure.
Conclusions
The modified phenylfluorone method for analyzing tin can
be used for the specific analysis of organotins in the ppb range.
The method can be used for very reliable analysis of water, soil,
or aquatic life, in the range of 500 ppt (100 ng) to 25 ppb (5 ,ug).
Above 25 ppb the samples no longer fit a Beers Law plot and
need to be diluted before developing the color.
Journal of Analytical Toxicology, Vol. 4, January/February 1980
References
1. N.F. Cardarelli. Controlled Release Pesticide Formulations
CRC Press, Cleveland, OH 1976, p. 210.
2. N.F. Cardarelli. Controlled Release Molluscicides, monogr.
The University of Akron, Akron, OH 1977, p. 136.
3. N.F. Cardarelli. Controlled release organotins as mosquito
larvicides. Mosq. News 3:328-33 (1978).
4. A. Sh. Shakhabudinov and O.A. Tataen. Reaction between
tin (IV) and trihydroxyfluorones in the presence of antipyrene.
J. Anal Chem. USSR 27:2163-66 (1972).
5. H. Corbin. Rapid and selective pyrocatechol violet method
for tin. Anal. Chem. 45:534-37 (1973)o
6. R.M. Dagnall, T.J. West, and P. Young. The catechol violet
colour reaction for tin (IV) sensitized by cetyltrimethylam-
monium bromide. Analyst (London) 92:27-30 (1967).
7. V. Svoboda and V. Chromy. Reactions of metallochromic
indicators on micelles-III. Talanta 13:237-44 (1966).
8. V.H. Kulkarnl and M.L. Good. Phenylfluorone method for
the determination of tin in submicrogram levels with cetyltrimethylammonium bromide. Anal Chem. 50:973-75 (1978).
9. N.H. Furman. Standard Methods of Chemical Analysis. D.
Van Nostrand Co., Inc., Princeton, NJ 1962, pp. 1078-79.
10. J.D. Christie, T.L Carlson, L.R. Sherman, and N.F. Cardarelli.
Laboratory and field trials of a slow release organotin molluscicide in St. Lucia. In production. University of Texas,
Galveston, TX 77550 (1980).
Manuscript received July 23, 1979
Quantitative Determination of 2-Hydroxy-3-Methoxy6/3-Naltrexol (HMN), Naltrexone, and 6/3-Naltrexol
in Human Plasma, Red Blood Cells, Saliva, and Urine
by Gas Liquid Chromatography
K. Verebey, A. De Pace, D. Jukofsky, J.V. Volavka, and S.J. MuI(~
New York State Division of Substance Abuse Services, Bureau of Laboratories and Testing, 80 Hanson Place,
Brooklyn, NY 11217
Introduction
2-Hydroxy-3-methoxy-6/3-naltrexol (HMN) is a minor
metabolite of naltrexone in man (!-4) (Figure 1). It was isolated
from human red blood cells and urine of subjects taking naltrexone (1). A methylated 2,3-catechol type metabolite of
naltrexone with the same mass unit as HMN was also reported
(2). The assignment of the methyl group in the -3- position was
initially based on the fact that this metabolite is excreted only
in the free form. Naltrexone, 6/3-naltrexol and various similar
molecules are being glucuronidated in the 3 position and large
percentages of such molecules are excreted into the urine in the
conjugated form. If the 3 position is blocked by methylation,
no glucuronide can form, as it was observed with HMN (1).
More recently, the structure of HMN was proven by synthesis
(3) and by studies utilizing nuclear magnetic resonance spectra
(4). In an earlier pharmacokinetic study, HMN was quantitated
in urine and expressed as 6/3-naltrexol equivalents (5). The
recent availability of synthetic HMN allowed development of
new and specific quantitative methodology. In this communication we report on clinically applicable methods for the determination of HMN, naltrexone and its major metabolite
6/3-naltrexol in plasma (or serum), RBC, saliva, and urine.
Reprint requests to: Dr. K. Verebey, New York State Division of
Substance Abuse Services, Bureau of Laboratories and Testing,
80 Hanson Place, Brooklyn, NY 11217
Reproduction(photocopying)of editorialcontentof this journalis prohibitedwithoutpublisher'spermission.
33