Bài giảng kinh tế lượng ứng dụng 2
Bạn đang xem bản rút gọn của tài liệu. Xem và tải ngay bản đầy đủ của tài liệu tại đây (1.99 MB, 153 trang )
KINH TẾ LƯỢNG ỨNG DỤNG
1
Nội dung môn học
Phần I: KTL cơ bản
Mô hình hồi quy: ước lượng, kiểm định và dự báo
Các khuyết tật của mô hình
Định dạng mô hình
Mô hình hồi quy với biến giả, biến tương tác
Phần II: Phân tích chuỗi thời gian
Chuỗi thời gian dừng và không dừng
Các mô hình chuỗi thời gian ứng dụng
Phần III: Thực hành máy tính với phần mềm Eviews/Stata
2
HƯỚNG TIẾP CẬN THEO KINH TẾ LƯỢNG
Lý thuyết hoặc giả thiết
Mô hình toán kinh tế
Mô hình kinh tế lượng
Thu thập số liệu
Ước lượng thông số
Kiểm định giả thiết
Xây dựng lại mô hình
Diễn dịch kết quả
Quyết định chính sách
Dự báo
3
Dữ liệu cho nghiên cứu kinh tế lượng
Dữ liệu chéo: bao gồm quan sát cho
nhiều đơn vị kinh tế ở một thời điểm cho
trước
Dữ liệu chuỗi thời gian: bao gồm các
quan sát trên một đơn vị kinh tế cho trước
tại nhiều thời điểm.
Dữ liệu bảng: là sự kết hợp giữa dữ liệu
chéo và dữ liệu chuỗi thời gian.
4
Time Series Data
Examples of Problems that Could be Tackled Using a
Time Series Regression
How the value of a country’s stock index has
varied with that country’s macroeconomic
fundamentals.
How a company’s stock returns has varied when it
announced the value of its dividend payment.
The effect on a country’s currency of an increase
in its interest rate
5
Cross Sectional Data
Examples of Problems that Could be Tackled Using a
Cross-Sectional Regression
The relationship between company size and the
return to investing in its shares
Acquirer abnormal returns in M & A within banks
The relationship between a country’s GDP level
and the probability that the government will default
on its sovereign debt.
6
Panel Data
Examples of Problems that Could be Tackled Using a
Cross-Sectional Regression
The daily prices of a number of blue chip stocks
over two years
Micro-finance and Poverty: Evidence Using Panel
Data
Corruption and Trade Protection
7
Tips for data source
One of the most frustrating things in doing an
econometrics paper is finding the data. Do not
spend a lot of time on a topic before determining
whether there is data available that will allow
you to answer your question. It is a good idea
to write down your ideal data set that would
allow you to address your topic. If you find
that the available data is not even close to
what you had originally desired, you might
want to change your topic.
8
CROSS-COUNTRY COMPARISONS
- a United Nations site, provides
links to the statistical agencies of countries. Warning – if
you are gathering international data from a variety of
sources, make sure that the definitions of variables are
comparable. Try and find sources that have compiled
cross-country statistics on your topic. They have likely
already adjusted for definitional differences.
Check out the websites of the major international
organizations – the OECD has a lot of data
(www.oecd.org, click on statistics).
9
MACRO TOPICS
Macro (aggregate) data may be a little easier to find than
micro data. Since the data is aggregated (i.e.
unemployment rates versus whether a person was
unemployed last year) there is little concern of
confidentiality which hampers a lot of the gathering of
micro-level data. The downside of using aggregate data
is that the number of observations that you have are
typically much lower and you may have less variation.
Also, note that some data used in time series are
collected annually, some quarterly, some daily. Make
sure you are able to get consistent time periods.
10
FIRM LEVEL DATA
This type of data is notoriously more difficult to find, for
confidentiality reasons. However, industry analyses
make for interesting econometric papers. For example,
one recent project looked at the effect of pharmaceutical
advertisement regulation on sales. Or one could look at
the impact of trade regulations or employment
regulations on a certain industry. To do a project like
this, I would suggest first looking at the annual reports of
companies that you are interested in. Also, remember
that the fewer companies that you have the more years
of data you will need.
11
FINANCIAL DATA
Financial data is useful, not just for finance related topics
but as a way of measuring the performance of certain
industries. Careful with this type of data – a lot of it costs
money. Be sure that the data is downloadable and not
just available.
Some useful websites that you can collect financial data
(www.cophieu68.vn; />www.thomsonone.com)
12
13
Also, remember that knowing the location of your data –
website, reference book, etc – is not the same as having
your data available to use. It may take a LONG time to
get the data in a format that SOFTWARES can read.
Do not leave this till the last minute.
For most data, I enter the data into Excel first. Then …
14
Some Points to Consider when reading papers
in the academic literature
1. Does the paper involve the development of a theoretical model or
is it merely a technique looking for an application, or an exercise in
data mining?
2. Is the data of “good quality”? Is it from a reliable source? Is the
size of the sample sufficiently large for asymptotic theory to be
invoked?
3. Have the techniques been validly applied? Have diagnostic tests
for violations of been conducted for any assumptions made in the
estimation of the model?
4. Have the results been interpreted sensibly? Is the strength of the
results exaggerated? Do the results actually address the questions
posed by the authors?
5. Are the conclusions drawn appropriate given the results, or has
the Importance of the results of the paper been overstated?
15
Phần I- Mô hình kinh tế lượng cơ bản
Mô hình hồi quy:
Ước lượng
Kiểm định
Dự báo
Các khuyết tật của mô hình
Định dạng mô hình
16
Giới thiệu
Nhà kinh tế: cung tiền tăng thì lạm phát tăng (các yếu tố
khác không đổi)
Nhà thống kê: cung tiền và lạm phát có quan hệ tuyến
tính chặt với nhau (xu hướng thay đổi rất giống nhau)
Nhà kinh tế lượng: khi cung tiền tăng 1% thì lạm phát
tăng 0.2% (khi các yếu tố khác không đổi)
Tác động của việc tăng cung tiền lên lạm phát?
Tác động của việc tăng chi tiêu chính phủ lên tăng
trưởng kinh tế?
Tác động của việc tăng giá lên doanh thu?, v.v
17
Mô hình hồi quy tuyến tính
Mục đích của phân tích hồi quy:
Dùng số liệu quan sát để ước lượng ảnh hưởng của
các biến số (biến độc lập) lên giá trị trung bình của
một biến số nào đó (biến phụ thuộc)
Từ các tham số ước lượng được:
Đánh giá tác động ảnh hưởng
Thực hiện các dự báo
Đưa ra các khuyến nghị về chính sách
18
Mô hình hồi quy tuyến tính – giới thiệu
Ví dụ: Q = Q (Y, P)
=> hàm hồi quy tuyến tính thể hiện quan hệ này:
Q = β1+ β2 Y+ β3 P + u, nếu giả thiết E(u) =0 =>
E(Q| Y, P) = β1+ β2 Y+ β3 P
Nếu biết chẳng hạn β1 =10, β2 =0.6, β3 = -0.3 =>
Khi giá tăng 1 đơn vị => ?
Khi thu nhập tăng 1 đơn vị =>?
Khi Y =100, P =10 thì =>?
Chúng ta muốn biết các βj
19
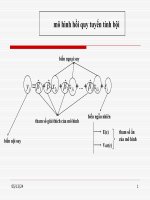
Mô hình hồi quy tuyến tính – giới thiệu
Mô hình hồi quy tổng thể dạng tuyến tính
Yi 1 2 X 2i 3 X 3i .. k X ki ui
E (Y | X 2 ;.., X k ) 1 2 X 2 .. k X k
Các thành phần của mô hình:
Biến phụ thuộc
Các biến độc lập
Hệ số chặn
Hệ số góc, hệ số hồi quy riêng
20
Mô hình hồi quy tuyến tính – giới thiệu
Ý nghĩa của các hệ số hồi quy
Hệ số chặn
Hệ số góc
Tuy nhiên các hệ số này thường không biết => cần ước
lượng
Hàm hồi quy mẫu: giả sử có mẫu ngẫu nhiên n quan sát
Yˆi ˆ1 ˆ2 X 2i ˆ3 X 3i .. ˆk X ki
ước lượng
cho E(Y| Xj)
Ước lượng cho các βj chưa biết
21
Mô hình hồi quy tuyến tính – giới thiệu
Q: làm thế nào để nhận được các ước lượng tốt
Viết lại hàm hồi quy mẫu:
Yi ˆ1 ˆ2 X 2i ˆ3 X 3i .. ˆk X ki ei
=> sai lệch giữa giá trị thực tế và giá trị ước lượng là
ei Yi Yˆi
Tìm đường hồi quy mẫu mà có: e12 + e22 +...en2 bé nhất
=> OLS
22
Mô hình hồi quy tuyến tính – ước lượng OLS
Mô hình hai biến => UL OLS là:
ˆ 2
x y
x
2i
2
2i
var( ˆ 2 )
i
; x2i : ( X i X ); yi : (Yi Y )
2
2
x
2i
ˆ 2 ei2 /( n 2)
Mô hình 3 biến =>
yi x2i x 3i yi x3i x2i x 3i
2
ˆ 2
x
2
2i
x 3i ( x2 i x3i )
2
2
var( ˆ 2 )
2
(1 r232 ) x 2i
2
23
Định lý Gauss-Markov
Định lý: Nếu các giả thiết 1-6 được thỏa mãn thì: các ước
lượng nhận được từ phương pháp OLS là:
Tuyến tính, không chệch*
Có phương sai nhỏ nhất trong lớp các UL KC
Các giả thiết:
1. E(ui|X2i,...,Xki)=0: không có sai số hệ thống
2. var(ui|X2i,...,Xki) = δ2 với mọi i
3. cov(ui,uj)=0 với mọi i khác j
4. ui ~ N(0, δ2) với mọi i
5. Không có đa cộng tuyến hoàn hảo giữa các biến Xj
6. Biến Xj là phi ngẫu nhiên, nếu là ngẫu nhiên thì phải độc
lập với Ui
24
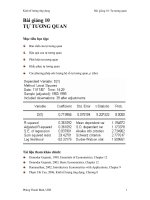
Đánh giá sơ bộ về hàm hồi quy ước lượng
Vậy nếu các giả thiết trên thỏa mãn thì p/p OLS cho ta các
UL điểm tốt nhất cho các tham số của tổng thể
Ngoài ra với giả thiết 6 về tính chuẩn của u, ta biết được
phân phối của các ước lượng
Dấu của các hệ số ước lượng: có phù hợp với lý thuyết kinh
tế không?
Hệ số xác định (hệ số xác định bội): R2 , cho biết các biến
giải thích trong mô hình giải thích được bao nhiêu phần
trăm sự biến đổi của biến phụ thuộc
25