genetic algorithm based solar tracking system
Bạn đang xem bản rút gọn của tài liệu. Xem và tải ngay bản đầy đủ của tài liệu tại đây (189.23 KB, 10 trang )
Genetic Algorithm Based Solar Tracking System
D.F.Fam & S.P. Koh & S.K. Tiong & K.H. Chong
Department of Electronic & Communication Engineering, Universiti Tenaga Nasional,
Km 7, Jalan Kajang-Puchong, 43009 Kajang, Selangor.
,,,
Abstract: The current trend in solar concentrator tracking system is to use an open-loop local controller
that computes the direction of the solar vector based on geographical location and time. But it is not
accurate because it has error from computing the sun’s position, mechanical, controller systems and
installation. Literature suggested that the photovoltaic panels could produce maximum power if the
panels have angle of inclination zero degree to the sun position. In this research, genetic algorithm is one
of the optimization techniques used to maximize the performance of solar tracking system. This work
evaluates the best combination of GA parameters by always fine-tuning the position of solar tracking
prototype to receive maximum solar radiation. Simulation results demonstrated the ability of GA solar to
produce consistent result despite of different environmental conditions.
Index Terms—genetic algorithm, solar tracking, photovoltaic panel
1. Introduction
The solar tracker, a device that keeps PV or
photo-thermal
panels in an optimum position perpendicular
to the solar radiation during daylight hours,
increases the collected energy. The first
tracker introduced by Finster in 1962, was
completely mechanical. One year later,
Saavedra presented a mechanism with an
automatic electronic control, which was used
to orient an Eppley pyrheliometer [1]Solar
tracking can be implemented by using one-
axis, and forhigher accuracy, two-axis sun-
tracking systems. For a two-axis sun-tracking
system, two types are known as: polar
(equatorial) tracking and azimuth/elevation
(altitude–azimuth) tracking.[2] High-
concentration solar requires the sun to be
tracked with great accuracy for maximum
output voltage. The accuracy required
depends on the specific characteristics of the
concentrating system being analyzed.
In general, the higher system concentration
needs the higher accuracy tracking system.
The current trend in solar concentrator
tracking system is to use an open-loop local
controller that computes the direction of the
solar vector based on geographical location
and time. But it is not enough accurate
because it has error from computing the sun’s
position, mechanical, controller systems and
installation. [3]The abundance of solar energy
throughout the whole year in Malaysia due to
the geographic location near the Equator line
provides strong reason for the implementation
of an efficient PV energy system.
Studies show that solar panels constitute a
large portion (57%) of the total cost to install
PV energy system [4] Since the purchase of
solar panel is quite expensive, therefore
research has been heavily invested by
Ministry of Science, Technology and
Innovation on few local universities to study
on the implementation of PV technology as a
renewable energy in Malaysia to replace coal
and gas which form the primary resources to
generate electricity by Tenaga Nasional
Berhad.The conventional solar panel which is
used to produce power is not maximized to its
peak performance due to its static placement
which limits the area of exposure to the
sunlight[5]Abdallah et al. designed and
constructed a two-axes, open loop,PLC
controlled sun-tracking system. Their work
principle is based on mathematical definition
of surface position that is defined by two
angles: the slope of the surface, and azimuth
angle. The slope was considered to be equal
as zenith angle of the sun. Two tracking
motors, one for the joint rotating about the
horizontal N–S axis and the other for the joint
rotating about the vertical axis were used.The
daylight divided into four intervals and during
each of them the solar and motors speed were
defined and programmed into PLC.They
predicted that the power consumption to drive
motors and control systems hardly exceeds
3% of power saved by the tracking system.
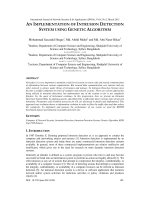
Fig. 1 shows energy comparison between the
tracker and the fixed surface inclined at 32 °.
They concluded that the use of two-axes
tracking surfaces results in an increase in total
daily collection of about 41.34% as compared
to that of a fixed one [6,7].Bingol et al.
proposed, implemented and tested a
microcontroller based two-axis solar tracking
system. They used light dependent resistors
(LDR) as sensors, stepper motors as actuators
and a microcontroller. In addition, the system
was connected to a PC via RS232 for sun
position monitoring. A crystal with a
frequency of 4 MHz was used as a clock
signal generator for the microcontroller. The
panel degree from vertical axis was fixed at
50 °. The experimental study for two solar
collector panels, one stationary and the other
rotary were employed in the test. Temperature
of the panels versus time was measured with
a minute interval and 50 data were captured.
The angle of intervals was almost 5.2 °. A
distinction of 9 ° between rotary and
stationary panel was observed. This result
verified that the rotary panel containing solar
tracking system took more light density than
the stationary panel[8]
Fig 1 Energy comparison between tracking
and fixed solar system [9]
In this research, solar cell polycrystalline and
GA has been used to fully maximize the
performance of the solar tracking prototype.
GA is used to overcome the current limitation
of the method that had been used by other
researchers where the best GA parameters
will be chosen based on the intensity fitness
function and both angular axis will be
simulated to face the solar panel at the right
angle for maximum power generation. In the
following section, methodology will be
discussed followed by results of the
simulation and detailed discussion. Finally,
conclusion is presented for further
improvement in the future.
2. Methodology
Methodology part is divided into few areas
which include initial population, evaluation,
selection, crossover and mutation.
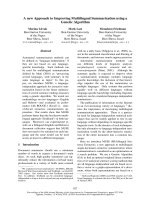
In this paper, the flowchart of the system
development is highlighted as shown in Fig. 2
Fig. 2: Flowchart of the system development
2.1 Initial Population
Initial population is randomly generated in 8
real values as follow:
T1 = [ 0, 10, 11, 20, 1, 10,15,19]
T2 = [ 1, 9, 15, 19, 1, 8,11,16]
T3 = [ 0, 5, 14, 19, 1, 7,12,18]
T4 = [ 1, 5, 13, 18, 1, 8,15,19]
T5 = [ 0, 8, 13, 18, 1, 9,13,17]
T6 = [ 1, 4, 11, 17, 1, 8,12,19]
T7 = [ 1, 7, 15, 16, 0, 9,14,18]
T8 = [ 1, 3, 14, 16, 1, 8,15,17]
T9 = [ 1, 2, 12, 17, 1, 3,12,16]
T10 = [ 1, 8, 12, 18, 1, 9,13,18]
The first gene and fifth gene of each
chromosome are used to indicate the direction
of solar tracking axles, both horizontal and
vertical axles to be left indicated by 0 or right
indicated by 1.
Second to fourth gene of each chromosome
are used to indicate the different angles of
horizontal axle to be positioned in order to get
the maximum sun intensity.
At the same time, sixth to eighth genes of
each chromosome are used to indicate the
different angles of vertical axle to be
positioned in order to get the maximum sun
intensity
Both motors are used to control the horizontal
and vertical axles which will be directed by
PLC controller.
2.2 Evaluation
In this wok, the objective function F(T
k
) need
to be evaluated by measuring the voltage
from solar cell polycrystalline.
T
k
=(A^B) exp[-C X (d
k
)
E
]
Where d
k
represents voltage from solar cell
polycrystalline, A and B are fixed coefficient
while C and E are tuning parameters.
Each chromosome will be evaluated based on
the objective function and fitness is simply
equal to the value of objective function
F (T
k) ,
k = 1,2…..k+1, where k = population
size
From the evaluation, strongest chromosome
and weakest will be identified.
Program Initialization
Selection
Start
Evaluation
Crossover
Y
Solution found
End
N
Gen > Max Gen
Y
End
N
2.3 Selection
A roulette wheel selection approach is used in
this research where it belongs to the fitness
proportional selection and new population is
selected with based on probability distribution
according to fitness values.
Fitness value, F (T
k
) will be calculated for
each chromosome, (T
k
)
Total fitness equation for the population will
be as below:
K+1
F = Σ F (T
k
) (1)
K=1
For each chromosome, the probability
equation, P
k
P
k
= (T
k
) , k = 1,2… K+1 where k=
population size (2)
F(T
k
)
For each chromosome, cumulative probability
equation, C
k
K+1
C
k
= Σ P
k
k = 1,2… K+1 where k=
population size (3)
K=1
Roulette wheel is spanned for each selection
process and a new single chromosome will be
selected based on its fitness value.
2.4 Crossover
Crossover used in this research is one cut
point method which randomly select on cut
point location and each side of chromosome
will be exchanged between two parents to
generate offspring. Consider two
chromosomes as follow and cut point is
selected after 3
rd
gene.
T1 = [ 1, 10, 15, 20, 1, 9,11,19]
T2 = [ 1, 9, 14, 18, 1, 8,13,17]
The resulting offspring by exchanging the
right part of their parents would be as below:
T1 = [ 1, 10, 14, 20, 1, 9,11,19]
T2 = [ 1, 9, 15, 18, 1, 8,13,17]
The probability of crossover for each
experiment is set as
Pc= 0.8, therefore, 80% of chromosomes will
undergo crossover.
2.5 Mutation
Mutation changes one or more genes
according to probability.
Assume 3
rd
gene and 4
th
gene of the
chromosome T1 is selected for a mutation.
Since the gene is 15 and 20, therefore, both
number will be interchanged and
chromosome after mutation is as below :
T1 = [ 1, 10, 15, 20, 1, 9,11,19]
T
1m
= [ 1, 10,20,15, 1, 5,13,20]
The probability of mutation for each
experiment is set as
Pc= 0.025, therefore, 2.5% of chromosomes
will undergo mutation.
After each chromosome have finished the
cycle of crossover and mutation, the process
will go back to evaluation procedure to
continue the GA operations until the
experiment ends.
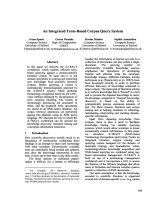
3. Simulation
A solar tracking has been developed to
evaluate the application of genetic algorithm
as depicted in Figure 3. It would explore the
intensity of sunlight at different angles and
locate the highest intensity with the GA
simulation. The simulation has been carried
out using the GA parameters as given in 3
tables below, Table 1, Table 2 and Table 3
with the objectives to study
Table I: GA simulation parameter
Simulation Parameter Value
Maximum Generation
Population, p
o
Chromosome length
Selection Method
Crossover Rate, p
c
Mutation Rate, p
m
Mutation Point, m
p
No. of Best
Chromosomes Kept, k
b
Crossover Type
50
10
8
Roulette Wheel
80%
0.025
2
1
Dynamic
The solar tracking is placed at the origin
point of (Xo=45 °, Yo=45 °). The default
base point is at the centre of the workspace.
In the simulation, the solar cell will keep on
searching the highest intensity location with
GA searching method. Both stepper motors
controlling X and Y axis of solar tracking will
receive the signals through motion controller
to determine the angles of movement for both
axis. Highest intensity that is absorbed by
solar cell will convert the digital voltage to
analogue signal to be transmitted to Visual
basic program via Programmable logic
controller Panasonic FPX-C14R.
Figure 3 : A solar tracking has been developed to evaluate the application of genetic algorithm