Handbook of LABOR ECONOMICS vol 3b
Bạn đang xem bản rút gọn của tài liệu. Xem và tải ngay bản đầy đủ của tài liệu tại đây (20.58 MB, 918 trang )
INTRODUCTION
TO THE SERIES
The aim of the Handbooks in Economics series is to produce Handbooks for various
branches of economics, each of which is a definitive source, reference, and teaching
supplement for use by professional researchers and advanced graduate students. Each
Handbook provides self-contained surveys of the current state of a branch of economics in the form of chapters prepared by leading specialists on various aspects of this branch
of economics. These surveys summarize not only received results but also newer developments, from recent journal articles and discussion papers. Some original material is also
included, but the main goal is to provide comprehensive and accessible surveys. The
Handbooks are intended to provide not only useful reference volumes for professional
collections but also possible supplementary readings for advanced courses for graduate
students in economics.
CONTENTS
OF THE HANDBOOK
VOLUME 1
PART 1 - SUPPLY OF LABOR
Chapter 1
Labor Supply of Men: A Survey
JOHN P E N C A V E L
Chapter 2
Female Labor Supply: A Survey
M A R K R. K I L L I N G S W O R T H and JAMES J. H E C K M A N
Chapter 3
Models of Marital Status and Childbearing
' M A R K M O N T G O M E R Y and JAMES TRUSSELL
Chapter 4
Home Production - A Survey
REUBEN GRONAU
Chapter 5
Retirement from the Labor Force
E D W A R D P. L A Z E A R
Chapter 6
Demand for Education
R I C H A R D B. F R E E M A N
Chapter 7
Forestalling the Demise of Empirical Economics: The Role of Microdata in Labor
Economics Research
F R A N K STAFFORD
viii
Contents of the Handbook
PART 2 - DEMAND FOR LABOR
Chapter 8
The Demand for Labor in the Long Run
DANIEL S. HAMERMESH
Chapter 9
Dynamic Models of Labour Demand
S. J. NICKELL
PART 3 - WAGE STRUCTURE
Chapter 10
Wage Determinants: A Survey and Reinterpretation of Human Capital Earnings Functions
ROBERT J. WILLIS
Chapter 11
The Determination of Life Cycle Earnings: A Survey
YORAM WEISS
Chapter 12
The Theory of Equalizing Differences
SHERWIN ROSEN
Chapter 13
The Economic Analysis of Labor Market Discrimination: A Survey
GLEN G. CAIN
VOLUME 2
PART 4 - LABOR MARKET EQUILIBRIUM A N D FRICTION
Chapter 14
The Employment Relationship: Job Attachment, Work Effort, and the Nature of Contracts
DONALD O. PARSONS
Chapter 15
Job Search and Labor Market Analysis
DALE T. MORTENSEN
Chapter 16
The Natural Rate of Unemployment: Explanation and Policy
G. E. JOHNSON and P. R. G. L A Y A R D
Contents of the Handbook
Chapter 17
Cyclical Fluctuations in the Labor Market
DAVID M. L1L1EN and ROBERT E. HALL
PART 5 - THE INSTITUTIONAL STRUCTURES OF THE LABOR MARKET
Chapter 18
The Analysis of Union Behavior
HENRY S. FARBER
Chapter 19
The Economics of Strikes
JOHN KENNAN
Chapter 20
Union Relative Wage Effects
H. GREGG LEWIS
Chapter 21
Segmented Labor Markets
PAUL TAUBMAN and MICHAEL L. WACHTER
Chapter 22
Public Sector Labor Markets
RONALD G. EHRENBERG and JOSHUA L. SCHWARZ
V O L U M E 3A
PART 6 - OVERVIEW ISSUES
Chapter 23
Empirical Strategies in Labor Economics
JOSHUA D. ANGRIST and ALAN B. KRUEGER
Chapter 24
New Developments in Econometric Methods for Labor Market Analysis
ROBERT A. MOFFITT
Chapter 25
Institutions and Laws in the Labor Market
FRANCINE D. BLAU and LAWRENCE M. KAHN
ix
Contents of the Handbook
Chapter 26
Changes in the Wage Structure and Earnings Inequality
LAWRENCE F. KATZ and DAVID H. AUTOR
PART 7 - THE SUPPLY SIDE
Chapter 27
Labor Supply: a Review of Alternative Approaches
RICHARD BLUNDELL and THOMAS MACURDY
Chapter 28
The Economic Analysis of Immigration
GEORGE J. BORJAS
Chapter 29
Intergenerational Mobility in the Labor Market
GARY SOLON
Chapter 30
The Causal Effect of Education on Earnings
DAVID CARD
Chapter 31
The Economics and Econometrics of Active Labor Market Programs
JAMES J. HECKMAN, ROBERT J. LALONDE and JEFFREY A. SMITH
V O L U M E 3B
PART 8 - THE DEMAND SIDE
Chapter 32
Minimum Wages, Employment, and the Distribution of Income
CHARLES BROWN
Chapter 33
Firm Size and Wages
WALTER Y. OI ,and TODD L. IDSON
Chapter 34
The Labor Market Implications of International Trade
GEORGE JOHNSON and FRANK STAFFORD
Contents of the Handbook
PART 9 - LOOKING WITHIN FIRMS
Chapter 35
Individual E m p l o y m e n t Contracts
JAMES M. MALCOMSON
Chapter 36
Careers in Organizations: Theory and Evidence
ROBERT GIBBONS and MICHAEL WALDMAN
Chapter 37
Mobility and Stability: the Dynamics of Job Change in Labor Markets
HENRY S. FARBER
Chapter 38
Executive Compensation
KEV1N J. MURPHY
P A R T 10 - I N T E R A C T I O N S B E T W E E N D E M A N D A N D S U P P L Y
Chapter 39
N e w Developments in Models of Search in the Labor Market
DALE T. MORTENSENand CHRISTOPHERA. PISSARIDES
Chapter 40
The Analysis of Labor Markets using Matched E m p l o y e r - E m p l o y e e Data
JOHN M. ABOWD and FRANCIS KRAMARZ
Chapter 41
Gross Job Flows
STEVEN J. DAVIS and JOHN HALTIWANGER
P A R T 11 - E M E R G E N T L A B O R M A R K E T S
Chapter 42
Labor Markets in the Transitional Central and East European Economies
JAN SVEJNAR
Chapter 43
Labor Markets in Developing Countries
JERE R. BEHRMAN
xi
xii
Contents of"the Handbook
V O L U M E 3C
PART 12 - LABOR MARKETS AND THE MACROECONOMY
Chapter 44
Labor Markets and Economic Growth
ROBERT TOPEL
Chapter 45
Microeconomic Perspectives on Aggregate Labor Markets
GIUSEPPE BERTOLA
Chapter 46
Labor Market Institutions and Economic Performance
STEPHEN NICKELL and RICHARD LAYARD
Chapter 47
The Causes and Consequences of Longterm Unemployment in Europe
STEPHEN MACHIN and ALAN MANNING
PART 13 - POLICY ISSUES IN THE LABOR MARKET
Chapter 48
Race and Gender in the Labor Market
JOSEPH G. ALTONJI ,and REBECCA BLANK
Chapter 49
New Developments in the Economic Analysis of Retirement
ROBIN L. LUMSDAINE and OLIVIA S. MITCHELL
Chapter 50
Health, Health Insurance and the Labor Market
JANET CURRIE and BRIGITTE C. MADRIAN
Chapter 51
Economic Analysis of Transfer Programs Targeted on People with Disabilities
JOHN BOUND and RICHARD V. BURKHAUSER
Chapter 52
The Economics of Crime
RICHARD B. FREEMAN
Chapter 53
Recent Developments in Public Sector Labor Markets
ROBERT G. GREGORY and JEFF BORLAND
PREFACE TO THE HANDBOOK
Modern labor economics has continued to grow and develop since the first Volumes of this
Handbook were published. The subject matter of labor economics continues to have at its
core an attempt to systematically find empirical analyses that are consistent with a
systematic and parsimonious theoretical understanding of the diverse phenomenon that
make up the labor market. As before, many of these analyses are provocative and controversial because they are so directly relevant to both public policy and private decision
making. In many ways the modern development in the field of labor economics continues
to set the standards for the best work in applied economics.
But there has been change since the first two volumes of this Handbook were published.
First and foremost, what was once a subject heavily dominated by American and, to a
lesser extent British, writers is now also a growth field throughout the rest of the world.
The European Association of Labour Economists, formed well before its American rival,
has become the largest and most active organization of its kind. These volumes of the
Handbook have a notable representation of authors - and topics of importance - from
throughout the world. It seems likely that the explosive growth in the development and
study of modem labor economics throughout the world will be a major development that
will continue throughout the next decade.
Second, whereas the earlier volumes contained careful descriptions of the conceptual
apparatus for analysis of a topic, these new volumes contain a wealth of detailed empirical
analyses. The chapters in the new volumes tend to be correspondingly longer, with far
more detail in the empirical analysis than was possible in the earlier volumes. In some
cases, the topics covered could not have even been entertained for consideration a decade
ago.
The authors of the chapters in these volumes have been very responsive in the face of
some strict deadlines, and we are grateful to them for their good humor. We are also deeply
indebted to Barbara Radvany and Joyce Howell for their gracious assistance in helping to
manage the massive task of coordinating authors and the delivery of manuscripts. We
appreciate the efforts of everyone involved in the creation of these volumes, and we hope
that their readers will too.
Orley Ashenfelter and David Card
Chapter 32
MINIMUM
INCOME
WAGES,
EMPLOYMENT,
AND THE DISTRIBUTION
OF
CHARLES BROWN*
University of Michigan and NBER
Contents
Abstract
JEL codes
1 Introduction
2 Theory
2.1
2.2
2.3
2.4
2.5
2.6
2102
2102
2102
2103
Basics
Two-sector models
Heterogeneous labor
Monopsony
Search models
Offsets
2103
3 Evolution of minimum wage legislation in the US
4 Time series evidence
4.1
4.2
4.3
4.4
4.5
4.6
Overview
Hours versus bodies
Differences by race and sex
Coverage
Leads and lags
What happened?
2113
2117
2117
2118
5 Cross-state comparisons
5.1 Early cross-state studies
5.2 Panel-data studies
6 Studies of low-wage industries
6.1
6.2
6.3
6.4
2104
2106
2108
2109
2110
2111
2113
A traditional method of studying minimum wages
Methodological issues
Recent studies of a low-wage industry: retail trade
Recent studies of a low-wage industry: fast food
2119
2119
2121
2121
2122
2130
2130
2131
2133
2134
* I am grateful to Orley Ashenfelter, John Bound, David Card, George Johnson, Alan Krueger, David
Neumark, Gary Solon, and Finis Welch for conversations that have influenced my views in important ways
and warded off some mistakes. Thanks also to Alan Moss (for help with the coverage data), to Arthur van Soest
(for help with the European literature), to Dale Mortensen (search models) and to participants at the conference
organized by Ashenfelter and Card that discussed preliminary versions of the papers in this volume.
Handbook of Labor Economics, Volume 3, Edited by O. AshenJklter and D. Card
© 1999 Elsevier Science B.V. All rights reserved.
2101
2102
7 Comparisons of low- and high-wage workers
8 Impacts of m i n i m u m wages on other outcomes
8.1 Wagedistributionspike at the minimumwage
8.2 Offsets
8.3 Spillovers
8.4 Prices
9 The m i n i m u m wage and the wage and income distributions
9.1 Effectson the wage distribution
9.2 Effects on the distributionof income
10 Conclusions and future directions
10.1 Accountingfor "small" employmenteffects
10.2 Effects on the distributionsof wages and of incomes
10.3 The future of research on the minimumwage
References
C. Brown
2139
2142
2142
2145
2147
2149
2150
2150
2152
2154
2155
2157
2158
2158
Abstract
After nearly a decade of relative quiet, the increases in the US minimum wage that began in 1990
have coincided with a renewed interest in its effects. Recent work suggests that a relative consensus
on the effects of the minimum wage on employment came undone; on balance, however, the recent
estimates seem if anything smaller than those suggested by the earlier literature, and the puzzle of
why they are relatively small remains. Effects of the minimum wage on the wage distributionbecame
clearer with the declining real minimum wage in the 1980s; nevertheless, the ability of minimum
wages to equalize the distribution of family incomes remains quite limited. © 1999 Elsevier Science
B.V. All rights reserved.
JEL codes: J38; J23; D31; D33
1. I n t r o d u c t i o n
The effects of the m i n i m u m wage on employment and the distribution of income have
been hotly debated policy questions for over 50 years. By the early 1980s, research on the
effects of the m i n i m u m wage in the US began to show signs of consensus (Eccles and
Freeman, 1982) - relatively modest effects of the m i n i m u m wage on employment (of
teenagers who were most likely to be directly affected), and on the distribution of income
(because many m i n i m u m wage workers were members of middle-income families). It was
tempting to conclude, to borrow Henry Kissinger's analysis of academic politics, that the
m i n i m u m wage debate was so spirited because the stakes were so low. Recent research has
suggested the employment effects might be larger, or non-existent, at least for increases
over the observed range. Other research has asked whether the growing inequality in the
distribution of adult wages has strengthened the link between m i n i m u m wages and distributional objectives. The purpose of this chapter is to evaluate the evidence, old and
especially new, on these topics. The main focus is on the US experience; m i n i m u m
Ch. 32: Minimum Wages, Employment and the Distribution of Income
2103
wages elsewhere are often intertwined with other institutions, such as unemployment
transfers and collective bargaining (Dolado et al., 1997) and this complicates both the
analysis of such laws and a proper evaluation of those analyses.
The next section reviews the theory that links minimum wage increases to employment;
Section 3 describes historical patterns in the level of the minimum wage and of expanding
coverage; the next five sections discuss empirical research on the effects of the minimum
wage on employment and other employment-related outcomes. Next, we turn to the
literature on the minimum wage and the distribution of wages and of income. Finally,
we offer some tentative conclusions and attempt to identify themes for future work.
2. T h e o r y
2.1. Basics
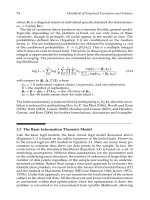
The simplest model of the effects of the minimum wage is one with complete coverage,
homogeneous labor, and a competitive labor market. Instead of the familiar equilibrium
where the demand for labor D(w) is equal to the supply of labor S(w) at equilibrium wage
w* and employment E*, a binding minimum wage (Wm > w*) leads to demand-determined employment Em = D(wm) and an excess supply of labor S(wm) - D(w m) (Fig. 1).
Since we are simply moving back along the demand curve, the employment loss ln(Em) ln(E*) depends only on the elasticity of demand for labor and the gap between the minimum wage and the competitive wage, ln(wm) - ln(w*).
Whether this excess supply of workers is counted as unemployed or as "discouraged"
workers depends on whether they report searching (unsuccessfully) for work, so one needs
further assumptions about labor force participation (in the presence of unemployment) to
say much about the effects on unemployment. One plausible assumption is that workers
decide whether to participate in the labor force based on the probability of being employed
(O(wm)[S(wm))and the wage if successful (w,n), perhaps on their product, the expected
wage. 1
The increase in measured unemployment seems a poor indicator of the costs of the
minimum wage; the effect on unemployment will be small if workers are easily discouraged and withdraw from the labor force. In fact, Mincer (1976) and Wessels (1980) model
labor force participation as a function of the expected reward from participating; declining
labor force participation (which would minimize "unemployment effects") signals that the
minimum wage has made participation less attractive.
Fig. 1 serves as a general guide to both the short- and longterm effects of a minimum
wage, but the presumption is that demand is more elastic in the long run, as substitution of
other factors for the more expensive labor becomes possible.
1Both Gramlich (1976) and Mincer (1976) make this sort of assumption, although in the context of more
complicated two-sectormodels.
2104
C. B r o w n
W
Wm
W* .
. . . . . . .
I
-I- . . . .
\/
',
I
I
I
I
I
I
I
B
Em
I
I
E*
S(Wm)
Fig. 1. Minimum wage with complete coverage.
2.2. T w o - s e c t o r models
Historically, minimum wage laws in the US have not applied to all employers, with
exemptions based on industry and size. As discussed in more detail in Section 3, coverage
of the law has expanded gradually. Compliance with the law is not perfect; Ashenfelter
and Smith (1979) argue non-compliance is important, and this increases the de facto size
of the uncovered sector. Given that time series analyses have used data from periods with
different levels of coverage, it is helpful to ask how our conclusions change under partial
coverage. It will turn out that an uncovered sector may dilute but not eliminate the
negative effects of the minimum wage on employment.
Demand for labor in the covered sector D~(wm) depends on the minimum wage; demand
for labor in the uncovered sector DU(w,) depends on the (market-determined) wage in that
sector. In the absence of a minimum wage, workers earn w* in both sectors, and
S(w*) = DC(w*) + DU(w*).
For simplicity, normalize employment so that E* = 1, and wages so that w* = 1. Then
DC(w *) is equal to c,,the fraction of the market employed by covered employers prior to the
minimum wage, and DU(w *) = 1 - c.
Modeling supply is more difficult once the minimum wage is introduced, however, since
there are two different wages that might influence supply, and not all those willing to work
at the higher of these wages will be able to find work.
Welch (1976) assumes that the De(win) available positions in the covered sector are
allocated randomly among the S(Wm) workers willing to work at the minimum wage; f =
DC(wm)/S(wm) is the probability that each will succeed. Because wm > w*, f < c. The
uncovered-sector wage wu then equates the supply of workers willing to work at that wage
who have not already been hired in the covered sector with uncovered-sector demand; i.e.,
(1 - f ) S ( w u ) = D u(wu).
Ch.
2105
32: Minimum Wages, Employment and the Distribution ~?fIncome
W
S(Wu)-oe(wm)(Wm/Wu)
S(wu)-DC(w
*)
Wu i _ ~ u ) DC(wm)[S(Wu)/S(wm)l
w~u
Wu~
I
=
Elu E~ E 2
E
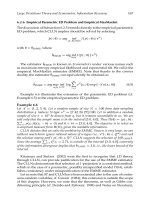
Fig. 2. Minimum wage with an uncovered sector.
T h i s c a n b e r e w r i t t e n as
DU(w,) = S(wu) - DC(Wm)[S(wu)/S(wm)].
N o t i c e (Fig. 2) t h a t at Wu = w*, t h e r e is e x c e s s s u p p l y ( s i n c e DC(wm) < DC(w *) a n d
S(w*)/S(wm) < 1), a n d so the w a g e i n the u n c o v e r e d s e c t o r m u s t fall (to wJ). T o t a l
e m p l o y m e n t is less t h a n e m p l o y m e n t i n the a b s e n c e o f the m i n i m u m w a g e : t h e i n c r e a s e
i n u n c o v e r e d - s e c t o r e m p l o y m e n t o n l y p a r t i a l l y offsets the loss in t h e c o v e r e d sector. 2
G r a m l i c h ( 1 9 7 6 ) a n d M i n c e r ( 1 9 7 6 ) a s s u m e t h a t w o r k e r s choose o n e s e c t o r or t h e
other, a n d i n e q u i l i b r i u m e x p e c t e d w a g e s m u s t b e the s a m e in b o t h . I n the s i m p l e s t
v e r s i o n s o f t h e i r m o d e l s 3, this m e a n s t h a t Wu = Pwm, w h e r e P , the p r o b a b i l i t y o f finding
w o r k i n t h e c o v e r e d sector, is DC(wm)/[DC(wm) + U], a n d U is t h e n u m b e r o f u n e m p l o y e d .
S i n c e r e t u r n s to p a r t i c i p a t i o n in e a c h s e c t o r are t h e s a m e , s u p p l y is a f u n c t i o n o f j u s t Wu (or,
e q u i v a l e n t l y , o f Pwm). It is t h e n e a s y to s h o w t h a t
U = DC(wm)[(Wm/Wu) - 11.
The uncovered wage must then clear the market:
DU(wu) = S(wu) - DC(wm) - U = S(wu) - DC(wm)[Wm/Wu].
I n this m o d e l , t h e w a g e i n t h e u n c o v e r e d sector m a y e i t h e r rise or fall ( a l t h o u g h i f it falls, it
d o e s so b y less t h a n o n W e l c h ' s a s s u m p t i o n s , b e c a u s e the t e r m t h a t m u l t i p l i e s D c is less
2 To see this, note that the horizontal distance between the two supply curves at w* is less than the loss of
employment in the covered sector (since some have reservation wages above w*), and the increase in employment
in the uncovered sector is less than the horizontal distance between the two supply curves at w*.
3 Gramlich allows those who choose the covered sector but do not find a job to receive unemployment benefits;
Mincer considers the possibility that new entrants to the covered sector are less likely to be employed next period
than those already employed (so that job-finding chances depend on turnover). In the simple version of the model
discussed here, unemployment benefits are ignored and there is complete turnover of jobs each period.
2106
c. Brown
than one for Welch, greater than one for Gramlich-Mincer). In Fig. 2, wu rises to Wu
2. Total
employment falls in either case, and by more than in Welch's model. 4
The Welch model assumes workers can work in the uncovered sector if they search
unsuccessfully for work at win, while the Mincer and Gramlich models assume the worker
chooses one sector or the other. The idea that workers much choose one sector or the other
seems less plausible in the US than in a developing country (where the covered sector is
urban, and the uncovered sector rural, as in Todaro (1969)). Brown, Gilroy and Kohen
(BGK) (Brown et al., 1982, p. 492) suggest a modification of the Gramlich-Mincer model
that allows those working in the uncovered sector to search for covered employment, but
with lower probability of finding covered employment than those who search for such
work full time. As the relative efficiency of search while employed in the uncovered sector
increases, both the employment loss and the increase in unemployment due to the minimum wage are reduced.
The preceding analysis assumes that the wage in the uncovered sector is flexible, and so
free to adjust to a m i n i m u m wage in the covered sector. If, on the other hand, Wm is the
federal m i n i m u m wage in a state with its own lower m i n i m u m wage for small employers
not covered by the federal law, it might be more appropriate to think of the "uncovered"
sector as those employers subject to the state m i n i m u m . In this case, Wuwould not adjust to
the imbalance between demand and supply in the uncovered sector.
The Welch and Gramlich-Mincer models present uncluttered analyses of the uncovered
sector; they abstract from capital reallocation across sectors and changes in relative prices
of covered- and uncovered-sector output. With uncovered-sector employment held fixed,
the proportional change in employment due to a change in the m i n i m u m wage is simple
and intuitive, c~TAln(wm). But once changes in uncovered-sector employment are taken
into account, neither model leads to particularly tractable functional forms for the change
in total employment (Brown et al., 1982, pp. 491-492). As a result, the empirical literature
is only loosely related to these formal models (for an exception, see Abowd and Killingsworth, 1981).
2.3. H e t e r o g e n e o u s
labor
We expect m i n i m u m wages to affect the employment of relatively unskilled workers, and
potentially to have indirect effects on those who are better paid. But even if we are not
interested in the better-paid group directly, there is no observable skill indicator that neatly
divides workers into those whose wage depends directly on the m i n i m u m wage and those
4It"Wu> w*, employmentfalls because wages in both covered and uncoveredsectors have increased, and so
less labor is demandedin each. If wu < w*, the labor force is smaller(S(wL,) < S(w*)) than before the minimum
wage, and some workers are unemployed,so that employmentS(wo) - U is less than in the absence of the
minimumwage S(w*).
5We cannot use the worker's wage directly, of course, because that wage may change when the minimum
wage does. Even without a change in Win,wages of those paid the minimumwage in one year may be very
different one year later (Smith and Vavfichek, 1992).
Ch. 32: Minimum Wages, Employment and the Distribution of Income
2107
who earn more.5 Hence in any "low-wage" group such as teenagers, high schooldropouts,
ol7fast-food workers, there will be a mixture of directly affected and better-paid workers.
In a sense, the better-paid workers are an uncovered sector, but those displaced by the
minimum wage do not have the opportunity of moving there.
An increase in the minimum wage raises the price of relatively unskilled workers, and
makes inputs that are good substitutes for such workers more attractive. Workers in lowwage groups who earn a bit more than the minimum wage often do the same tasks as their
less-skilled co-workers, and are likely to be very good substitutes for minimum wage
workers. Changes in employment for the group as a whole reflect the balance of these
losses and gains. As long as less-skilled labor is also a substitute for the composite nonlabor input, total employment will fall in response to an increase in the minimum wage. 6
But small overall employment impacts may reflect an unattractive balancing of gains by
relatively advantaged workers and losses by those directly affected (Abowd and Killingsworth, 1981, p. 144; Deere et al., 1996, p. 35; Freeman, 1996, p. 642).
As long as the minimum wage is set low enough that it affects only a small share of
employment, the effect of the minimum wage on total employment is likely to be small
and in any case swamped by other factors. Thus, it makes sense to focus on the analysis of
low-wage groups, where the proportion directly affected is larger and so the anticipated
effect on group employment is likely to be larger. This explains the dominance of teenagers as the group most studied in the empirical work. The same line of argument leads us
to expect larger (proportionate) effects on teenagers than on young adults, and larger
proportionate effects on employment of black and female teenagers than on employment
of white male teens.
While recognizing that not all workers are directly affected by the minimum wage is a
step in the right direction, a more satisfactory model would allow for a continuous distribution of worker skill. The simplest model of this type has one type of worker skill, and
each worker's wage is equal to the price of skill times the worker's endowment of skill.
Thus, in the absence of the minimum wage, the wage distribution reflects the distribution
of skill. Once a minimum wage is introduced, those whose value of marginal product is
less than Wm are no longer employed (Kosters and Welch, 1972). As fewer workers are
employed the price of skill rises, and those whose wage was just below Wmare once again
employable. As we shall see in Section 8, however, observed wage distributions are not
simply truncated at the minimum wage; while relatively few workers are paid less than Wm,
there is a pronounced spike in the wage distribution at win. Heckman and Sedlacek (1981)
and Pettengill (1981, 1984) provide more detailed models with continuous distributions of
worker ability that take account of the effect of reduction in low-skill employment on the
rest of the wage distribution. Grossman (1983) suggests that relative-wage comparisons by
workers may also lead employers to raise wages of workers ah'eady paid more than the
minimum.
6Evenif more-and less-skilled workersare perfectsubstitutes, overallemploymentfalls sinceit takes less than
one skilled worker to replace each minimum-wageworker.
2108
C. Brown
W
MCL
S
WI
Wo
Eo
E'
-E
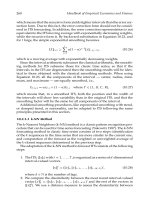
Fig. 3. Minimum wage under monopsony.
2.4. M o n o p s o n y
Although they are not, in the end, intended to believe it, undergraduate students are
exposed to the possibility that a "skillfully set" minimum wage increases employment
under monopsony.
The monopsonist faces an upward-sloping supply curve for labor, and so seeks to
maximize "rr, the difference between revenue R and labor cost:
7r = R ( L ) - w ( L ) L .
Choosing the profit maximizing level of employment yields
R ' ( L ) - w ( L ) - w ' ( L ) L = O,
which implies the marginal revenue product of labor, R ~, is equal to w(1 + I/G), where e is
the elasticity of labor supply.
A minimum wage makes the supply of labor perfectly elastic up to S(wm), and as long as
Wo
equilibrium along the marginal revenue product curve. Note, however, that even a clumsily set minimum wage can leave employment higher than in the monopsonistic equilibrium, as long as (Wm/Wo) < 1 + (I/G).
How much the wage can be raised under monopsony before employment starts to fall
thus depends on the elasticity of labor supply. The consensus view has been that the typical
minimum-wage employer is not a mining company in an isolated company town but a
retail trade or service employer in a labor market with many such employers. The elasticity
of labor supply to any one such employer should therefore be "close to" infinite, and the
Ch. 32: Minimum Wages, Employmentand the Distribution (sClncome
2109
opening for skillfully set minimum wage n e g l i g i b l e ] Moreover, as Stigler (1946) argued,
the fact that w ~varies among employers while Wm is uniform makes it less likely that most
employers affected by the law will be in the employment-enhancing range.
2.5. Search models
Card and Krueger (1995, pp. 373-379) suggest another interpretation of the monopsony
model to re-establish its relevance for actual m i n i m u m - w a g e markets. They present a
model that focuses on turnover behavior, implicitly linked to search behavior by workers
and firms. In any relatively short period, the quit rate q depends on the wage, as does the
number of workers who apply to and are hired by the firm H. Equilibrium requires that
quits ( = q(w)L) per period equal new hires, H(w). This means that equilibrium employment is equal to L = H(w)/q(w); since H / > 0 and q / < 0, if the firm wishes to increase
employment it must raise the wage. In effect, H(w)/q(w) is the labor supply function facing
the firm. The elasticity of labor supply is then OH - 0q, where OH and 0c~the elasticities of
H and q with respect to w. Empirically plausible values of these 0s yields an elasticity of
labor supply of 5-10, which suggests the range of wages over which minimum wage
increases could increase employment is not negligible. I see two problems with this
way of rescuing the monopsony model.
First, H is surely a function of L as well as of w; a large retail outlet must get more
applicants at any given wage than a morn and pop store in the same area. If we assume new
hires are equal to h(w)L, equilibrium requires that h(w) = q(w), and the firm can have any
level of employment it wants at this wage. If H = Lah(w), the elasticity of labor supply to
the firm is now (0 h - Oq)/(1 - A).
Second, H (or h) and q depend on alternative wages as well as the wage offered by the
firm. The elasticity derived in the previous paragraphs shows how supply changes if the
firm increases its wage, alternative wages constant. An increase in the minimum wage,
however, increases wages elsewhere. With complete coverage, an increase in the minim u m wage increases wages at a covered firm and elsewhere ( = other covered firms) in the
same proportion, and so does little or nothing to increase hires or reduce quits.
Burdett and Mortensen (1998) offer a more formal search model in which search frictions generate a monopsony-like equilibrium, and a m i n i m u m wage can increase employment. In their model, employment at any one firm depends explicitly on the wage
distribution as well as the wage offered by that firm. However, if many employers are
paying win, an individual employer has an incentive to pay a slightly higher wage (profit
per worker is slightly lower but equilibrium employment significantly higher). Hence, the
spike in the observed wage distribution we observe at the m i n i m u m wage (Section 8) is not
7 Rebitzer and Taylor (1995) present an efficiency-wagemodel in which the wage each firm must pay to deter
shirking is an increasing function of firm size. This creates an upward-slopingwage-employment relationship that
functions like the upward sloping marginal labor cost function of a traditional monopsony model, but "works"
with a large number of employers.
2110
c. Brown
consistent with the model. 8 And, with heterogeneous workers and employers, Stigler's
doubts about the ability of a uniform minimum wage to raise employment carry over to
search models as well. 9
2.6. Offsets
Thus far, we have implicitly assumed that if the m i n i m u m wage increases by 10%, both
compensation per hour to minimum-wage workers and cost per hour of minimum-wage
labor to the employer increase by 10% as well. However, this need not be the case. Just as
mandated improvements in non-wage aspects of a j o b (health insurance, safety, layoff
notification) m a y lead to lower wages, mandated improvements in the wage give employers an incentive to cut other aspects of the job package. A number of such margins have
been suggested-fiinge benefits, employer-provided training, and required levels of effort
(Wessels, 1980; Mincer, 1984).
To fix ideas, imagine that employers pay $5 per hour and provide "free" food that costs
$0.50 (per hour worked) to provide and is valued by workers at $0.50 per hour as well.
Then a $5.50 minimum wage would lead employers to end the free meals, leaving their
cost of labor, the compensation received by workers, and employment unaffected. Alternatively, if the $0.50 of food is valued by workers at $1.00, eliminating the free food would
reduce compensation, and so make it impossible for the employer to maintain the old level
of employment; in this case, the free food would be curtailed but not eliminated. With
higher labor costs, employers would employ fewer workers; with compensation as seen by
workers reduced, less labor would be supplied.
F r o m this perspective, the availability of offsets reduces the attractiveness of minimum
wage increases to the workers who are directly affected, but limits the employment loss as
well. If, however, employers respond by raising the effort standard they require on the job,
employment effects may be magnified rather than mitigated. Suppose, for example, a 10%
increase in the minimum wage is offset by a 10% increase in enforced effort. Then
employment in efficiency units is not changed, but employment in bodies or in hours
worked would be reduced by 10%.
More generally, the algebra of effort is discouraging. Suppose that we measure labor in
efficiency units, defined as number of workers (or hours) L times effort e. Demand for such
efficiency units will depend on the cost per unit of effort; a constant-elasticity relationship
would be
8Joseph Altonji has noted that the ability of a tiny wage increase to lead to a large increase in employment
depends on all employers being equally attractive to workers. If workers care about some non-wage attribute that
differs for each worker-employer pair (e.g., commuting costs), tiny wage increases would not bring large
increases in employment, and so would not undo the mass point at the minimum wage. I have not found a
paper that explicitly models this intuition.
9Koning et al. (1995) model both the wage distribution and unemployment durations in an explicit equilibrium
search framework. They find small reductions in search unemployment but large increases in structural unemployment due to minimum wage increases for Dutch youth. They do not discuss the spike at the minimum wage,
although it appears from their wage histograms that it is not very important in their data.
Cb. 32: Minimum Wages, Employment and the Distribution of Income
2111
lnL + lne = ~7(lnwm - lne),
which implies
lnL = 7/(lnwm) - (~ + DOne).
If the elasticity of e with respect to w is a, then
dlnL/dlnwm = ~ / - (~ + 1)c~ : (1 - a)~ - a.
Larger values of c~ make the employment response larger unless demand is elastic; if
demand is elastic, the minimum-wage elasticity of employment is less than 1 in absolute
value only if c~ is sufficiently larger than 1. l°
3. Evolution of m i n i m u m wage legislation in the US
In 1938, the Fair Labor Standards Act mandated a minimum wage of 25 cents per hour, or
about 40% of the average hourly earnings of production workers in manufacturing. Only
about half of production workers were covered, and low-wage sectors (agriculture, retail
trade, and services) were largely excluded.
Since then, the nominal minimum wage has been increased at irregular intervals. When
a new minimum wage becomes effective, it is typically equal to roughly 50% of average
hourly earnings of private workers (closer to 55% in the 1950s and 1960s, 40% in the
1990s) (see Table 1). Moreover, since 1961 the increases have been staggered, with about
half of the increase in the year the law was changed, and half in the following year.
Between increases in the minimum wage, inflation and real-wage growth increase average
hourly earnings by as much :as 30-40%, and so reduce the ratio of the (fixed) minimum
wage to (rising) average hourly earnings. As a result, the relative minimum wage follows a
saw-toothed pattern (Fig. 4).
Coverage expansions have been more discrete, and usually permanent. Coverage
remained essentially unchanged from 1938 until extended in 1961, 1967, and 1974 primarily in agriculture, retail trade, and services. Not only was the fraction of workers covered
expanded, but the expansions were in relatively low-wage sectors where the law was likely
to be a binding constraint. Within industries, coverage was extended based on firm or
establishment sales, with each extension sweeping in smaller and therefore lower-wage
employers in these industries. For example, at the time the $2.00 minimum wage became
effective in May 1974, only 3.7% of workers covered prior to the 1966 amendments were
earning less than $2.00; 13.4% of those first covered in 1967 and 18.0% of those first
10In Rebitzer and Taylor's (1995) efficiencywage model, workers either shirk or they do not, and in equilibrium none shirk. In a versionof their model with contimiouslyvariable effort, one might expect effortto increase
in response to the minimum wage.
2112
C. Brown
Table !
Minimum wage levels and coveragea
Effective date
Oct. 1938
Oct. 1939
Oct. 1945
Jan. 1950
Mar. 1956
Sept. 1961
Sept. 1963
Feb. 1967
Feb. 1968
May 1974
Jan. 1975
Jan. 1976
Jan. 1978
Jan. 1979
Jan. 1980
Jan. 1981
Apr. 1990
Apr. 1991
Oct. 1996
Sept. 1997
New wm ($)
0.25
0.30
0.40
0.75
1.00
1.15
1.25
1.40
1.60
2.00
2.10
2.30
2.65
2.90
3.10
3.35
3.80
4.25
4.75
5.15
w,Jahe
0.37
0.43
0.36
0.57
0.56
0.53
0.54
0.53
0.58
0.48
0.48
0.49
0.48
0.49
0.48
0.48
0.39
0.42
0.41
0.43
Since last increase
Fraction covered
Aln w~n
Aln(ahe)
Private
Government
0.18
0.29
0.63
0.29
0.14
0.08
0.1/
0.13
0.22
0.05
0.09
0.14
0.09
0.07
0.08
0.13
0.11
0.11
0.08
0.03
0.48
0.45
0.30
0.20
0.06
0.13
0.06
0.41
0.05
0.07
0.15
0.09
0.07
0.09
0.34
0.04
0.14
0.03
--0.50
-0.55
-0.55
--0.55
0.55
0.63
0.63
0.77
0.77
0.83
0.83
0.84
0.85
0.86
0.86
0.86
0.87
0.86
0
0
0
0
0
0
0
0.40
0.40
1.00
1.00
0.28
0.27
0.27
0.27
0.27
1.00
1.00
~'Notes: win]abe, ahe is average hourly earnings, private economy. For years prior to 1947, average hourly
earnings were available only for manufacturing. Private economy ahe is estimated as 0.93 times manufacturing
ahe, based on the relationship between the two series in 1947-1956. October data interpolated from annual
averages. Coverage of private workers: first available coverage ratios are for 1953; 1956, 1961, and 1963 ratios
are from 1957, 1962, and 1964 respectively; 1967 and 1968 ratios reflect minor coverage expansion in 1969 as
well. Coverage of govermnent workers was reduced by a Supreme Court decision in 1976, which was later
reversed.
c o v e r e d i n 1 9 7 4 w e r e e a r n i n g l e s s t h a n t h e n e w m i n i m u m ( U S D e p a r t m e n t o f L a b o r , 1975,
T a b l e 1). 11
C o v e r a g e of g o v e r n m e n t - s e c t o r workers was introduced by the 1966 A m e n d m e n t s and
i n c r e a s e d to c o m p l e t e c o v e r a g e in 1975. C o v e r a g e fell i n 1976, a n d r e b o u n d e d in 1985,
d u e to c h a n g i n g S u p r e m e C o u r t d e c i s i o n s .
T h e s e p a t t e r n s h a v e a n u m b e r o f i m p o r t a n t i m p l i c a t i o n s . First, w h i l e t h e m i n i m u m w a g e
r e l a t i v e to a v e r a g e h o u r l y e a r n i n g s v a r i e s s i g n i f i c a n t l y o v e r t h e p e r i o d , t h e s a w - t o o t h e d
p a t t e r n s u g g e s t s t h a t s u c h v a r i a t i o n is s h o r t - l i v e d , a n d a r a t i o n a l f o r e c a s t o f t h e m i n i m u m
u Because the minimum wage for most of the workers first covered in 1966 or 1974 was initially set at $1.90
rather than $2.00, this calculation slightly understates the extent to which recently and newly covered workers
were the most affected. For similar evidence in other years, see Peterson (1981, Tables 16 and 17).
2113
Ch. 32." Minimum Wages, Employment and the Distribution of Income
ahe
_
Wm jc
0.9
/Coverage Ratio
0.8
0.7
0.6
0.5
0.4
0.3
0.2
0.1
I
I
I
I
I
I
I
1940
1950
1960
1970
1980
1990
2000
Fig. 4. Minimum wage relative to average hourly earnings and private-sector coverage ratio.
wage over a 5- or 10-year horizon would have much less variation. Second, newly covered
establishments face a near-permanent change (with the only escape being to shrink below
the coverage threshold).
4. Time series evidence
4.1. O v e r v i e w
Given that federal law imposes the same minimum wage on high- and low-wage states,
and that state minimum wage laws have historically been relatively unimportant, it is not
surprising that time series variation in minimum wages and employment have been an
important source of evidence on the employment effects of the minimum wage. Perhaps
more surprising is that while the general trend in labor economics has been away from
time-series data to cross-sectional or panel-data studies (Stafford, 1986), the time series
evidence has, until quite recently, retained its primacy in the minimum wage debates.
The basic statistical model in the time series literature is
E t = text + ~ M W t + el,
where E is the employment/population ratio, X is a cyclical indicator, often a time trend,
2114
C. Brown
plus other relevant control variables, and M W is the level of the minimum wage, usually
relative to average wage (usually multiplied by the fraction of employment covered by the
minimum, the so-called Kaitz index, following Kaitz, 1970). 12
Most studies focus on teenagers because a sizeable minority of teenagers' wages are
directly affected by the minimum wage; for older groups plausible variation in employment due to the minimum wage is swamped by other factors. Given this focus on young
workers, the "other" control variables have tended to have a youth-oriented focus as well:
the relative share of teenagers in the labor-force age population, the fraction of teenagers
in the armed forces (and so unavailable for civilian employment, the traditional employment measure), the fraction of teenagers (16-19 year olds) who are 16-17, etc.
E and M W are often replaced by their logarithms, in which case 13 is an elasticity. But it
is not a " d e m a n d elasticity" of the usual sort. With a double-log specification, we have
= (AlnE)/(Alnwm).
If we define E* as the employment of those directly affected by the minimum wage
increase and w* as the average wage of those directly affected, then a natural measure
of the elasticity of demand for low-wage labor would be
~ / = (AlnE*)/(Alnw*).
As noted above, only a subset of teenagers (or members of any other low-wage group) are
directly affected; if employment of those not directly affected does not change (or
increases, because they are substitutes for those in E*), Aln E will be significantly smaller
(in absolute value) than Aln E* (Gramlich, 1976, p. 260).
Moreover, when the m i n i m u m wage is increased by 10%, many teenagers receive no
increase at all. Card and Krueger (1995, p. 117) report that in 1989 two-thirds of all
employed teenagers were already earning more than $3.80 (the level to which the minim u m wage was raised in April of 1990), and half were already earning more than $4.25,
the 1991 minimum. Some of those already earning more than the new minimum received
small increases, but some of those below the m i n i m u m wage work in uncovered jobs (or
for non-compliant employers). On balance, between 1989 and 1992 (when the m i n i m u m
wage increased by 27%), the average wage of teenagers increased only 9% (Card and
Krueger, 1995, p. 121); Deere et al. (1996, p. 31 ) estimate that in March 1990 the increase
required to bring teenagers up to the $4.25 minimum of April 1991 was only 4%. 13 Thus,
Alnw* is significantly smaller in absolute value than Alnwm.
J2Often when coverage was extended, the minimum wage for newly covered employers was lower than the
"regular" minimum wage, and Kaitz's index took account of that difference. His index was equal to
Y i Ci(Wm/Wi) + C~(W~m/Wi)), where ci is the fraction of employment in industry i covered previously, c(i is the
fraction of employment that is newly covered, wl is the average wage in industry i, and wm and W~mare the
minimum wage applicable to previously and newly covered employers.
~3Difference in base period and Card and Krueger's inclusion of 1992 wage growth account for part of the
difference, l suspect most of the rest is due to "spillovers" - wage increases to teens already earning more than
$4.25 are included in Card and Krueger's measure, but not in Deere et al.'s.
Ch. 32: Minimum Wages, Employment and the Distribution of lncome
2115
Because the numerator of 13 is smaller (in abSolute value) than the numerator of r/,
> I/3 I. Neumark and Wascher (1997) estimate
while the denominator of/3 is larger,
that among those 16-24 in 1995, 21.3% earned at least the $4.25 m i n i m u m wage in force
at the time but less than the September 1997 m i n i m u m wage of $5.15; because many of
them were already earning more than $4.25, w* increased by only 10.8%, even though
Wm was increasing by 21.2%. If only the employment of those initially earning between
$4.25 and $5.15 was affected by the 1996-1997 increases that brought Wm to $5.15, we
have
~-/3(0.212/0.108)/0.213 = 9.2/3.
Implicitly, Neumark and Wascher take the 4.3% of youth whose reported wage was
below $4.25 as unaffected by the law. Given that their wage data come from CPS data
reports which have some random reporting error and appear to have many responses
rounded to even-dollar amounts, it is not clear that someone reported to earn $4.00 is
unaffected by the law. Even if they really represent employment at establishments that
are uncovered by or not compliant with the law, their wages may be affected. 14
Most studies of young workers focus on teenagers. For them, the share directly affected
is larger, and the fraction of those directly affected who were at or below the old m i n i m u m
(and so receiving the full increase in the m i n i m u m ) is probably larger as well. A rough
calculation based on Card and Krueger's tabulations of teenage wages surrounding the
1990-1991 increase suggests - assuming those below the old m i n i m u m wage are unaffected - that ~7 ~ 5/3-15 The time series evidence is mostly drawn from the 1960s and
1970s, when the m i n i m u m wage had more bite on the wage distribution, so the appropriate
multiplier for time series studies of teenagers is probably less than 5.
Estimates of/3 re-scaled as the proportional change in employment from a 10% increase
in the m i n i m u m wage (coverage constant) are presented in Table 2.
Brown et al. (1982) summarized the studies available at that time, either published or in
draft. W e noted that the estimated reductions in teen employment from a 10% m i n i m u m
wage increase ranged from 1 to 3%, and the estimates were generally "significant"
statistically. 16 W e did not have much luck in finding one or two key choices that would
explain why some studies' estimates were higher than others. Studies which included
"more recent" (i.e., 1970s) data, included more control variables (some early studies
~4See Section8 for evidencethat uncovered-sectoremployersoftenpay exactlythe minimumwage. To gauge
the importanceof those below $4.25 for the calculation,assume that they get the same 21.2% increase as those
initially earning $4.25. Then ~ --/3(0.212/0.126)/0.266= 6.3/3.
t,sThe minimumwage increasedfrom $3.35 to $4.25, a 27% increase. Based on Card and Krueger's Fig. 4.2,
roughly 40% of teens earned between $3.35 and $4.24 prior to the increase, and average wages in this interval
were about $3.75, so the average wage increase of those directly affected was about half of the minimumwage
increase.
16Many of the studies reported separate regressions by race and/or sex and the estimates in the table are
weighted averages of those dis-aggregated results.
2116
C. Brown
Table 2
Estimated effect of a 10% increase in the minimum wage on teenage employment and unemployment: time-series studies ~
Study
Percent
change in
teenage
employment
Change in teen
unemployment rate (in
percentage points)
Kaitz (1970)
Adie (1971)
Moore (1971)
Kosters and Welch (1972)
Lovell (1972)
Adie (1973)
Lovell (1973)
Kelly (1975)
Gramlich (1976)
Kelly (1976)
Hashhnoto and Mincer (1970);
Mincer (1976)
Welch (1976)
Ragan (1977)
Mattila (1978)
Iden (1980)
Abowd and Killingsworth (1981)
Betsey and Dunson (1981)
Boschen and Grossman (1981)
Hamermesh (1981)
Ragan (1981)
Freeman (1982)
Wachter and Kim (1982)
Brown et al. (1983)
Solon (1990)
Wellington (1991)
Klerman (1992)
Card and Krueger (1995)
-0.98
-0.01
2.53
3.65
2.96
--0.00
0.52
-0.25
1.20
-0.94
-0.66
- 2.31
- 1.78
0.65
-0.84
-2.26
-2.13
1.39
-1.50
1.21
0.52
-2.46
-2.52
-1.14
0.99
- 0.63
-0.52
-0.72
0.45
0.75
0.10
0.00
0.51
0.01
~'Source: Brown et al. (1982), updated by author.
d i d n o t e v e n i n c l u d e t i m e trends), a n d i n c l u d e d c o v e r a g e i n the m i n i m u m - w a g e v a r i a b l e
t e n d e d t o w a r d t h e l o w e n d o f t h a t range. T h e s e e m e r g e d as o u r p r e f e r r e d e s t i m a t e s .
M o r e r e c e n t studies (the last t h r e e in T a b l e 2) find p o i n t e s t i m a t e s o f the loss o f t e e n
e m p l o y m e n t f r o m a 10% m i n i m u m w a g e i n c r e a s e t h a t w e r e u n i f o r m l y s m a l l e r t h a n 1%,
a n d in s o m e c a s e s n o t statistically s i g n i f i c a n t at c o n v e n t i o n a l levels. B e c a u s e t h e s e studies
r e p l i c a t e d e a r l i e r s p e c i f i c a t i o n s t a k i n g a d v a n t a g e o f a d d i t i o n a l y e a r s o f data, t h e i r c l e a r
m e s s a g e is t h a t i n c l u d i n g t h e 1980s r e d u c e s t h e e s t i m a t e d effect o f t h e m i n i m u m w a g e o n
employment.