Phương pháp chẩn đoán hình ảnh medical image analysis methods (phần 8)
Bạn đang xem bản rút gọn của tài liệu. Xem và tải ngay bản đầy đủ của tài liệu tại đây (3.32 MB, 25 trang )
2089_book.fm copy Page 315 Monday, May 16, 2005 11:41 AM
8
A MRF-Based Approach
for the Measurement
of Skin Thickness in
Mammography
Antonis Katartzis, Hichem Sahli, Jan Cornelis,
Lena Costaridou, and George Panayiotakis
CONTENTS
8.1
8.2
Introduction
Background
8.2.1 MRF Labeling
8.2.2 MRF-Based Mammographic Image Analysis
8.3 Data and Scene Model
8.3.1 Image Acquisition
8.3.2 Radiographic and Geometrical Properties of the Skin
8.4 Estimation and Extraction Methods
8.4.1 Skin Feature Estimation
8.4.1.1 External Border of the Skin
8.4.1.2 Exclusion of the Region of the Nipple Estimation
of the Normals to the Breast Border
8.4.1.3 Estimation of Gradient Orientation
8.4.2 Skin-Region Extraction — MRF Framework
8.4.2.1 Selection of a Region of Interest
8.4.2.2 Markovian Skin Model Labeling Scheme
8.5 Results
8.5.1 Measurement of Skin Thickness
8.5.2 Clinical Evaluation
8.6 Conclusions
References
8.1 INTRODUCTION
Breast skin changes are considered by physicians as an additional sign of breast
pathology. They can be divided into two major categories, namely skin retraction
Copyright 2005 by Taylor & Francis Group, LLC
2089_book.fm copy Page 316 Monday, May 16, 2005 11:41 AM
316
Medical Image Analysis
and localized or generalized skin thickening, which can be either benign or malignant. The skin can attain a thickness of 10 to 20 times normal before it can be
perceived as abnormal by palpation [1, 2]. Both retraction and thickening may be
evident mammographically before they can be clinically detected. The existing
techniques for the measurement of breast skin thickness are based on manual estimations on the mammograms, using simple measuring devices [3, 4]. Considering
the continuous evolution of computer-aided diagnostic systems, the aforementioned
manual methods appear quite obsolete. As far as time and accuracy are concerned,
the quantitative analysis of breast skin changes can be substantially improved with
a computer-assisted measurement technique.
We have developed a computerized method for the measurement of breast skin
thickness from digitized mammograms that involves a salient feature (hereinafter
denoted as a skin feature) that captures the radiographic properties of the skin region
and a dedicated Markovian model that characterizes its geometry [5]. During a first
processing stage, we apply a combination of global and local thresholding operations
for breast border extraction. The estimation of the skin feature comprises a method
for the exclusion of the region of the nipple and an estimation of the gray-level
gradient orientation, based on a multiscale wavelet decomposition of the image.
Finally, the region of the skin is identified based on two anatomical properties,
namely its shape and its relative position with respect to the surrounding mammographic structures. This a priori knowledge can be easily modeled in the form of a
Markov random field (MRF), which captures the contextual constraints of the skin
pixels. The proposed MRF model is defined on a binary set of interpretation labels
(skin, no skin), and the labeling process is carried out using a maximum a posteriori
probability (MAP) estimation rule. The method is tested on a series of mammograms
with enhanced contrast at the breast periphery, obtained by an exposure-equalization
technique during image acquisition. The results are compared with manual measurements performed on each of the films.
The chapter is organized as follows. In Section 8.2 we present the main principles
of Markov random field theory and its application to labeling problems and provide
an overview of related work on mammographic image analysis. In Section 8.3 we
describe the image-acquisition process and state the main properties of the skin as
viewed in a typical mammogram. Section 8.4 initially refers to the extraction of the
salient feature that discriminates the skin from other anatomical structures at the
breast periphery. The section concludes with a description of the proposed Markovian
model and the labeling scheme for the extraction of skin region. The validation of
our method, which includes representative results for the measurement of skin
thickness, is presented in Section 8.5. Finally, a discussion and suggested directions
for future research are given in Section 8.6.
8.2 BACKGROUND
8.2.1 MRF LABELING
The use of contextual constraints is indispensable for every complex vision system.
A scene is understood through the spatial and visual context of the objects in it; the
Copyright 2005 by Taylor & Francis Group, LLC
2089_book.fm copy Page 317 Monday, May 16, 2005 11:41 AM
A MRF-Based Approach for the Measurement of Skin Thickness
317
objects are recognized in the context of object features at a lower level representation;
the object features are identified based on the context primitives at an even lower
level; and the primitives are extracted in the context of image pixels at the lowest
level of abstraction.
Markov random field theory provides a convenient and consistent way of modeling context-dependent entities, constituting the nodes of a graph [6]. This is
achieved through characterizing mutual influences among such entities using MRF
probabilities. Theory tells us how to model the a priori probability of contextdependent patterns. A particular MRF model favors its own class of patterns by
associating them with larger probabilities than other pattern classes. Such models,
defined on regular lattices of image pixels, have been effectively used in texture
description and segmentation [7], as well as in image restoration and denoising [8,
9]. In higher levels of abstraction, MRF models are able to encode the spatial
dependencies between object features, giving rise to efficient schemes for perceptual
grouping and object recognition [10].
We will briefly review the concept of MRF defined on graphs. Let G = {S,N}
be a graph, where S = {1, 2, …, m} is a discrete set of nodes, representing either
image pixels or structures of higher abstraction levels, and N = {Ni|∀i ∈ S} is a
given neighborhood system on G. Ni is the set of all nodes in S that are neighbors
of i, such that
1. i ∈ Ni
2. if j ∈ Ni, then i ∈ Nj
Let L = {L1, L2, …, Lm} be a family of random variables defined on S, in which
each random variable Li takes a value li in a given set (the random variables Li’s can
be numeric as well as symbolic, e.g., interpretation labels). The family L is called
a MRF, with respect to the neighborhood system N, if and only if
1. P(L = l) > 0, for all realizations l of L
2. P(li|lj,∀j ≠ i) = P(li|lj), j ∈ Ni
where P(L = l) = P(L1 = l1, L2 = l2, …, Lm = lm) (abbreviated by P(l)) and P(li|lj) are
the joint and conditional probability functions, respectively. Intuitively, the MRF is
a random field with the property that the statistics at a particular node depend on
that of its neighbors.
An important feature of the MRF model defined above is that its joint probability
density function has a general functional form, known as Gibbs distribution, that is
defined based on the concept of cliques. A clique c, associated with the graph G, is
a subset of S such that it contains either a single node or several nodes that are all
neighbors of each other. If we denote the collection of all the cliques of G, with
respect to the neighborhood system N, as C(G,N), then the general form of a
realization of P(l) can be expressed as the following Gibbs distribution
P (l ) =
Copyright 2005 by Taylor & Francis Group, LLC
1 −U (l )
e
Z
(8.1)
2089_book.fm copy Page 318 Monday, May 16, 2005 11:41 AM
318
Medical Image Analysis
where U (l ) = ∑c∈C Vc ( I ) is called the Gibbs energy function and Vc(l) the clique
potential functions defined on the corresponding cliques c ∈ C(G,N). The functional
form of these potentials conveys the main properties of the Markovian model. Finally,
Z = ∑l ∈L e −U (l ) is a normalizing constant called the partition function.
In the case of a labeling problem, where L represents a set of interpretation
labels and d = {d1, …, dm} a set of physical measurements that correspond to the
realization of an observation field D on S, the most optimal labeling of the graph
G can be obtained based on a maximum a posteriori probability (MAP) criterion.
According to the Bayes rule, the posterior probability can be computed using the
following formulation
P (L = l | D = d ) =
p (D = d | L = l ) P (L = l )
p (D = d )
(8.2)
where P(L = l) is the prior probability of labeling l, p(D = d|L = l) is the conditional
probability distribution function (PDF) of the observations d, also called the likelihood function of l for d fixed, and p(D = d) is the density of d, which is constant
when d is given. In a more simplified form, Equation 8.2 can be written as
P(l|d) ∝ p(d|l)P(l)
(8.3)
By associating an energy function to p(d|l) and P(l), the posterior probability obtains
the following form
P(l|d) ∝ e−U(l|d), U(l|d) = U(d|l) + U(l)
(8.4)
Following this formulation, the optimal labeling is then accomplished via the
minimization of the posterior energy function U(l|d) [6]. The combinatorial problem
of finding the global minimum of U(l|d) is generally solved using one of the
following relaxation algorithms: (a) simulated annealing (SA) [8], or (b) iterated
conditional modes (ICM) [12].
8.2.2 MRF-BASED MAMMOGRAPHIC IMAGE ANALYSIS
Several mammographic image analysis techniques, based on MRF models, have
been proposed in the literature. These models are capable of representing explicit
knowledge of the spatial dependence between different anatomical structures and
can lead to very efficient image-segmentation schemes. The segmentation process
is performed by defining either a MRF on the original lattice of image pixels or a
cascade of MRF models on a multiresolution, pyramidal structure of the image. In
both cases, the parameter estimation of the Markovian priors is carried out either
empirically or using selected training data.
In the early work of Karssemeijer [13], a stochastic Bayesian model was used
for segmenting faint calcifications from connective-tissue structures. The method
Copyright 2005 by Taylor & Francis Group, LLC
2089_book.fm copy Page 319 Monday, May 16, 2005 11:41 AM
A MRF-Based Approach for the Measurement of Skin Thickness
319
was based on local contrast and orientation observation measures and a singleresolution MRF describing both spatial tissue dependencies and the clustering characteristics of microcalcifications. Comer et al. [14] proposed a statistical algorithm
for the segmentation of mammograms into homogeneous texture regions. In their
approach, both the mammographic image and the underlying label field (representing
a finite number of tissue classes) are modeled as discrete-parameter random fields.
The labeling is performed via a maximization of the posterior marginals (MPM)
process [11], where the unknown likelihood parameters are estimated using the
expectation-maximization (EM) algorithm.
In recent years, the need to reduce the complexity of MRF models on largeimage lattices gave rise to a series of hierarchical/multiresolution analysis methods.
Li et al. [15] developed a technique for tumor detection based on an initial segmentation using a multiresolution MRF model and a postprocessing classification step
based on fuzzy, binary decision trees. With a pyramidal image representation and a
predefined set of tissue labels, the segmentation is carried out in a top-down fashion,
starting from the lowest spatial resolution and considering the label configurations
as the realizations of a dedicated MRF. The segmentation at each resolution level
comprises a likelihood-parameter estimation step and a MAP labeling scheme using
the ICM algorithm, initialized with the result of the previous resolution. In the
approach of Zheng et al. [16], a similar hierarchical segmentation scheme is applied
on a multiresolution tower constructed with the use of the discrete wavelet transform.
At each resolution, the low-frequency subband is modeled as a MRF that represents
a discrete set of spatially dependent image-intensity levels (tissue signatures) contaminated with independent Gaussian noise. Finally, Vargas-Voracek and Floyd [17]
introduced a hierarchical MRF model for mammographic structure extraction using
both multiple spatial and intensity resolutions. The authors presented qualitative
results for the identification of the breast skin outline, the breast parenchyma, and
the mammographic image background.
All of the aforementioned labeling techniques consider the image labels (tissue
types) as being mutually exclusive, without taking into account the projective nature
of the mammographic image modality. McGarry and Deriche [18] presented a hybrid
model that describes both anatomical tissue structural information and tissue-mixture
densities, derived from the mammographic imaging process. Spatial dependencies
among anatomical structures are modeled as a MRF, whereas image observations,
which represent the mixture of several tissue components, are expressed in terms of
their linear attenuation coefficients. These two sources of information are combined
into a Bayesian framework to segment the image and extract the regions of interest.
The MRF-based method presented in this chapter falls in the scope of image
segmentation/interpretation for the identification of an anatomical structure situated
at the breast periphery (skin region). It uses (a) an observation field that encompasses
the projective, physical properties of the mammographic image modality and (b)
a MRF model, defined on the full-resolution image lattice, that describes the
geometric characteristics of the skin in relation to its neighboring anatomical
structures. The following sections present in detail the different modules of the
proposed approach.
Copyright 2005 by Taylor & Francis Group, LLC
2089_book.fm copy Page 320 Monday, May 16, 2005 11:41 AM
320
Medical Image Analysis
8.3 DATA AND SCENE MODEL
8.3.1 IMAGE ACQUISITION
In general, the effect of overexposure at the region of the film corresponding to the
breast periphery results in a poor visualization of the skin region, hampering its
identification. Contrast enhancement at the breast periphery can be accomplished
with a series of exposure or density-equalization techniques. Exposure equalization
can be performed using either anatomical filters [19, 20] or more sophisticated
techniques that modulate the entrance exposure, based on feed-back of the regional
variations in X-ray attenuation [21, 22]. The existing methods for density equalization mainly employ computer-based procedures for the matching of the optical
density between the periphery and the central part of the breast [23–27].
In our study, during the acquisition of each mammogram, we used the anatomical
filter-based exposure-equalization (AFEE) technique of Panayiotakis et al. [20]. This
technique utilizes a set of solid anatomical filters made of Polyamide 6, as this
material meets the basic requirements of approximately unit density, homogeneity,
and ease of manufacture. The anatomical filters have a semicircular band shape with
increasing thickness toward the periphery. The AFEE technique produces images of
improved contrast characteristics at the breast periphery, ensuring minimization of
the total dose to the breast through the elimination of a secondary exposure to patients
with an indication of peripheral breast lesions. Its performance has been extensively
evaluated using both clinical and phantom-based evaluation methods [28, 29].
The mammographic images used in this study were digitized using an Agfa
DuoScan digitizer (Agfa Gevaert, Belgium) at 12-bit pixel depth and a spatial
resolution of 100 µm/pixel. According to quality control measurements, this film
digitizer is suitable for mammogram digitization, as the optical-density range of the
cases used for validation falls into the linear range of its input/output response curve
[30]. Figure 8.1 shows an example from our test set of mammograms.
8.3.2 RADIOGRAPHIC
AND
GEOMETRICAL PROPERTIES
OF THE
SKIN
Our approach for breast skin thickness extraction involves the construction of a
physical model of the skin region that describes both its radiographic and geometric
properties. This model is based on the following three assumptions.
1. Anatomically, if we consider an axial section of the breast, the skin is a
thin stripe of soft tissue situated at its periphery. At its vicinity, there is
the subcutaneous fat, which radiographically is viewed as a structure with
higher optical density than the one of the skin. This anatomical information, together with the fact that mammography is a projection imaging
modality, will be the basis of our model. The region of the image that the
physicians indicate as skin does not correspond to the real one at any of
the breast sections, and it is always bigger than the skin thickness that a
histological examination might give. In fact, this virtual skin, indicated by
the physicians, is the superposition of thin stripes of soft tissue that correspond to the real skin at several axial sections of the breast (Figure 8.2).
Copyright 2005 by Taylor & Francis Group, LLC
2089_book.fm copy Page 321 Monday, May 16, 2005 11:41 AM
A MRF-Based Approach for the Measurement of Skin Thickness
321
FIGURE 8.1 Original image.
2. The shape of the skin’s external border should coincide with the shape of
the breast. Most of the time, this appears to be regular, and it can be
approximated by a circle or an ellipse. In an effort to make the shape
estimation more accurate and reliable, we will not consider the breast
border as a whole. Instead, we make the assumption that it can be divided
into smaller segments, each of them corresponding to an arc of a circle.
3. From the configuration of Figure 8.2, we can infer that the external border
of the skin in a mammographic image is mainly formed by the projection
of the central section of the breast. As we move inward, starting from the
breast periphery, we notice also the projections of the skin segments that
belong to breast sections situated above and below the central one. In the
digitized gray-level image, this results in a gradient at the periphery of
the breast (where the skin is located), oriented perpendicularly to the
breast border.
All the previously described assumptions are the main components of our model.
Their combination leads to the following conclusion:
The salient feature (skin feature) that reveals the skin layer of the breast (as this is
viewed on the mammogram) is the angle formed by the gradient vector and the normals
to the breast border. Deeper structures, underneath the skin layer, do not conform to
the previously mentioned radiographic and geometrical skin model.
Copyright 2005 by Taylor & Francis Group, LLC
2089_book.fm copy Page 322 Monday, May 16, 2005 11:41 AM
322
Medical Image Analysis
X-ray source
Breast sections
Film
FIGURE 8.2 Geometrical representation of the imaging process of the skin.
8.4 ESTIMATION AND EXTRACTION METHODS
8.4.1 SKIN FEATURE ESTIMATION
8.4.1.1 External Border of the Skin
The external border of the skin separates the breast from the surrounding background,
thus it coincides with the breast border. Several computerized schemes have been
developed for the automatic detection of the breast region. Most of them make use
of the gray-level histogram of the image. Yin et al. [31] have developed a method
to identify the breast region on the basis of a global histogram analysis. Bick et al.
[32] suggested a method based on the analysis of the local gray-value range to
classify each pixel in the image. Davies and Dance [33] used a histogram-derived
threshold in conjunction with a mode filter to exclude uniform background areas
from the image. Chen et al. [34] proposed an algorithm that detects the skin-line
edge on the basis of a combination of histogram analysis and a Laplacian edge
detector. Mendez et al. [35] used a fully automatic technique to detect the breast
border and the nipple based on the gradient of the gray-level values.
Our approach initially employs a noise-suppression median-filtering step (with
a filter size equal to five pixels), followed by an automated histogram thresholding
technique. We assume that the histogram of each mammogram exhibits a certain
bimodality: each pixel in the image belongs either to the directly exposed region
Copyright 2005 by Taylor & Francis Group, LLC
2089_book.fm copy Page 323 Monday, May 16, 2005 11:41 AM
A MRF-Based Approach for the Measurement of Skin Thickness
323
(image background) or to the potential object of interest (breast). For this purpose,
we have chosen the minimum-error thresholding technique proposed by Kittler and
Illingworth [36]. The principal idea behind this method is the minimization of a
criterion function related to the average pixel classification error rate, under the
assumption that the object and the background gray-level values are normally distributed.
Unfortunately, the presence of the anatomical filter, used for exposure equalization, disturbs the bimodality of the image histogram. A threshold selection, using
the histogram of the whole image, results in an inaccurate identification of the breast
border. More specifically, the gray values corresponding to the anatomical filter
induce a systematic error that increases the value of the threshold compared with
the optimal one. The size of the resulting binary region will always be smaller than
the real size of the breast.
To overcome this problem, we try to combine both local and global information.
Initially, an approximation of the breast’s border is estimated by performing a global
thresholding on the histogram of the whole image using the method of Kittler and
Illingworth. After thresholding, the breast border is extracted by using a morphological opening operator with a square flat structuring element of size 5, followed
by a 4-point connectivity tracking algorithm. We then define overlapping square
windows along the previously estimated border, where we apply local thresholding
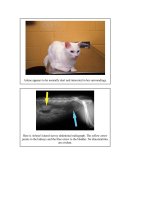
using the same approach as before (Figure 8.3). All the pixels situated outside the
union of the selected windows keep the label attributed to them by the initial global
Background
Breast
1st
Approximation
of the border
Anatomical
filter
FIGURE 8.3 Application of local thresholding for the extraction of the skin’s external border.
Copyright 2005 by Taylor & Francis Group, LLC
2089_book.fm copy Page 324 Monday, May 16, 2005 11:41 AM
324
Medical Image Analysis
FIGURE 8.4 External border of the skin.
thresholding process. The size of each window is empirically set to a physical length
of approximately 1.5 cm (150 × 150 pixels).
The histogram of each window can now be considered as bimodal, containing
only pixels from the breast and the filter. For each of them, a threshold is estimated
using the method of Kittler and Illingworth [36]. Its final value is the average between
the threshold found in the current region and the ones of its two neighbors. Because
of the overlap between neighboring windows, the resulting binary image is smooth,
with no abrupt changes in curvature. Finally, the rectified breast border is obtained
by applying, once again, a morphological opening operator with a square flat structuring element of size 5, followed by a tracking algorithm. The final result of our
approach, applied to the image of Figure 8.1, is presented in Figure 8.4.
8.4.1.2 Exclusion of the Region of the Nipple Estimation of the
Normals to the Breast Border
Based on the second assumption of our skin model (see Section 8.3.2), we can divide
the breast border into several segments with equal lengths and consider each of them
as belonging to a circular arc. The parameters of these circles (namely their radii
and the coordinates of their centers) are estimated by using the Levenberg-Marquardt
iterated method for curve fitting [37]. A χ2 merit function is defined that reflects the
agreement between the data and the model. In our case, the data are the coordinates
Copyright 2005 by Taylor & Francis Group, LLC
2089_book.fm copy Page 325 Monday, May 16, 2005 11:41 AM
A MRF-Based Approach for the Measurement of Skin Thickness
325
of the border points, and the model is a circle. The optimal solution corresponds to
the minimum of the merit function.
Unfortunately, this circular model of the breast border is disturbed by the presence of the nipple. Moreover, when the doctors examine a mammogram, they usually
search for possible skin changes along the breast border, except of the region behind
the nipple, mainly because of the presence of other anatomical structures that have
similar densities as the skin (e.g. breast areola). For these reasons, we first exclude
the region of the nipple and then work only with the remaining part of the breast
border.
Nipple detection and localization is an ongoing research topic in mammographic
image analysis [35, 38]. In our scheme, the exclusion of the nipple is performed in
three steps [5]:
1. The breast border is divided in three equal segments.
2. We choose the central border segment (nipple included) and estimate the
coordinates of the circle that corresponds to it using the method of Levenberg-Marquardt [37].
3. We consider the profile of distances between the center of the circle and
each point of the central border segment. The border points that correspond to the nipple are situated between the two most significant extrema
of the first derivative of the profile of distances.
This technique works well in practice, except for extreme cases where the nipple
is not visible in the mammogram because of possible retraction or other types of
deformation. In these cases, manual intervention is needed.
The removal of the nipple allows an efficient fitting of circular arcs to the
remaining breast border and an accurate estimation of the directions normal to it.
Experiments have shown that a number of five circles is sufficient for this purpose.
The directions normal to the breast border can be found by simply connecting every
point of each border segment to the center of the circle that corresponds to it.
8.4.1.3 Estimation of Gradient Orientation
Most of the time, the image gradient is considered as a part of the general framework
of edge detection. The basic gradient operators of Sobel, Prewitt, or Roberts [39]
are very sensitive to noise, are not flexible, and cannot respond to a variety of edges.
To cope with these types of problems, several multiscale approaches for edge
detection are proposed in the literature, such as the Gaussian scale-space approach
of Canny [40] or methods based on the wavelet transform [41, 42]. In our study, the
estimation of the multiscale gradient is performed using the wavelet approach presented by Mallat and Zhong [42], which is equivalent to the multiscale operator of
Canny. However, due to the pyramidal algorithm involved in the calculation of the
wavelet transform, its computational complexity is significantly lower than the
computational complexity of Canny’s approach. In wavelet-based gradient estimation, the length of the filters involved in the filtering operation is constant, while the
number of coefficients of the Canny filters increases as the scale increases.
Copyright 2005 by Taylor & Francis Group, LLC
2089_book.fm copy Page 326 Monday, May 16, 2005 11:41 AM
326
Medical Image Analysis
The method of Mallat and Zhong [42] is based on wavelet filters that correspond
to the horizontal and vertical components of the gradient vector. Let ƒ(x, y) ∈ L2(R2)
be a two-dimensional (2-D) function representing the image, and φ(x, y) a smoothing
function that becomes zero at infinity and whose integral over x and y is equal to
1. If we define two wavelet functions ψ1(x, y) and ψ2(x, y) such as
ψ1 =
∂φ( x, y )
∂φ( x, y )
, ψ2 =
∂x
∂y
(8.5)
then the wavelet transform of ƒ(x, y) at a scale s has two components defined by
Ws1 f ( x, y ) = f * ψ 1s ( x, y ), Ws2 f ( x, y ) = f * ψ s2 ( x, y )
(8.6)
By ψ is ( x, y ) , i = {1, 2}, we denote the dilation of ψi(x, y) by the scale factor s, so
that: ψ is ( x , y) = 1 s 2 ψ i x s , y s . Following these notations, the orientation of the
gradient vector is given in Equation 8.7.
( ) (
)
As f ( x, y ) = arg[Ws1 f ( x, y ) + iWs2 f ( x, y )]
(8.7)
In the case of a discrete 2-D signal, the previously described wavelet model does
not keep a continuous scale parameter s. Instead, it takes the form of a discrete
dyadic wavelet transform, which imposes the scale to vary only along the dyadic
sequence 2j, j ∈ Z. When we pass from the finest scale (j = 1) to coarser ones (j >
1), the signal-to-noise ratio in the image is increased. This results in the elimination
of random and spurious responses related to the presence of noise. On the other
hand, as the scale increases, the gradient computation becomes less sensitive to small
variations of the gray-level values, resulting in a low precision of edge localization
and blurring of the image boundaries. The selection of the optimal scale depends
on the spatial resolution of the digitized mammograms. For our images (spatial
resolution of 100 µm/pixel), we found that the third decomposition scale (j = 3)
gives a good approximation of the image gradient, as far as our region of interest
is concerned (breast periphery). An empirical study showed that the second and the
fourth scale of the wavelet decomposition are optimal for mammograms digitized
with 200 µm/pixel and 50 µm/pixel, respectively. In our application, the wavelet
decomposition and the estimation of the gradient orientation (Equation 8.7) were
performed using the Wave2 source code [43] developed by Mallat and Zhong [42].
By knowing the gradient orientation and the normals to the breast border, we
can produce a transformed image that represents the values of our skin feature and
highlights the region of the skin. At each point of the original image, the skin feature
(as this is defined in Section 8.3.2) can be derived by estimating the angular difference between the gradient vector and the normals to the breast border. Figure 8.5
shows the transformed image that represents the estimated angular difference for
the example of Figure 8.1, where black represents a difference of zero degrees and
white a difference of 180°. The dark stripe along the breast periphery corresponds
to the region of the skin. Note that the middle part of the image, where the nipple
is situated, has been removed.
Copyright 2005 by Taylor & Francis Group, LLC
2089_book.fm copy Page 327 Monday, May 16, 2005 11:41 AM
A MRF-Based Approach for the Measurement of Skin Thickness
327
FIGURE 8.5 Spatial distribution of the skin feature throughout the whole image.
8.4.2 SKIN-REGION EXTRACTION — MRF FRAMEWORK
The knowledge of the spatial distribution of the skin feature (Figure 8.5) is the
starting point for the identification of the skin. This is carried out with a labeling
process based on a Markovian skin model. The following two subsections present
the basic principles of our labeling process.
8.4.2.1 Selection of a Region of Interest
To reduce the computational burden of the labeling algorithm, we extract a region
of interest (ROI), situated at the breast periphery, containing the skin and a part of
the inner structures of the breast. The ROI is a stripe with length equal to the length
of the breast border. Its width is approximately 3 cm and corresponds to the maximum of the clinically observed thicknesses for the region that contains the skin and
the subcutaneous fat. Figure 8.6(a) shows an example of our region of interest,
situated at the lower part of Figure 8.5. After the extraction of the ROI, we perform
a transformation of the coordinates of its pixels to facilitate the skin identification
process. Let Ny be the number of pixels that corresponds to the width of our ROI,
and Nx the number of pixels of the breast border. The result of the spatial transformation is a Nx × Ny array with the following properties:
Copyright 2005 by Taylor & Francis Group, LLC
2089_book.fm copy Page 328 Monday, May 16, 2005 11:41 AM
328
Medical Image Analysis
(a)
(b)
FIGURE 8.6 (a) ROI corresponding to the lower part of Figure 8.5. (b) Stretched version of
the selected ROI (array A).
•
•
•
The first row represents the Nx pixels of the skin’s external border.
The following rows correspond to the Ny layers of pixels, situated behind
the skin, toward the breast parenchyma.
Every column contains the Ny pixels found by scanning the ROI along a
line perpendicular to the breast border.
The resulting array (denoted by A) can be considered as a stretched version of
our ROI (Figure 8.6(b)).
8.4.2.2 Markovian Skin Model Labeling Scheme
We consider the image formed by the array A of Figure 8.6(b) and represent its
rectangular lattice as a graph G = {S, N}, where S = {1, 2, …, m} is the discrete
set of pixels and N a particular neighborhood system. At each node i we associate
an observation measure di that represents the value of the skin feature at the current
Copyright 2005 by Taylor & Francis Group, LLC
2089_book.fm copy Page 329 Monday, May 16, 2005 11:41 AM
A MRF-Based Approach for the Measurement of Skin Thickness
329
position, and a binary label li, where li = 1 if i belongs to the skin and li = 0 otherwise.
Every configuration of the labels l = {l1, …, lm} is considered as the realization of
a Markov random field denoted by L = {L1, …, Lm}. Following a MAP estimation
criterion, as described in Section 8.2.1, the optimal labeling of G is found by
minimizing the posterior energy function U(l|d) (see Equation 8.4).
In our application, the conditional energy term U(l|d) associates a Gaussian
distribution to the observations of skin and no-skin classes. The prior energy U(l)
is expressed in terms of clique potential functions that describe contextual dependencies between the labels. The selection of the neighborhood system and the
potential functions are driven by our a priori knowledge about the geometrical
characteristics of the skin region. The following three subsections describe the
explicit form of U(l|d) and the optimization procedure for its minimization.
8.4.2.2.1 Conditional Probability Distribution
We assume that each observation di is only conditioned by the corresponding label
li, and that the dependencies between the different observations are exclusively
determined by the dependencies between the labels li. In this case, the conditional
probability distribution p(d|l) can be defined as
m
p(d | l ) =
∏ p(d | l ) ∝ e
i
−U ( d |l )
(8.8)
i
i =1
This type of probability density function can be deduced from the observation
field d and reflects the likelihood of every pixel as either belonging or not belonging
to the skin. We assume that the observation values d of both skin and no-skin regions
are normally distributed. This implies that
p(di | li ) =
1
2π σ li
−
e
( di − µ li )2
2 σ l2
(8.9)
i
where µ li and σ li are the mean value and standard deviation of the class designated
by li. From Equation 8.8 and Equation 8.9, we obtain the following expression for
the conditional energy term U(d|l):
m
U (d | l ) =
∑
i =1
(d − µ ) 2
1
i
li
− log
2
2
2σ li
2πσ li
(8.10)
The mean value and standard deviation of the skin (li = 1) and no-skin (li = 0)
classes (µ1, σ1 and µ0, σ0, respectively) can be estimated using the skin-feature values
at the first and last row of the array A, respectively, as both are good representatives
of the two classes.
Copyright 2005 by Taylor & Francis Group, LLC
2089_book.fm copy Page 330 Monday, May 16, 2005 11:41 AM
330
Medical Image Analysis
8.4.2.2.2 Prior Probability of Labelings
Our a priori knowledge about the geometrical characteristics of the skin generates
the following two assumptions:
1. A pixel i belongs to the skin if:
• All pixels between i and the external border of the skin (outer layer of
our ROI), situated on the same perpendicular to the border line as i,
also belong to the skin.
• There are neighboring pixels, situated at the same breast layer as i,
belonging to the skin.
2. A pixel i does not belong to the skin if:
• All pixels between i and the inner layer of our ROI, situated on the
same perpendicular to the border line as i, do not belong to the skin.
• There are neighboring pixels, situated at the same breast layer as i,
that do not belong to the skin.
To express these contextual dependencies, we define a neighborhood system N =
{Ni|∀i ∈ S}, where the neighbors Ni of a pixel i are all the pixels, except of i,
situated in the same column of the array A, together with its V closest horizontal
neighbors (V/2 at each side). The parameter V can be considered as a quantization
factor that depends on the resolution of the digitized mammograms and represents
the minimum expected length along the skin, where no variations of its thickness
are present.
If we consider only pairwise cliques of the form c(i, j), ∀j ∈ Ni, the prior
probability of labelings P(l) can be expressed in terms of a prior energy function
U(l) and a set of clique potentials Vc(li, lj)
P (l ) ∝ e −U (l ) , U (l ) =
∑ ∑ V (l l )
c
i j
(8.11)
i∈S j ∈N i
where Vc(li, lj) is a clique potential function associated with each clique c(i, j). For
each pixel i (with coordinates (xi, yi)) the clique potential Vc(li, lj) depends on the
label li and on the relative position of its neighbor j (with coordinates (xj, yj)). In
particular, the potential function has the following form:
aij , if li = 1, y j ≤ yi
0, if li = 1, y j > yi
Vc (li , l j ) =
0, if li = 0, y j < yi
aij , if li = 0, y j ≥ yi
where
Copyright 2005 by Taylor & Francis Group, LLC
(8.12)
2089_book.fm copy Page 331 Monday, May 16, 2005 11:41 AM
A MRF-Based Approach for the Measurement of Skin Thickness
331
0, if li = l j
aij =
w > 0, otherwise
(8.13)
These types of potential functions penalize inconsistent configurations of labels
with respect to the assumptions 1 and 2. High values of the penalization factor w
favor more uniform representations of the skin region but at the same time suppress
small variations of the skin thickness. The optimal value of w should satisfy both
requirements of uniformity and accuracy.
8.4.2.2.3 MAP Estimation
From the combination of Equations 8.4, 8.10, and 8.11, the posterior probability
P(l|d) can be expressed in terms of a global energy function U(l|d), where
(d i − µ l ) 2
m
U (l | d ) =
∑
i =1
i
2σ
2
li
1
− log
2πσ li
+
∑ ∑V (l , l )
c
i ∈S
i
j
(8.14)
j∈N i
The MAP configuration of the label field is estimated by minimizing the energy
function U(l|d). For the minimization of U(l|d), we follow a simulated annealing
scheme based on a polynomial-time cooling schedule [44]. Figure 8.7 shows the
evolution of the labeling process toward the minimum energy state, using as example
the array A of Figure 8.6(b). In this particular case, the parameters V and w were
set to 20 and 2, respectively. Finally, the last step of our approach consists of the
mapping of the labeled pixels of A back to the coordinates of the original image.
8.5 RESULTS
8.5.1 MEASUREMENT
OF
SKIN THICKNESS
In our study, the measurements of the skin thickness are taken in regular intervals
along the breast border. Starting from each border point, we consider a perpendicular
to the border line segment, which extends up to the internal border of the skin. The
skin thickness at the particular border point corresponds to the length of this line
segment.
For the representation of the measurement results, we use the position of the
nipple as a reference point. We consider a polar representation of the breast border
points using the orthogonal coordinate system of Figure 8.8. The x-axis corresponds
to the image border, occupied by the largest part of the breast, and the y-axis is a
vertical line that passes through the middle of the nipple. The measurement position
of the skin thickness in a given border point P is adequately defined by the polar
coordinate θ of this particular point. Following these notations, angle θ takes values
in the interval [−90°, +90°], depending on the relative position of the measuring
point P with respect to the nipple.
Copyright 2005 by Taylor & Francis Group, LLC
2089_book.fm copy Page 332 Monday, May 16, 2005 11:41 AM
332
Medical Image Analysis
(a)
(b)
(c)
FIGURE 8.7 Energy minimization using simulated annealing. The parameters V and w are
equal to 20 and 2, respectively. (a) Temperature T = 100. (b) Temperature T = 50. (c) Final
result after convergence at temperature T = 0.01.
y
P
−
θ
+
x
FIGURE 8.8 Polar representation of the breast border points.
8.5.2 CLINICAL EVALUATION
Our approach was tested on ten different cases of mammographic images with
craniocaudal (CC) views of the breasts, two of them exhibiting advanced skin
thickening at the breast periphery. The normal range of breast skin thickness in CC
views, as reported in the survey of Pope et al. [4], is between 0.5 and 2.4 mm, with
Copyright 2005 by Taylor & Francis Group, LLC
2089_book.fm copy Page 333 Monday, May 16, 2005 11:41 AM
A MRF-Based Approach for the Measurement of Skin Thickness
333
(a)
Manual Measurements
Automatic Measurements
Skin Thickness (µm)
2500
2000
1500
1000
500
0
−87
−68
−46
−23
0
23
44
Angle θ (degrees)
63
79
(b)
FIGURE 8.9 (a) The detected skin region that corresponds to the mammogram of Figure
8.1. (b) Skin thickness along the breast border.
a standard deviation of approximately ±0.3 mm. Figure 8.1, Figure 8.10(a), and
Figure 8.11(a) present three examples of normal cases, with no severe skin changes
along the breast periphery. Figure 8.12(a) corresponds to a pathological case, with
advanced skin thickening, which is clearly visible at the upper part of the mammogram. The skin-detection results for these four examples are presented in Figure
8.9(a, b), Figure 8.10(b, c), Figure 8.11(b, c), and Figure 8.12(b, c), respectively.
Copyright 2005 by Taylor & Francis Group, LLC
2089_book.fm copy Page 334 Monday, May 16, 2005 11:41 AM
334
Medical Image Analysis
(a)
(b)
Manual Measurements
Automatic Measurements
Skin Thickness (µm)
2500
2000
1500
1000
500
0
−83
−58
−31
−4
20
44
Angle θ (degrees)
65
83
(c)
FIGURE 8.10 (a) Original image. (b) Detected skin region. (c) Skin thickness along the
breast border.
The results were obtained using the same values for the parameters V and w. Given
the resolution of our images, V has been set to a value equal to 20 pixels. The
penalization factor w in Equation 8.13 has been empirically set to 2. On the other
hand, the parameters µ li and σ li in Equation 8.10 are estimated on each image
separately, as explained in Section 8.4.2.2.
Copyright 2005 by Taylor & Francis Group, LLC
2089_book.fm copy Page 335 Monday, May 16, 2005 11:41 AM
A MRF-Based Approach for the Measurement of Skin Thickness
(a)
(b)
Manual Measurements
Automatic Measurements
3000
Skin Thickness (µm)
335
2500
2000
1500
1000
500
0
−89
−70
−46
−18
6
34
Angle θ (degrees)
56
74
(c)
FIGURE 8.11 (a) Original image. (b) Detected skin region. (c) Skin thickness along the
breast border.
The validation of our method is performed by comparing the detected skin
thickness values with the ones obtained after a manual measurement on each film
at several predefined points along the breast periphery. This process resulted in an
average root mean square (RMS) error of 0.3 mm for normal cases, reaching a
maximum value of 0.5 mm in pathological cases with skin thickening. The maximum
RMS error was observed in the case of Figure 12(a), in which the exact borders of
Copyright 2005 by Taylor & Francis Group, LLC
2089_book.fm copy Page 336 Monday, May 16, 2005 11:41 AM
336
Medical Image Analysis
Skin Thickness (µm)
(a)
(b)
9000
8000
7000
6000
5000
4000
3000
2000
1000
0
−61 −49 −37 −25 −11 3
Manual Measurements
Automatic Measurements
17 30 42 55 67 80
Angle θ (degrees)
(c)
FIGURE 8.12 (a) Original image. (b) Detected skin region. (c) Skin thickness along the
breast border.
the skin are not clearly defined because of its advanced deformation. Compared with
the normal range of breast skin thickness, the estimated errors are relatively small
and do not influence the clinical assessments.
The computational time of our approach is rather demanding, mainly because
of the optimization step (simulated annealing). Nevertheless, the optimization
scheme is stable and converges to a good approximation of the global minimum
solution, independently of the initial realization of labelings. For a 2300 × 1400
image on a Pentium III at 500 MHz, the estimation of the spatial distribution of the
skin feature lasts around 1 min, whereas the labeling process takes approximately
15 min.
Copyright 2005 by Taylor & Francis Group, LLC
2089_book.fm copy Page 337 Monday, May 16, 2005 11:41 AM
A MRF-Based Approach for the Measurement of Skin Thickness
337
8.6 CONCLUSIONS
We present a model-based method for the measurement of skin thickness in mammography and, at the same time, tackle secondary issues emerging from the solution
of this problem, like the identification of the breast border and the extraction of the
region of the nipple. The skin model is based on physical and geometrical a priori
knowledge about the skin to reveal the feature that discriminates it from the other
anatomical structures of the breast. The MRF framework is used to endow this a
priori knowledge to a labeling scheme, which identifies the skin structure. Experimental results illustrate the efficiency of our method, which produced results comparable with manual measurements performed on each film.
The estimation of the proposed saliency skin feature requires a good visualization
of the breast periphery. The employed anatomical filter for exposure equalization at
the breast periphery currently limits the application of the technique to craniocaudal
(CC) views. A potential alternative could be a digital density-equalization technique
[25–27] that allows the use of both CC and mediolateral (ML) views.
Finally, future work will involve the extension of our method toward a hierarchical/multiresolution Markovian approach. The multiresolution pyramid can be
created via the dyadically subsampled counterpart of the wavelet transform of
Section 8.4.1.3. Based on such hierarchy, the skin feature is estimated at each
resolution level separately, without the empirical choice of any particular decomposition scale, and the labeling process can be performed using a computationally
efficient top-down hierarchical scheme as presented by Li et al. [15].
REFERENCES
1. Putman, C.E. and Ravin, C.E., Textbook of Diagnostic Imaging, W. B. Saunders Co.,
1994.
2. Tabar, L. and Dean, P.B., Anatomy of the breast, in Teaching Atlas of Mammography,
2nd ed., Frommhold, W. and Thurn, P., Eds., Thieme, New York, 1985.
3. Willson, S.A., Adam, A.J., and Tucker, A.K., Patterns of breast skin thickness in
normal mammograms, Clinical Radiol., 33, 691, 1982.
4. Pope, T.L. et al., Breast skin thickness: normal range and causes of thickening shown
on film-screen mammography, J. Can. Assoc. Radiologists, 85, 365, 1984.
5. Katartzis, A. et al., A model-based technique for the measurement of skin thickness
in mammography, IEEE Medical Biological Eng. Computing, 40, 153, 2002.
6. Li, S.Z., Markov Random Field Modeling in Computer Vision, Computer Science
Workbench, Springer-Verlag, Heidelberg, 1995.
7. Derin, H. and Elliott, H., Modeling and segmentation of noisy textured images using
Gibbs random fields, IEEE Trans. Pattern Anal. Mach. Intell., 9, 39, 1987.
8. Geman, S. and Geman, D., Stochastic relaxation, Gibbs distributions, and Bayesian
restoration of images, IEEE Trans. Pattern Anal. Mach. Intell., 6, 721, 1984.
9. Pizurica, A. et al., A joint inter- and intrascale statistical model for Bayesian waveletbased image denoising, IEEE Trans. Image Processing, 11, 545, 2002.
10. Katartzis, A. et al., A model-based approach to the automatic extraction of linear
features from airborne images, IEEE Trans. Geoscience and Remote Sensing, 39,
2073, 2001.
Copyright 2005 by Taylor & Francis Group, LLC
2089_book.fm copy Page 338 Monday, May 16, 2005 11:41 AM
338
Medical Image Analysis
11. Marroquin, J., Miter, S., and Poggio, T., Probabilistic solution of ill-posed problems
in computational vision, J. Am. Stat. Assoc., 82, 76, 1987.
12. Besag, J., On the statistical analysis of dirty images, J. R. Stat. Soc. B, 48, 259, 1986.
13. Karssemeijer, N., Stochastic model for automated detection of calcifications in digital
mammograms, Image Vision Computing, 10, 370, 1992.
14. Comer, M.L., Liu, S., and Delp, E.J., Statistical segmentation of mammograms,
Digital Mammography, 72, 475, 1996.
15. Li, H.D. et al., Markov random field for tumor detection in digital mammography,
IEEE Trans. Medical Imaging, 14, 565, 1995.
16. Zheng, L. et al., Detection of cancerous masses for screening mammography using
DWT-based multiresolution Markov random field, J. Digital Imaging, 12 (Suppl. 1),
18, 1999.
17. Vargas-Voracek, R. and Floyd, C.E., Hierarchical Markov random field modeling for
mammographic structure segmentation using multiple spatial and intensity image
resolutions, SPIE Conf. Image Proc., 3661, 161, 1999.
18. McGarry, G. and Deriche, M., Mammographic image segmentation using a tissue
mixture model and Markov random fields, IEEE Int. Conf. Image Proc., 3, 416, 2000.
19. Lam, K.L. and Chan, H.P., Effects of X-ray beam equalization on mammographic
imaging, Medical Phys., 17, 242, 1990.
20. Panayiotakis, G. et al., An anatomical filter for exposure equalization in mammography, Eur. J. Radiol., 15, 15, 1992.
21. Oestmann, J.W. et al., Scanning equalization mammography preliminary evaluation,
RadioGraphics, 14, 123, 1994.
22. Sabol, J.M. and Plewes, D.B., Analytical description of the high- and low-contrast
behavior of a scan rotate geometry for equalization mammography, Medical Phys.,
23, 887, 1996.
23. Bick, U. et al., Density correction of peripheral breast tissue on digital mammograms,
RadioGraphics, 16, 1403, 1996.
24. Byng, J.W., Critten, J.P., and Yaffe, M.J., Thickness-equalization processing for mammographic images, Radiology, 203, 564, 1997.
25. Highnam, R.P., Brandy, M., and Stepstone, B.J., Mammographic image analysis, Eur.
J. Radiol., 24, 20, 1997.
26. Stefanoyiannis, A.P. et al., A digital equalization technique improving visualization
of dense mammary gland and breast periphery in mammography, Eur. J. Radiol., 45,
139, 2003.
27. Veldkamp, W.J.H. and Karssemeijer, N., Normalization of local contrast in mammograms, IEEE Trans. Medical Imaging, 19, 731, 2000.
28. Panayiotakis, G. et al., Evaluation of an anatomical filter-based exposure equalization
technique in mammography, Br. J. Radiol., 71, 1049, 1998.
29. Skiadopoulos, S. et al., A phantom-based evaluation of an exposure equalization
technique in mammography, Br. J. Radiol., 72, 997, 1999.
30. Kocsis, O. et al., A tool for designing digital test objects for module performance
evaluation in medical digital imaging, Medical Informatics, 24, 291, 1999.
31. Yin, F.F. et al., Computerized detection of masses in digital mammograms: analysis
of bilateral subtraction images, Medical Phys., 18, 955, 1991.
32. Bick, U. et al., Automated segmentation of digitized mammograms, Academic
Radiol., 2, 1, 1995.
33. Davies, D.H. and Dance, D.R., The automatic computer detection of subtle calcification in radiographically dense breasts, Phys. Med. Radiol., 37, 1385, 1992.
Copyright 2005 by Taylor & Francis Group, LLC
2089_book.fm copy Page 339 Monday, May 16, 2005 11:41 AM
A MRF-Based Approach for the Measurement of Skin Thickness
339
34. Chen, J., Flynn, M.J., and Rebner, M., Regional contrast enhancement and data
compression for digital mammographic images, Proc. Soc. Photo-Op. Instrum. Eng.,
1905, 752, 1993.
35. Mendez, A. et al., Automatic detection of breast border and nipple in digital mammograms, Comput. Methods Programs Biomed., 49, 253, 1996.
36. Kittler, J. and Illingworth, J., Minimum error thresholding, Pattern Recognition, 19,
41, 1986.
37. Press, W.H. et al., Numerical Recipes in C: the Art of Scientific Computing, 2nd ed.,
Cambridge University Press, Cambridge, U.K., 1992.
38. Chandrasekhar, R. and Attikiouzel, Y., A simple method for automatically locating
the nipple on mammograms, IEEE Trans. Medical Imaging, 16, 483, 1997.
39. Gonzalez, R.C. and Woods, R.E., Digital Image Processing, Addison-Wesley, Reading, MA, 1992.
40. Canny, J., A computational approach to edge detection, IEEE Trans. Pattern Anal.
Mach. Intell., 8, 679, 1986.
41. Costaridou, L. et al., Quantifying image quality at breast periphery vs. mammary
gland in mammography using wavelet analysis, Br. J. Radiol., 74, 913, 2001.
42. Mallat, S. and Zhong, S., Characterization of signals from multiscale edges, IEEE
Trans. Pattern Anal. Mach. Intell., 14, 710, 1992.
43. Wave2 software; available on-line at last accessed
6/10/2003.
44. Aarts, E.H.L. and Korst, J.H.M., Simulated Annealing and Boltzmann Machines, John
Wiley & Sons, New York, 1989.
Copyright 2005 by Taylor & Francis Group, LLC