Three Global Trends That Shaped Latin American and Caribbean Development at the Dawn of the TwentyFirst Century
Bạn đang xem bản rút gọn của tài liệu. Xem và tải ngay bản đầy đủ của tài liệu tại đây (2.57 MB, 32 trang )
Three Global Trends That Shaped
Latin American and Caribbean
Development at the Dawn of the
Twenty-First Century
T
he world economy is not what it used
to be 30 or even 15 years ago. For
most of the twentieth century, the
developed North dominated the global economy.1 This dominance led to the emergence
of various strands of “dependency” theory,
which found green pastures in Latin American development thinking. 2 The essence of
Latin American structuralism was pessimism: the dominance of the North, acting
as “center” to a “periphery” of developing
South countries, would be ever rising, at least
in part because of the secular trends in the
prices of exports from the South relative to
exports from the North.
The world economy has evolved in the
past several decades, rendering this central
tenet of Latin American dependency theory obsolete. Several South economies are
now part of what can be empirically characterized as the “center” of global commercial relations. This chapter documents this
empirical regularity through network analyses based on bilateral trade and financial
data that show how countries are part of
global networks. Being at the center of a
global network entails having numerous and
quantitatively important bilateral connections. It is in this (narrow) technical sense
1
that the South has arrived at the center of
the global economy with surprising speed,
especially since the dawn of the 21st century. This reconfiguration of the global
landscape suggests the need to go beyond
the static North-South paradigm toward a
dynamic center-periphery one.
This report argues that the economic
shocks emanating from the rise of South
countries as central players in global economic relations have brought significant
changes to economies in Latin America
and the Caribbean (LAC), with notable differences within the region depending on
the economic structures that each country
inherited from the twentieth century. LAC
is an increasingly globalized region, and its
economic future depends a great deal on the
extent and quality of its external connections.
It is likely that not only the incidence of international trade and financial connections but
also the nature of these international linkages
matter for its future economic growth and
for the generation of good-quality jobs. This
report therefore places significant emphasis
on the consequences of the changing nature
of LAC’s external connections, analyzing
particularly their trade, financial, macroeconomic, and labor market aspects.
41
42
THE RISE OF THE SOUTH
As a starting point for this analysis, this
chapter outlines three sets of facts related to
the rise of the South that are shaping LAC’s
economic prospects:
1. The weight of the South in the global
economy has risen, particularly after
2000, but its rise has not been even
across sectors or types of flows.
2. Several South countries are now at the
center of the global trade network, but
none is at the center of global financial
networks.
3. The structure of bilateral trade and
financial connections of the South has
been generally different from that of
the North, with geography and endowments arguably shaping their evolving
structure.
Set of Facts 1: The weight of the
South in the global economy has
risen, particularly after 2000, but
its rise has not been even across
sectors or types of flows.
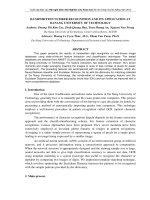
The South has been growing faster than the
North. The gross domestic product (GDP) in
current dollars of the South remained at about
20 percent of world GDP between the 1970s
and 1990s (figure 1.1, panel a). By the late
2000s, this share had doubled to 40 percent.
Moreover, the globalization of the South,
which picked up in the late 1980s and continued apace during the 1990s, accelerated
and intensified substantially in the 2000s.
The South accounted for 51 percent of global
trade flows in 2012, up from just 24 percent
in 1970 and 35 percent in 2000 (see figure
1.1, panel b). The South received less than 20
percent of global capital inflows in the 1970s
and about 26 percent in the 1990s, whereas
by the end of the 2000s it received almost
55 percent (see figure 1.1, panel c). South
countries also became more representative
as sources of capital flows, sending about 55
percent of global capital outflows between
2008 and 2012, up from 14 percent in 1990.
As of the writing of this report, the world
seems to be entering a phase that many
observers have called “the new normal,”
characterized by a slower global growth.
The second half of the 2010s is thus poised
to have different dynamics from the first
decade of the 2000s.
Despite the swiftness of these changes,
projections suggest that these patterns are not
temporary and that the South will continue
to gain space in the years to come.3 This outlook partly reflects the broad reach of the rise
of the South, a phenomenon that goes well
beyond the emergence of China as a giant in
the global economy. Indeed, these trends are
not driven by a small set of South countries;
they are observed across a vast number of
countries. During the 2000s, 69 of 164 South
countries in the sample grew faster than
the average South country, 130 more rapidly than the fastest-growing North country
(Luxembourg), and 154 more rapidly than
the average North country.
Although China is not the only South
economy behind these trends, it has played
a particularly important role. In the span
of less than 30 years, it transformed itself
from a rural, inward-looking, slow-growing
economy to a fast-growing and increasingly
urban and industrial one. Between 1978,
when economic liberalization began, and
2012, China’s economy expanded more
than 20-fold in real terms. In 1978 China’s nominal GDP represented about 1.7
percent of world GDP; by 2012 China had
become the world’s second-largest economy in terms of nominal GDP, representing
about 51 percent of the United States’ GDP
and 11.3 percent of global GDP in current
dollars. China also gained prominence in
global trade, becoming the world’s largest
exporter in absolute terms and one of the
world’s largest importers. Its rise in global
finance was more modest but also significant: China represented about 8 percent of
global capital inflows (9 percent of global
capital outflows) in 2012, up from 1 percent (1 percent) in 2000.
THREE GLOBAL TRENDS THAT SHAPED LATIN AMERICAN AND CARIBBEAN DE VELOPMENT
The rise of the South has changed
the composition of global trade flows
across sectors and between exports and
imports within sectors.
FIGURE 1.1 Rise of the South: Share of world GDP, trade,
and capital flows
a. World GDP
100
Share of world GDP (%)
90
80
70
78
60
78
60
69
74
76
50
9
40
30
20
3
2
2
4
10
20
21
21
21
5
26
31
–1
08
20
20
20
04
00
–0
2
7
3
–0
9
–9
90
19
19
19
70
80
–7
–8
9
9
0
Years
b. World trade
100
80
70
60
52
64 58
68
75 73
50
40
30
0
1
7
9
0
2
1
4
6
8
39
32 35
25 26 29
37
30 33
24 25 30
19
70
19 –79
80
19 –89
90
20 –99
00
20 –03
04
20 –07
08
–1
2
20
2
4
54
66 61
68
76 75
70
19 –79
80
19 –89
90
20 –99
00
20 –03
04
20 –07
08
–1
2
Share of world trade (%)
90
10
19
0
Imports
Exports
c. World capital flows
100
Share of world capital flows (%)
The rise of the South in the global economy
reflects not only higher growth rates in the
South than in the North but also differences
in structural features. The patterns of globalization of the North and the emerging
South differ in important ways. In particular,
there is significant heterogeneity in the sectoral composition of trade flows of the North
when contrasted with the South as well as
in the sectoral composition of trade flows
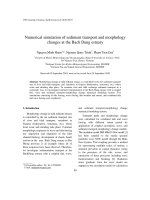
across South countries. The export baskets
of South countries typically include a larger
share of primary goods than those of North
countries (figure 1.2, panel a). Between 2000
and 2012, for example, the share of primary
goods in total goods exports was 57 percent
in Sub-Saharan Africa (SSA), 29 percent in
LAC, and just 8 percent in the North.
There are also differences in the sectoral
composition of imports of North and South
countries (see figure 1.2, panel b). The share
of primary goods in imports averaged about
10 percent in the South and 14 percent in the
North between 2000 and 2012. China in
particular and East and South Asian economies more broadly seem to be exceptions
among South economies: the composition of
their trade baskets is on average more similar to that of North countries than to other
South countries.
In light of these differences, changes
in the weight of the South in global trade,
especially during the 2000s, differed across
sectors and between exports and imports
within a given sector. The weight of the
North in global trade declined substantially
during the 2000s in both the primary (agriculture and mining) and manufacturing sectors, though rankings across sectors were
90
80
70
60
45
46
65 69
75 68 68
82 80
50
85 84 82
40
1
30
20
10
7
9
1
1
2
2
0
31 30
18 19 24
1
48
45
0 0 1 34 30
15 16 17
19
70
19 –79
80
19 –89
90
20 –99
00
20 –03
04
20 –07
08
–1
2
19
Sources: Calculations based on data from World Development Indicators
(WDI), Direction of Trade Statistics (DOTS), and Balance of Payments
Statistics (BOPS).
Note: The North includes the G-7 members and Western Europe countries.
The South includes all other economies. G-7 = Group of Seven;
GDP = gross domestic product.
a. Capital outflows exclude international reserves.
70
19 –79
80
19 –89
90
20 –99
00
20 –03
04
20 –07
08
–1
2
0
Capital inflows
South (excluding China)
Capital outflowsa
China
North
43
44
THE RISE OF THE SOUTH
broadly maintained (see figure 1.2, panels
c and d). The flipside of this trend is an
increase in the shares of the South: between
2000 and 2012, its share of global manufactures exports increased from 30 percent
to 46 percent and its share of global commodities exports rose from 62 percent to 68
percent.
There is also significant heterogeneity
within the South across both countries and
sectors.4 China is by a wide margin the most
important country behind the expansion of
the South in global exports of manufacturing: its share increased more than 10 percentage points, from slightly less than 5 percent
in 2000 to about 16 percent in 2012 (see
figure 1.2, panel c). Together the other top
20 South countries increased their share in
global manufacturing exports by no more
than 9 percentage points.5 At the same time,
the share of world manufacturing exports of
some South countries (for example, Malaysia, Mexico, and Philippines) declined.
The rise of the South in global primary
exports features a different set of countries,
with Australia, Brazil, and the Russian Federation registering the largest gains in global
shares. Among the top 20 South countries are
India, Nigeria, South Africa, and some LAC
countries (Bolivia, Chile, Colombia, Ecuador, and Peru). China experienced the largest
increase in weight on the receiving end: its
share of global imports of (agricultural and
mining) primary products rose from about 3
percent in 2000 to 14 percent in 2012 (see
figure 1.2, panel d). Several South countries
with increases in manufacturing exports,
such as India, Poland, the Republic of Korea,
and Turkey, also increased their imports of
commodities.
The rise of the South has also led to
a significant recomposition of global
financial flows across sectors and types
of flows.
The sectoral composition of global gross
financial flows (capital account–related
flows by foreign and domestic agents) for the
South and the North differ (figure 1.3). South
countries generally receive a larger share of
financial flows in the primary sector than
North countries, though there is significant
variation in the magnitude of these differences
across countries. For example, between 2003
and 2012, on average countries in Europe and
Central Asia (ECA), LAC, and SSA received
at least 50 percent of syndicated loans and
merger and acquisition (M&A) inflows in the
primary sector. The share in North countries
was about 20 percent. Foreign investments by
South countries are also tilted toward the primary sector on average. For example, between
2003 and 2012, the share of greenfield investments abroad that went to the primary sector
was much larger in LAC (44 percent) than in
the North (19 percent).
As the weight of South countries in global
financial flows changed, so did the sectoral
composition of global financial flows, especially during the 2000s. The share of global
inflows in the primary sector increased for
syndicated loans (from 25 percent to 35 percent of global flows) and for M&A (from
26 percent to 33 percent), whereas it fell
slightly for global greenfield flows (from
22 percent to 19 percent) between 2003–07
and 2008–12. There was also a recomposition of senders and receivers of global flows
across sectors (figure 1.4). The weight of
North countries as senders and receivers of
financial flows generally declined during
this period, especially in the primary sector,
where the share of North countries in global
M&A fell 23 percentage points as senders
and 21 percentage points as receivers. Conversely, the weight of the South in global
capital flows increased, though different
regions of the South gained space in different sectors and in different types of flows.
For example, countries in East Asia and
Pacific (EAP) typically increased their share
as receivers of global syndicated loan flows
in the primary sector, whereas countries in
ECA and the Middle East and North Africa
(MENA) lost global participation. LAC and
EAP countries almost tripled their global
share as receivers of M&A flows in the primary sector, whereas China and EAP countries became large senders of these flows.
THREE GLOBAL TRENDS THAT SHAPED LATIN AMERICAN AND CARIBBEAN DE VELOPMENT
FIGURE 1.2 Sectoral composition of trade flows
a. The sectoral composition of
exports across regions
b. The sectoral composition of
imports across regions
North 3 5
92
North 3 11
China 11
98
China 6
ECA 3
21
75
EAP 3 11
20
61
37
South 6 4
Asia
EAP 2 8
90
LAC 4 6
90
MENA 5 4
91
South
Asia 4
90
SSA 11
46
43
Central America 4 13
and Mexico
The Caribbean 3
90
71
MENA 2
82
24
26
0 10 20 30 40 50 60 70 80 90 100
Percent
Agriculture
SSA 3 5
92
Central America
and Mexico 4 2
94
Mining
c. The composition of global exports
across sectors and regions
91
Mining
2000 1 10 8
27
2005 1 10 13
Manufacturing
2012 1 17
22
12
Agriculture
34
12
27
7
14
28
815
EAP
64
54
South Asia
0 10 20 30 40 50 60 70 80 90 100
Percent
Manufacturing
64
2005
8 8
61
2012
14
ECA
7 7 6
11
8 8
47
7
2000 3 7 4 2 3
77
2005 6 10
70
14
523
10
58
6 14
2000 2 12 5 3 6
2005 4 13
2012 6 15
0 10 20 30 40 50 60 70 80 90 100
Percent
China
89
2000 4 9 6 7 8
2012
70
2005 10 12 6 1 5
16
32
13
2000 5 12 41 6
2012
43
19
Mining
2012 3 13
51
17
8 3
Manufacturing
Agriculture
2005 3 10
81
d. The composition of global imports
across sectors and regions
54
17
75
South
America 4 8
62
2000 3 10 6 2
21
The Caribbean 5 13
73
South 12
America
76
18
ECA 3 7
86
LAC 9
86
69
64
7 4 5
10 6
7
53
0 10 20 30 40 50 60 70 80 90 100
Percent
MENA
SSA
LAC
North
Source: Calculations based on data from Comtrade.
Note: Panels a and b show the average sectoral composition of exports and imports between 2000 and 2012 across regions. The sectoral classification of trade flows is based on the International Standard Industrial Classification (ISIC) grouping, Revision 3. Agriculture corresponds to ISIC codes
0111–0500, mining to ISIC codes 1010–1429, and manufacturing to ISIC codes 1511–3699. The North includes the Group of 7 (G-7) members and
Western Europe countries. EAP = East Asia and Pacific; ECA = Europe and Central Asia; LAC = Latin America and the Caribbean; MENA = Middle East
and North Africa; SSA = Sub-Saharan Africa.
45
46
THE RISE OF THE SOUTH
FIGURE 1.3 Sectoral composition of financial flows across regions
a. Syndicated loans
by sender region
by receiver region
North
North
China
China
ECA
ECA
EAP
EAP
LAC
LAC
MENA
MENA
South Asia
South Asia
SSA
Central America
and Mexico
The Caribbean
SSA
Central America
and Mexico
The Caribbean
South America
South America
0
10
20
30
40
50 60
Percent
70
80
90 100
0
10
20
30
40
50 60
Percent
70
80
90 100
70
80
90 100
70
80
90 100
b. Mergers and acquisitions
by receiver region
by sender region
North
North
China
China
ECA
ECA
EAP
EAP
LAC
LAC
MENA
MENA
South Asia
South Asia
SSA
Central America
and Mexico
The Caribbean
SSA
Central America
and Mexico
The Caribbean
South America
South America
0
10
20
30
40
50 60
Percent
70
80
90 100
0
10
20
30
40
50 60
Percent
c. Greenfield investments
by sender region
by receiver region
North
North
China
China
ECA
ECA
EAP
EAP
LAC
LAC
MENA
MENA
South Asia
South Asia
SSA
Central America
and Mexico
The Caribbean
SSA
Central America
and Mexico
The Caribbean
South America
South America
0
10
20
Primary sector (LAC)
30
40
50 60
Percent
70
80
90 100
Manufacturing sector (LAC)
0
10
20
Primary sector (other)
30
40
50 60
Percent
Manufacturing sector (other)
Sources: Data on syndicated loans and mergers and acquisitions are from SDC Platinum. Data on greenfield investments are from fDi Markets.
Note: The sectoral classification of financial flows is based on the International Standard Industrial Classification (ISIC), Revision 3. The primary sector corresponds to ISIC codes
0111–0500 and 1010–1429. The manufacturing sector corresponds to ISIC codes 1511–3699. The North includes the G-7 members and Western Europe countries. The South includes
all other economies. EAP = East Asia and Pacific; ECA = Europe and Central Asia; LAC = Latin America and the Caribbean; MENA = Middle East and North Africa; SSA = Sub-Saharan
Africa.
THREE GLOBAL TRENDS THAT SHAPED LATIN AMERICAN AND CARIBBEAN DE VELOPMENT
47
FIGURE 1.4 Composition of global financial flows across sectors
a. Syndicated loans
10
2008–12
10
11
19
2003–07 4
2008–12
45
46
2
6
86
5
0
Primary
2003–07
by sender region
Manufacturing
Manufacturing
Primary
by receiver region
10
81
20
30
40
50 60
Percent
70
80
2003–07 6
92
2008–12
7
2003–07
6
2008–12
9
90 100
0
87
92
89
10
20
30
40
50 60
Percent
70
80
90 100
70
80
90 100
70
80
90 100
b. Mergers and acquisitions
by sender region
5
71
20
2008–12
6
2003–07
15
0
49
83
4
6
2008–12
Primary
8
2003–07
Manufacturing
Manufacturing
Primary
by receiver region
78
4
10
20
30
40
50 60
Percent
70
80
2003–07 5 4
7
14
17
2008–12
2003–07
6
74
2
4
53
83
0
2008–12
7
0
90 100
80
3
2
10
20
30
40
50 60
Percent
c. Greenfield investments
2008–12 3
2003–07
9
15
8
23
12
0
10
21
10
11
20
30
40
6
15
50 60
Percent
70
China
11
11
19
15
10 3 10
15
15
25
21
14
18
2008–12
14
EAP
23
21
80
Primary
2003–07 2
by sender region
Manufacturing
Manufacturing
Primary
by receiver region
90 100
South Asia
2003–07 3
2008–12 6
10
2003–07 3 10
2008–12 6
0
ECA
14
MENA
66
4
66
1
9
10
6
75
69
2
20
SSA
30
40
50 60
Percent
LAC
North
Sources: Data on syndicated loans and mergers and acquisitions are from SDC Platinum. Data on greenfield investments are from fDi Markets.
Note: The sectoral classification of financial flows is based on the International Standard Industrial Classification (ISIC), Revision 3. The primary sector corresponds to ISIC codes
0111–0500 and 1010–1429. The manufacturing sector corresponds to ISIC codes 1511–3699. The North includes the G-7 members and Western Europe countries. The South includes
all other economies. EAP = East Asia and Pacific; ECA = Europe and Central Asia; LAC = Latin America and the Caribbean; MENA = Middle East and North Africa; SSA = Sub-Saharan
Africa.
48
THE RISE OF THE SOUTH
The composition of global net financial
flows also experienced important changes.
In particular, there was a recomposition of
net equity and net debt flows within countries in both the North and South. Since the
late 1990s, partly in response to the painful
lessons learned from the recurrent crises suffered during the late twentieth century, many
countries in the South, especially in Asia and
Latin America, have steadily changed the
structure of their external assets and liability
positions. Many countries in the South, especially in EAP and LAC, have switched their
external net liability positions from debt to
equity (figure 1.5). Countries from the South
that had been large net debtors became net
creditors with respect to the rest of the world
in debt contracts. This change reflected in
large part the significant accumulation of
international reserves that followed the crises
of the late 1990s. At the same time, countries
from the South became more active users of
foreign equity finance, which led to a rising
net debtor position in risk-sharing equity
contracts (particularly foreign direct investment [FDI]) with respect to the rest of the
FIGURE 1.5 Composition of foreign assets and liabilities in the South, by region
a. LAC-7
10
5
10
0
0
% of GDP
% of GDP
–5
–10
–15
–20
1993
1996
1999
2002
Year
2005
2008
–50
1990
2011
c. ECA-7
1993
1996
1999
2002
Year
2005
2008
2011
2005
2008
2011
d. SSA-7
20
5
0
-5
0
–20
–40
% of GDP
–15
% of GDP
–20
–40
–30
–25
–35
–60
–80
–100
–120
–45
–55
1990
–10
–30
–25
–35
1990
b. Asia-7
20
–140
1993
1996
1999
2002
Year
2005
2008
2011
Net debt position
–160
1990
1993
1996
1999
2002
Year
Net equity position
Source: Updated and extended version of dataset constructed by Lane and Milesi-Ferretti (2007).
Note: Ratios are calculated at the country level and then averaged across countries (simple average) between 1990 and 2011. LAC-7: Argentina, Brazil, Chile, Colombia, Mexico, Peru,
and Uruguay. Asia-7: China, India, Indonesia, the Republic of Korea, Malaysia, Philippines, and Thailand. ECA-7: Croatia, the Czech Republic, Hungary, Lithuania, Poland, the Russian
Federation, and Turkey. SSA-7: Angola, Ghana, Kenya, Nigeria, South Africa, Sudan, and Zambia. GDP = gross domestic product.
THREE GLOBAL TRENDS THAT SHAPED LATIN AMERICAN AND CARIBBEAN DE VELOPMENT
world. In contrast, countries from the North
became net creditors in equity contracts and
net debtors in debt contracts. These patterns
reflect to some extent the dynamics of the
recomposition of net savers and net borrowers in the global economy.
The net integration of countries into the
global economy reflects uneven growth
rates of imports and exports, capital
inflows and outflows, or both.
Another dimension of globalization is the
net integration of countries into the global
economy, based on the relative importance
of countries’ domestic and external demands.
To the extent that external demand reflects
the excess of national income over absorption (comprising both consumption and
investment spending), countries with external
demand–driven integration patterns typically
run systematic current account surpluses or
systematic excesses of domestic saving over
investment (reflecting on the one hand the
difference between exports and imports and
on the other hand the difference in capital
inflows and outflows). In contrast, countries
with a connection to the rest of the world
based on domestic demand generally have
systematic excesses of domestic investment
over domestic saving and therefore typically
run current account deficits. The pattern of
globalization can thus differ across countries
as a result of uneven growth rates of imports
versus exports or of capital inflows and outflows. These persistent current account deficits are usually accompanied by consistently
overvalued currencies.6
This seldom explored aspect of globalization is particularly important for many
LAC countries, as it reflects a dependence
on external saving and a reliance on domestic demand that sets them apart from many
other South economies, especially in East
Asia. In several LAC countries, notably Mexico and most South American countries,
aggregate demand has been clearly tilted
in favor of domestic rather than external
demand, and current account deficits have
been persistent. For all of the debate about
the commodity boom in the 2000s, current
account surpluses among LAC’s commodity
exporters were in most cases short-lived: the
surpluses were virtually gone by mid-2008
and only temporarily recovered in 2009, as
an undesired consequence of the global trade
collapse. Indeed, by 2012 current account
deficits were the norm in these countries,
with only República Bolivariana de Venezuela displaying a current account surplus
(figure 1.6). In contrast, East Asian countries consistently generated relatively large
current account surpluses during most of the
past two decades. Moreover, LAC economies
typically integrated with relatively appreciated real exchange rates compared with East
Asian countries. The Economist’s Big Mac
Index provides some evidence that currencies
in East Asia have been relatively undervalued, whereas currencies in LAC have been
relatively overvalued.
The rise of China and other South players
(especially in Asia and among oil-exporting
countries) with persistent current account
surpluses and large accumulation of international reserves has led to a heated debate
over their contribution to the “global imbalances” in trade and finance and the “global
saving glut,” which has accumulated largely
in U.S. Treasury bonds. A prominent view is
that an excess of saving over investment in
these South economies, invested in U.S. dollar assets, eased financial conditions in deficit countries, particularly the United States,
and exerted significant downward pressure
on world interest rates.7 With low interest
rates in North economies, a search for yield
among investors triggered capital flows to
LAC and other South countries, where borrowing spreads fell to historically low levels and currencies appreciated significantly.
Indeed, for most of the 2000s, the strong
tailwinds coming from commodity prices,
along with large volumes of capital inflows,
reinforced the broad appreciation pressures
in LAC.
49
THE RISE OF THE SOUTH
FIGURE 1.6 Patterns of net integration into the global economy
25
Current account balance as a share of GDP, 2012 (%)
50
Latin America and the Caribbean
East Asia and Pacific
Other countries
20
Singapore
15
10
5
0
China
Hong Kong,
SAR, China
–5
–10
–80
Korea, Rep.
Philippines
Thailand
Mexico
Indonesia
Venezuela, RB
Argentina
Chile
Costa Rica
–60
–40
Brazil
Colombia
Uruguay
–20
0
20
40
60
Big Mac Index as of July 2012 (at market price valuations)
80
100
Sources: Calculations based on data from WDI and Economist Intelligence Unit.
Set of Facts 2: The rise of the
South has had asymmetric
effects on global trade and
financial networks.
Several South economies have joined
the North at the center of the global
trade network.
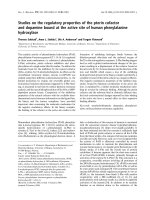
This momentous change stands out clearly in
panel a of figure 1.7, which shows the global
trade network in 1980 and 2012. Each node
represents a country, and each link corresponds to an active bilateral connection
that exceeds a minimum threshold (in panel
a, exports from one country to another, as
indicated by the arrows). Connections that
are trivial in magnitude are not graphed, but
once graphed each connection has the same
weight.8 Countries with a larger number of
connections are more centrally located in the
figure.
In 1980 a set of North countries stood at
what can be empirically characterized as the
center of the global trade network; the United
States, Germany (and a few other Western
European countries), and Japan were at the
core of the network. By 2012 several countries from the South, including not only China
but also Brazil, India, the Russian Federation,
South Africa, Turkey, and others, had moved
to the center. As a result of these changes, the
South is no longer a synonym for periphery
(and the North no longer a synonym for center) in global trade.
The roles of North and South countries
at the center of the global trade
network have differed.
Figure 1.8 illustrates the differing roles of
North and South countries. It takes into
account the relative (rather than absolute)
importance of each country in the global
trade network. The distance between countries reflects similarity in the structure of
their trade connections—the closer countries
are to one another, the more alike they are
in terms of export shares. This similarity in
export shares captures two distinct dimensions: the relative importance a given country
THREE GLOBAL TRENDS THAT SHAPED LATIN AMERICAN AND CARIBBEAN DE VELOPMENT
51
FIGURE 1.7 Global trade and financial networks
a. 1980
b. 2012
BRA
North countries
Latin America and the Caribbean
Other South countries
(continued)
52
THE RISE OF THE SOUTH
FIGURE 1.7 Global trade and financial networks (continued)
b. Global network of portfolio investmentsb
2001
2011
c. Global banking network based on syndicated loansc
1996
2012
d. Global FDI network based on mergers and acquisitions
1990
North countries
2012
Latin America and the Caribbean
Other South countries
Continue
(continued)
THREE GLOBAL TRENDS THAT SHAPED LATIN AMERICAN AND CARIBBEAN DE VELOPMENT
53
FIGURE 1.7 Global trade and financial networks (continued)
e. Global FDI network based on greenfield investments
2003
North countries
2012
Latin America and the Caribbean
Other South countries
Sources: Calculations based on data on trade are from Direction of Trade Statistics (DOTS), on portfolio investments from Coordinated Portfolio Investment Survey (CPIS), on syndicated loans and mergers and acquisitions from SDC Platinum, and on greenfield investments from fDi Markets.
Note: Networks are drawn using the Kamada-Kawai algorithm. Each node represents a country. Each link corresponds to an active connection (a positive flow or stock of investments)
between a pair of countries. Arrows indicate the direction of these connections. For each dataset, the left-hand column shows the networks in the first year of the sample and the
right-hand column shows the networks in the last year of the sample. The North includes the G-7 members and Western Europe countries. Other South includes all other economies
except Latin America and Caribbean countries. All new syndicated loans on a given year are reported. FDI = foreign direct investment; G-7 = Group of Seven.
a. Only trade flows (exports) greater than $10 million in 1980 or greater than $100 million in 2012 are reported.
b. Only positive holdings of foreign portfolio assets (equity and bonds) are reported.
c. All new syndicated loans on a given year are reported.
has in other countries’ exports and the relative importance that other countries have in a
given country’s exports. Countries that capture a larger share of other countries’ exports
and that are connected with a larger number
of trading partners (that is, countries that
are more important in the global network)
appear to the right in figure 1.8. Along the
vertical dimension, the smaller the distance
between two countries, the more similar the
structure of trade connections across members of the network.
During the 1980s and 1990s, only North
countries were clustered toward the right
of the graph, indicating that only they were
systemically important to the global trade
network. For example, for 1980 the United
States, Germany, and Japan appear at the far
right side of panel a in figure 1.8. In addition,
the countries on the right are very close to one
another on the vertical dimension, reflecting
a high degree of similarity in the structure of
their trade connections with other countries
in the network. The global trade network in
1980 thus tended to display a sort of “single
polarity,” with some North countries acting
as a single pole (that is, playing the same role)
for world trade.
The global trade network in 2012 reveals
a tectonic shift: several countries from the
South appear on the right side of panel b of
figure 1.8, indicating their increased relevance to world trade. However, they remain
somewhat distant (along the vertical dimension) from the other (North) countries on the
right side of the figure. This side of the figure
resembles a star, with small groups of central
countries placed at a certain distance from
FIGURE 1.8 Similarity in global trade networks
Similarity in trade structures
a. 1980
Systemic relevance in global trade
Similarity in trade structures
b. 2012
Systemic relevance in global trade
Source: Calculations based on data from Direction of Trade Statistics (DOTS).
Note: Each node represents a country. Each link corresponds to an active trade connection between a pair of countries. Arrows at the end of each link capture the direction of these
connections. Trade connections are measured as exports as a share of total exports of the source country. Only shares greater than 1 percent are reported. The distance between countries reflects similarity in the structure of their trade connections: the closer countries are to one another, the more alike they are in terms of export shares. Countries capturing a larger
share of other countries’ exports and connected with a larger number of trading partners appear on the right-hand side of the figure (more systemically relevant countries in global
trade). The smaller the distance between two countries along the vertical dimension, the more similar the structure of their trade connections across other members of the network.
THREE GLOBAL TRENDS THAT SHAPED LATIN AMERICAN AND CARIBBEAN DE VELOPMENT
Unlike global trade, global finance has
not been fundamentally restructured:
the North still stands alone at the center
of the global financial networks.
A key feature of the new dynamics of the
global economy has been the asymmetry
in the pattern of change in global trade and
financial networks.9 In the sphere of trade,
the traditional correspondence between the
North and the center (and the South and the
periphery) has been reconfigured. In contrast, in the sphere of finance, North countries still stand alone at the center of the
FIGURE 1.9 Structural equivalence of trade connections
b. 2012
a. 1980
100
100
90
90
80
80
70
70
60
60
Share of the world (%)
Share of the world (%)
one another. Russia and Turkey, for example,
are not located near any North core country
from Europe, and Japan is not close to either
China or Korea. Among the systemically
important countries, South countries thus
play a different role from North countries in
international trade. It is in this empirically
well-defined sense that the global trading
landscape has become more heterogeneous
and “multipolar.”
This rising heterogeneity at the center of
global trade is also apparent when countries are grouped according to the structural
equivalence of their trade connections (see,
for example, Burt 1976). Two countries play
the same role in the network (that is, have
exact structural equivalence) when they have
the same connections to all other countries.
In figure 1.9, countries are grouped by different threshold levels of similarity in their
trade structure (based on the value of trade
flows between countries and the composition of trading partners). In 1980 there were
basically three dominant groups of countries.
In 2012, for the same threshold level of similarity in trade structures, there were many
more than three groups, and fewer countries
belonged to each of the top three groups.
These patterns suggest that as the South
gained space in global trade, the diversity of
trade structures increased around the world.
Intrinsically related to this diversity are arguably differences in the sectoral composition
of the trade flows of South and North countries, as discussed in Set of Facts 1.
55
50
50
40
40
30
30
20
20
10
10
0
0.75
0.45
Similarity
0.32
0
0.75
0.45
0.32
Similarity
Source: Calculations based on data from Direction of Trade Statistics (DOTS).
Note: Countries are grouped according to different threshold levels of similarity in their trade structure (based on the volume of trade flows between countries and the composition of partners).
Within each bar, the share of countries that belong to the same structurally equivalent group are
shown in different colors. Each bar shows these grouping of countries at different threshold levels,
reported in the x-axis. The structural equivalence of trade connections is based on the similarity of
the correlation matrix of trade flows.
56
THE RISE OF THE SOUTH
global financial networks, though the South
has increased its connectivity within these
networks (see figure 1.7, panels b, c, d, and
e for portfolio investments, syndicated loans,
M&A, and greenfield investment flows).
Whether this asymmetry proves transitory
is a matter of hot debate. Not only is there
broad recognition of the U.S. dollar as an
international currency, but the scale and network effects associated with financial centers
will not be easy for the South to overcome.
Moreover, the trade-finance asymmetry
stands in sharp contrast with broad historical
developments since the Industrial Revolution
and throughout most of the twentieth century, when countries that became important
economic powers also became international
financial centers. London, New York, and
Tokyo, for example, became financial centers as their nations strengthened their roles
as gravity poles for regional and even global
economic activity.
The growth of the South has been
widespread, with new South-South as
well as South-North and North-South
connections developing.
As the South gained prominence in the global
economy, the number of its bilateral international connections proliferated. New connections were established not only between
the South and the North but also within the
South (figure 1.10). In 1990 only 46 percent
of the total number of possible South-South
trade connections were active; by 2012 this
proportion had risen to 70 percent.10 Similar
trends are observed across types of financial
flows. In 2001 South countries had portfolio investments in 10 percent of the countries
of the South; by 2011 this share had more
than doubled, to 21 percent. The increase in
this extensive margin for FDI flows within
the South was also considerable, albeit from
much lower starting points. The share of the
total number of South-South connections for
M&A that were active rose from 0.1 percent
in 1990 to 1.3 percent in 2011, and the share
of active greenfield investments rose from
2.2 percent in 2003 to 3.4 percent in 2011.
For all types of financial flows, the number
of active South-South connections as a share
of all active connections in the world increased
more than the number of North-North,
North-South, and South-North connections.
The growing number of connections among
the relatively small countries of the South is a
significant driver of these patterns. Although
larger South countries (such as Brazil, China,
India, and Russia) increased the number of
their connections with other countries in the
South—and in terms of volume these connections typically dominate—they accounted for
a relatively small fraction of the total number
of South-South connections. The breadth of
the reach of the rise of the South phenomenon is thus key to these patterns of financial
flows. To be sure, many countries in the South
have yet to be connected with a wide set of
countries in the world, especially in terms of
financial connections with other countries in
the South, suggesting that there is still significant scope for the continued expansion of the
South in cross-border flows.
LAC is increasingly connected with
other South countries in both trade
and finance.
Countries in LAC broadened and deepened
their connections with other South countries,
though the value of such connections is still
relatively small, especially in finance, when
contrasted to LAC-North connections (figure
1.11). For instance, the share of the South in
total trade flows to and from LAC countries
increased about 70 percent (from 26 percent
to 45 percent), during the 2000s. The expansion of syndicated loans and M&A between
LAC and other South countries was also striking, albeit from lower bases, with syndicated
loans rising almost 180 percent (from about
4 percent to 12 percent of total flows) and
M&A increasing more than 140 percent (from
about 15 percent to 37 percent of total flows).
LAC countries also became increasingly
integrated with a wider set of other South
countries; intraregional integration has deepened, and linkages with other South countries have expanded. These patterns have
FIGURE 1.10 Extensive margin of South-South connections
1980
2001
1996
1990
2003
a. Tradea
b. Portfolio investmentsb
c. Syndicated loans
d. Mergers and acquisitions
e. Greenfield investments
2012
2011
2012
2012
2012
Sources: Calculations based on data on trade are from Direction of Trade Statistics (DOTS), on portfolio investments are from Coordinated Portfolio Investment Survey (CPIS), on syndicated loans and mergers and acquisitions are from SDC Platinum, and on greenfield investments are from fDi Markets.
Note: Each line represents a positive flow or stock of investments between two South countries. For each dataset, the left-hand column shows the network in the first year of the
sample and the right-hand column shows the network in the last year of the sample. South countries comprise all countries that do not belong to the G-7 or are not located in Western Europe. G-7 = Group of Seven.
a. Only connections worth more than $10 million are included.
b. Only positive holdings of foreign portfolio assets (equity and bonds) are reported.
THE RISE OF THE SOUTH
Despite the increased diversification of
connections around the world, there is
significant regional clustering in both
trade and financial relations.
The South has broadened and deepened its
connections not only with North countries
but also with other South countries. However, the strongest trade ties for countries in
both the North and the South are with neighboring countries, suggesting that geographical proximity has played an important role
in the evolution of these connections. Most
Central American and Caribbean countries,
for example, belong to a single cluster with
North American countries, centered on the
United States (figure 1.12). South American
countries form a smaller cluster, centered
on Brazil, made up mostly of countries in
Mercosur. Other large clusters include one
consisting of European countries, centered
on Germany, and another comprising Asian
economies, including Japan and most East
Asian economies, centered on China.
Similar patterns are observed in global
finance. South countries generally send the
Trade
2000-2002
2003-2005
Portfolio
investmentsa
2010-2012
2000-2002
2003-2005
2010-2012
2000-2002
Syndicated
loans
Set of Facts 3: The structure of
bilateral trade and financial
connections of the South
has been generally different
from that of the North, with
geography and endowments
arguably shaping their evolving
structure.
FIGURE 1.11 Regional composition of crossborder connections of countries in Latin America
and the Caribbean
2003-2005
2010-2012
2000-2002
Mergers and
acquisitions
been widespread across flow types (trade,
portfolio investments, loans, and FDI). China
in particular has emerged as an important
partner for some LAC countries, especially
South American countries on the trade front.
In 1990 virtually no trade existed between
LAC and China. By the late 2000s, LACChina trade represented 12 percent of total
trade flows to and from LAC countries. On
the financial front, China’s role has been
more limited, though its importance has been
rising, especially for FDI.
2003-2005
2010-2012
2000-2002
Greenfield
investments
58
2003-2005
2010-2012
0 10 20 30 40 50 60 70 80 90 100
Percent
Other South
Latin America and the Caribbean
China
North
Sources: Calculations based on data on trade are from Direction of Trade
Statistics (DOTS), on portfolio investments are from Coordinated Portfolio
Investment Survey (CPIS), on syndicated loans and mergers and acquisitions are from SDC Platinum, and on greenfield investments are from fDi
Markets.
Note: The figure considers both inflows and outflows. The North includes
the G-7 members and Western Europe countries. Other South includes all
other countries except China and countries in LAC. G-7 = Group of Seven.
a. The composition of portfolio investments is based on the holdings of
cross-border portfolio (equity and bonds) assets. Because of data limitations, these data cover only the following periods: 2001–02, 2003–05, and
2010–11.
THREE GLOBAL TRENDS THAT SHAPED LATIN AMERICAN AND CARIBBEAN DE VELOPMENT
majority of their financial investments to
the North, but neighboring South countries
come in second as a share of these investments. Countries in LAC typically invest in
other LAC countries, Asian countries invest
largely in other Asian countries, Eastern
European countries invest mostly in other
Eastern European countries, and so on (figure 1.13). These patterns hold for portfolio
investments and syndicated loans as well
as FDI (both M&A and greenfield investment). The largest non-North recipients
of investments from LAC countries during
the 2000s, for example, were other LAC
countries, which accounted for 7 percent of
total portfolio investments, 24 percent of
new syndicated loans, 34 percent of M&A
flows, and 61 percent of new greenfield
investments.
The development of global value chains
has arguably played an important role
in the regional clustering in trade and
financial connections.
Underpinning to some extent these clustering patterns has been the development of
global value chains (GVCs)—the dispersion
of production stages and processes across
countries.11, 12 GVCs are more regional than
global.13 In Central America, for example,
the dairy sector has crossed borders, and a
GVC encompassing producers in El Salvador
and Nicaragua has developed. Local companies in El Salvador have forged local partnerships with small industries in Nicaragua to
produce their national cheese (“el quesillo”),
which is then sold in the United States (see
Martinez-Piva and Zúñiga-Arias 2012).
In Sub-Saharan Africa, the recent entry of
South African clothing manufacturers into
neighboring countries (such as Lesotho and
Swaziland) has led to the rise of regional
value chains driven by South African retailers (see Morris, Staritz, and Barnes 2011).
More broadly, Baldwin and Lopez-Gonzalez
(2013) highlight the importance of three
large production clusters around the world:
factory North America, factory Europe, and
factory Asia.
As GVCs have gained prominence,
exports of final products have become
increasingly composed of imports of intermediate inputs: more intermediate goods
are traded across borders, and more parts
and components are imported for use in
exports. Data on the sources of foreign
value added (FVA) in exports point to the
regional nature of GVCs, showing that the
FVA content in exports typically originates
in neighboring countries (figure 1.14, panel
a).14 For example, almost 40 percent of the
FVA in the exports of EAP economies comes
from other economies in EAP, and more
than 75 percent of the FVA in the exports of
ECA countries comes from other ECA and
Western Europe countries.
The degree of regional clustering in the
sources of FVA in exports is much less pronounced in LAC than in other South regions,
though there is some clustering within LAC
subregions (see figure 1.14, panel b). Imports
from other South American countries represent about 35 percent of the FVA in exports
of South America on average, with the rest
of LAC adding only another 3 percent of
imported FVA. Similar patterns are observed
for Central America and Mexico.
There is, however, a striking contrast in
the relative importance of other regions in
the FVA of exports across LAC countries.
For Mexico, Central America, and the Caribbean, the United States and Canada are prominent sources of imported inputs used in their
exports. GVCs in South America (as proxied
by the FVA in exports) seem much less tied
to North America than GVCs in Mexico,
Central America, and the Caribbean. In fact,
the three major centers of global production
(North America, Western Europe, and East
Asia) provide a more balanced contribution
to the exports of South America. For example, in 2011 the United States and Canada
provided about 40 percent of the FVA in the
exports of Mexico, Central America, and the
Caribbean but only 19 percent of the FVA in
59
60
THE RISE OF THE SOUTH
FIGURE 1.12 Clusters in the global trade network
a. Main clusters of the network in 2012
United States
Brazil
South Africa
China
Australia
Germany
b. The U.S. cluster
SUR
ABW
GUY
JAM
KHM
CHL
PER
TTO
DOM
NIC
HND
GTM
COL
United States
SLV
ECU
Brazil
BRB
LCA
NER
VEN
ARG
DMA
KNA
HTI
BOL
CAN
TCD
MEX
c. The Brazilian cluster
GAB
URY
VCT
CRI
PRY
NGA
BHS
BLZ
GRD
PAN
d. The German cluster
DZA
MDG
GHA
CAF
SLE
CPV
MAR
MDV
MUS
e. The Chinese cluster
SYC
AZE
TUN
CMR
GNQ
ALB
HRV
ESP
ITA
PRT
GBR
GRC
Germany
LUX
BEL
SVN
BIH
ISL
HUN
POL BGR
MNE
NL
BGD
NOR
MKD MDA
ETH SVK
SRB
CZE
DNK BDI
SWE
ARM
TUR
GEO
FIN
AUT
RUS
TJK
EST
CIV
LVA
KGZ
LTU
BLR
UZB
UKR
SEN
GNB
CYP
SLB
AGO
FRA
IRL
NPL
JOR
MLI
HKG
TKM
IRQ
GMB
MNG
COG
BFA
BHR
China
SGP
YEM
LAO SAU
COM
BEN
KWT IRN
QAT
SDN
MRT
ZMB
IND
PHL
VNM
PAK
ARE
KOR
OMN
JPN
MYS
RWA
BRN
UGA
TZA
THA
VUT
KEN
KAZ
Source: Calculations based on data from Direction of Trade Statistics (DOTS).
Note: This figure shows the results of clustering analysis on the global trade network in 2012. Panel a shows the most central countries for each of the main
clusters (in the other panels) of the global trade network. Panels b through e show the composition of countries that belong to each of these individual
clusters. Each node represents a country. Each link corresponds to an active trade connection between a pair of countries. The thickness of the link indicates the strength of these connections. For clarity purpose, panels only display the top 10 percent of links in the U.S. and Chinese clusters, and the top 5
percent of links in the German cluster. All the links are displayed for the Brazilian cluster.
THREE GLOBAL TRENDS THAT SHAPED LATIN AMERICAN AND CARIBBEAN DE VELOPMENT
61
FIGURE 1.13 Regional composition of cross-border investments
b. Syndicated loans
North
North
LAC
LAC
South and
Southeast
Asia
South and
Southeast
Asia
Sender regions
Sender regions
a. Portfolio investments
Eastern
Europe
Eastern
Europe
Middle East
and Central
Asia
Middle East
and Central
Asia
Africa
Africa
0
10
20 30 40 50 60 70 80
% of investments to receiver regions
0
90 100
10
North
North
LAC
LAC
South and
Southeast
Asia
South and
Southeast
Asia
Eastern
Europe
Eastern
Europe
Middle East
and Central
Asia
Middle East
and Central
Asia
Africa
Africa
0
North
10
20 30 40 50 60 70 80
% of investments to receiver regions
LAC
South and Southeast Asia
90 100
d. Greenfield investments
Sender regions
Sender regions
c. Mergers and acquisitions
20 30 40 50 60 70 80
% of investments to receiver regions
90 100
Receiver regions
Eastern Europe
0
10
20 30 40 50 60 70 80
% of investments to receiver regions
Middle East and Central Asia
Africa
90 100
Others
Sources: Calculations based on data on trade are from Direction of Trade Statistics (DOTS), on portfolio investments are from Coordinated Portfolio Investment Survey (CPIS), on syndicated loans and mergers and acquisitions are from SDC Platinum, and on greenfield investments are from fDi Markets.
Note: Each bar in each graph corresponds to the sender region and each group of countries within a given bar corresponds to the receiving region. Offshore centers are excluded.
The North includes the G-7 members and Western Europe countries. G-7 = Group of Seven; LAC = Latin America and the Caribbean.
62
THE RISE OF THE SOUTH
the exports of South American countries. For
South American countries, about 16 percent
of FVA originated in Asia, and 28 percent
originated in Western Europe.
Despite the increase in the importance
of the South in GVCs over the past decade,
North countries still remain a significant
source of imported inputs used in the exports
of LAC countries.15 Also notable is the limited participation of LAC countries as sources
of FVA for the exports of other countries,
especially South countries.16 South American
countries are more present in this regard than
other LAC countries, albeit mostly because of
their commodities exports.
Overall, although some regional clustering
is observed within LAC, the patterns of trade
integration in the region are different from
those observed in other South economies,
East Asia in particular. Box 1.1 examines
some of these differences.
Endowments have also played a role
in the structure of trade and financial
linkages.
There is significant heterogeneity in the
sectoral composition of global trade and
financial flows not only of the North when
contrasted with the South but also within the
South (as discussed in Set of Facts 1). There
is also heterogeneity in the sectoral composition of bilateral connections: South-South
connections are different from North-South
connections, which in turn are different from
North-North connections.
One characteristic that reflects the differences in bilateral trade connections is
the degree of intraindustry trade (IIT). The
degree of IIT, measured by the Grubel-Lloyd
index, ranges from 0 (pure interindustry
trade) to 1 (pure IIT trade). The degree of
IIT varies across South and North countries
as well as within the South. North-North
connections are typically characterized by
a higher degree of IIT than South-North
and South-South connections (figure 1.15,
panel a).
The sectoral compositions of bilateral
financial connections of the North and the
South are also strikingly different. The share
of financial inflows in the primary sector is
larger in the South than in the North, independent of whether the flows are from South
or North countries (see figure 1.15, panel
b). For example, the primary sector’s share
of syndicated loans averaged 45 percent of
South-South flows and just 19 percent of
North-North flows between 2003 and 2012.
South-South M&A flows are also tilted
toward the primary sector when contrasted
with North-North flows. Flows to the primary sector, for example, accounted for
54 percent of South-South flows but just 20
percent of North-North flows. Similar patterns are also observed for greenfield investments. Relative to North-North financial
flows, North-South and South-South flows
include a larger share of investments in the
primary sector.
The overall patterns of bilateral connections of the South and the North suggest that the South’s trade and financial
linkages are to some extent rooted in the
forces of comparative advantage associated
with relative endowments. The evidence
presented above on the dynamics of trade
connections suggests triangular trading
relationships between some South and
North economies. An example of this triangularity is the trade connections between
China and South America, whereby China
imports commodities from LAC (especially South America) and exports manufacturing goods to LAC and the rest of the
world, including the North. In contrast,
the North’s trade linkages, especially linkages with other North economies, embed
components of product differentiation and
economies of scale.17
The sectoral composition of LAC’s
trade and financial connections with
other South countries is different from
the composition of its ties with North
countries.
Trade and financial flows to LAC countries
from the South include a larger share of flows
in the primary sector than do flows from the
63
THREE GLOBAL TRENDS THAT SHAPED LATIN AMERICAN AND CARIBBEAN DE VELOPMENT
FIGURE 1.14 Regional clustering in global value chains, 2011
a. Sources of FVA in exports across regions
b. Sources of FVA in exports across LAC countries
Argentina
EAP
Brazil
Chile
South America
Japan
SA
Colombia
Bolivia
Ecuador
Peru
Paraguay
Uruguay
ECA
Venezuela, RB
Aruba
Western
Europe
Antigua and
Barbuda
The Caribbean
Bahamas, The
MENA
SSA
Barbados
Cuba
Dominican
Republic
Haiti
Jamaica
North
America
Trinidad and
Tobago
Belize
Central America and Mexico
Central America
and Mexico
The Caribbean
Costa Rica
Guatemala
Honduras
Mexico
Nicaragua
Panama
South America
El Salvador
0
Intraregional
EAP
5
10
Japan
15 20 25 30 35
Share of exports (%)
South
Asia
ECA
40
45
Western
Europe
0
50
MENA
SSA
North
America
5
10
15
20
25
Share of exports (%)
Mexico and
Central America
The
Caribbean
30
35
South
America
Sources: Calculations based on data from Eora MRIO and World Development Indicators.
Note: Figure shows the regional composition of sources of foreign value added used in a country’s exports, scaled by the country’s exports. In panel b, the intraregional category captures the share of foreign value added sourced from the LAC subregion to which each country belongs. North America excludes Mexico. EAP = East Asia and Pacific; ECA = Europe
and Central Asia; LAC = Latin America and the Caribbean; MENA = Middle East and North Africa; SA = South Asia; SSA = Sub-Saharan Africa; FVA = foreign value added.
64
THE RISE OF THE SOUTH
FIGURE 1.15 Sectoral composition of bilateral cross-border flows
a. The degree of intraindustry trade
0.7
0.6
0.5
0.4
0.3
0.2
0.1
0
1962–1969
1970–1979
1980–1989
Years
North-North
North-South
1990–1999
2000–2011
South-South
b. Bilateral financial flows
100
90
35
80
30
39
42
52
57
70
59
60
Percent
60
75
7
79
15
88
20
50
75
13
11
40
21
25
30
58
20
41
8
10
20
19
54
20
5
45
6
38
19
13
3
20
20
9
to South
From North…
Primary
eld
nd
ica
ted
Gr
ee
nfi
A
M&
ns
loa
eld
Gr
ica
Sy
nd
Sy
to North
ee
nfi
A
M&
loa
ted
ee
nfi
Gr
ted
Sy
Sy
ns
eld
A
M&
ns
loa
eld
nd
ica
Gr
ee
nfi
A
M&
nd
ica
ted
loa
ns
0
to South
to North
From South…
Light manufacturing
Heavy manufacturing
Sources: Data on intraindustry trade are from Comtrade, on syndicated loans and mergers and acquisitions are from SDC Platinum, and on greenfield investments are from fDi Markets.
Note: Panel a shows trade-weighted averages of country pairs. Panel b presents the sectoral composition of bilateral financial flows (namely syndicated loans, M&A, and greenfield) over 2003–2012. The primary sector corresponds to SIC codes 0–1500, light manufacturing to SIC codes 2000–2800 and 3100–3200, and heavy manufacturing to SIC codes
2800–3100 and 3200–3800. The North includes the G-7 members and Western Europe countries. The South includes all other economies. G-7 = Group of Seven; M&A = mergers and
acquisitions.
THREE GLOBAL TRENDS THAT SHAPED LATIN AMERICAN AND CARIBBEAN DE VELOPMENT
North (figure 1.16, panels a and b). Particularly striking is the large share of M&A
investments from the South to LAC in the
primary sector (92 percent during the 2000s).
In contrast, only 48 percent of M&A investments from the North were in the primary
sector. Large but less marked differences are
also observed in greenfield investments and
syndicated loans. Regarding trade flows, the
share of natural resources in LAC imports
from the South was 10 percent between 2003
65
and 2012, twice the average 5 percent of
imports from the North.
Trade and financial flows from LAC
countries to the South are also tilted toward
the primary sector when compared with
flows to the North (see figure 1.16, panels
a and c). The share of natural resources
in exports from LAC to the South during
2003 –12 was about 60 percent larger
than the share of exports to the North
(46 percent versus 29 percent on average).
BOX 1.1 Differences in international trade integration: The case of Latin America and the
Caribbean and East Asia
The analysis of the evolution of the connections
within East Asia and LAC trade networks shows
considerable differences between the two regions.
The density maps of the trade connections within
each region are particularly telling (figure B1.1.1).a
One contrast in the nature of the trade connections of LAC and East Asian economies is the evolution of the relative importance of different countries within the networks. In 1980 trade networks
in both regions centered on countries of the North,
especially the United States for LAC and Japan for
Asia. By 2012 many countries from both the North
and the South were central players in the East Asian
network, appearing as very dense nodes in the map.
These countries included not only China and Japan
but also Republic of Korea, Malaysia, Singapore, and
Thailand. In contrast, in the LAC network no node
was as dense as the United States. Brazil was the closest node in density, but it was far less dense than the
United States. China entered as a new player in the
LAC network in 2012, though its density was low.
Differences in the dispersion of the centrality measure
associated with each node within the two networks
support these patterns. For example, in 2012 the dispersion of the node centrality was significantly lower
in the East Asian network (0.09) than in the LAC network (0.31), indicating that there is less variation in
the density of nodes in the former than the latter.
Another contrast is the degree of connectivity of
countries within the networks, a feature that has
persisted over time. The trade connections within
the East Asian clustering form a much denser network than those within the LAC cluster. In 2012
almost all countries were fully connected with all
other countries within the East Asian network (as
indicated by a network density measure of 0.99 for
this cluster). Countries in the LAC network were not
as fully integrated with one another (the network
density measure for this cluster was 0.89).
Figure B1.1.1 also suggests that trade connections
within the East Asian network are multidirectional
and intense in every direction, whereas those within
the LAC network tend to be mainly bidirectional,
especially with the United States. For instance, triads of trade connections are typically observed at
a higher frequency in the East Asian network than
in the LAC network. In 2012 the number of triads
as a share of the maximum number of triads within
a network was 0.99 in the East Asian network and
0.92 in the LAC network. This type of connectivity
observed in the East Asian network suggests strong
feedback effects, whereby the tight trade connections within the region boost trading with the rest
of the world and vice versa. In contrast, LAC countries do not seem to leverage intraregional trade to
enhance their overall level of connectivity within
the global trade network. These patterns may be
linked, at least in part, to the more active participation of East Asian countries in GVCs relative to
LAC countries.
a. The density of a node depends on the number of neighboring countries and the economic distance between countries. The sample of countries included affects
the maps, making it hard to directly compare node density across panels. Still, some features are comparable across maps. The set of countries in each of the two
trade clusters analyzed includes all South countries within each region. This set of countries was expanded to include the five largest trading partners (measured by
the total volume of trade flows) for countries in the region located outside the region.
(continued)