Writing Task 1 Sample 3
Bạn đang xem bản rút gọn của tài liệu. Xem và tải ngay bản đầy đủ của tài liệu tại đây (103.95 KB, 2 trang )
Writing Task 1 - Sample 3: Bar chart
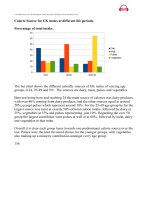
The chart compares population shares in various regions of the world with the
distribution of wealth in these same regions. It can be seen that population shares
in almost all cases do not relate to the distribution of wealth.
Even though North America has only approximately 6% of the world’s population,
it boasts nearly 34% of global wealth. A similar situation can be seen in Europe,
which has 15% of the global population but 30% of global wealth, and the rich
(high income) Asia-Pacific countries with 5% of the world’s population but 24%
of its wealth.
On the other hand, the total wealth of people in China, India, Africa, Latin
America and the Caribbean, and the other poor (lower income) countries in Asia-
Pacific is far less than their shares of the world population. This is most striking in
India, where 16% of the world’s population own only 1% of the world’s wealth
and in China, which has the highest percentage of global population (24%) but
only 3% of the world’s wealth.