ielts writing task 1 sample pie chart 2
Bạn đang xem bản rút gọn của tài liệu. Xem và tải ngay bản đầy đủ của tài liệu tại đây (195.52 KB, 2 trang )
www.ieltsbuddy.com - Free online IELTS Advice
Sample Pie Chart - IELTS Task 1
You should spend about 20 minutes on this task.
The pie charts show the electricity generated in Germany and
France from all sources and renewables in the year 2009.
Summarize the information by selecting and reporting the main
features and make comparisons where relevant.
Write at least 150 words.
www.ieltsbuddy.com - Free online IELTS Advice
www.ieltsbuddy.com - Free online IELTS Advice
Sample Pie Chart - Model Answer
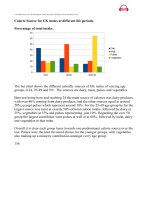
The four pie charts compare the electricity generated between Germany and France during 2009,
and it is measured in billions kWh. Overall, it can be seen that conventional thermal was the
main source of electricity in Germany, whereas nuclear was the main source in France.
The bulk of electricity in Germany, whose total output was 560 billion kWh, came from
conventional thermal, at 59.6%. In France, the total output was lower, at 510 billion kWh, and in
contrast to Germany, conventional thermal accounted for just 10.3%, with most electricity
coming from nuclear power (76%). In Germany, the proportion of nuclear power generated
electricity was only one fifth of the total.
Moving on to renewables, this accounted for quite similar proportions for both countries, at
approximately 15% of the total electricity generated. In detail, in Germany, most of the
renewables consisted of wind and biomass, totaling around 75%, which was far higher than for
hydroelectric (17.7%) and solar (6.1%). The situation was very different in France, where
hydroelectric made up 80.5% of renewable electricity, with biomass, wind and solar making up
the remaining 20%.
(Words 183)
www.ieltsbuddy.com - Free online IELTS Advice