ielts writing task 1 sample table
Bạn đang xem bản rút gọn của tài liệu. Xem và tải ngay bản đầy đủ của tài liệu tại đây (169.75 KB, 2 trang )
www.ieltsbuddy.com - Free online IELTS Advice
IELTS Writing Task 1 - Table
You should spend about 20 minutes on this task.
The table shows the Proportions of Pupils Attending Four Secondary
School Types Between Between 2000 and 2009
Summarize the information by selecting and reporting the main features
and make comparisons where relevant.
Write at least 150 words.
The Proportions of Pupils Attending Four Secondary School Types between
2000 and 2009.
2000
2005
2009
Specialist Schools
12%
11%
10%
Grammar Schools
24%
19%
12%
Voluntary-controlled
Schools
52%
38%
20%
Community Schools
12%
32%
58%
www.ieltsbuddy.com - Free online IELTS Advice
www.ieltsbuddy.com - Free online IELTS Advice
Model Answer
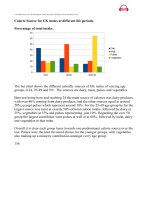
The table illustrates the percentage of school children attending four different types of secondary
school from 2000 to 2009. It is evident that the specialist, grammar and voluntary-controlled
schools experienced declines in numbers of pupils, whereas the community schools became the
most important providers of secondary school education during the same period.
To begin, the proportion in voluntary-controlled schools fell from just over half to only 20% or
one fifth from 2000 to 2009. Similarly, the relative number of children in grammar schools -- just
under one quarter -- dropped by half in the same period. As for the specialist schools, the
relatively small percentage of pupils attending this type of school (12%) also fell, although not
significantly.
However, while the other three types of school declined in importance, the opposite was true in
the case of community schools. In fact, while only a small minority of 12% were educated in
these schools in 2000, this figure increased to well over half of all pupils during the following
nine years.
Words 170
www.ieltsbuddy.com - Free online IELTS Advice