6 2 chart worksheet
Bạn đang xem bản rút gọn của tài liệu. Xem và tải ngay bản đầy đủ của tài liệu tại đây (295.18 KB, 0 trang )
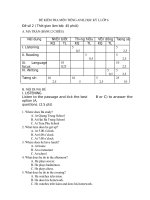
The bar chart below shows the numbers of men and women attending various evening
courses at an adult education centre in the year 2009. The pie chart gives information about
the ages of these course participants.!
!
!
!
!
!
Here’s the report that I wrote in the video lesson:!
!
!
!
!
!
!
!
!
!
!
!
!
!
!
!
!
!
!
!
The bar chart compares the numbers of males and females who took four different evening classes
in 2009, and the pie chart shows the age profile of these attendees.!
!
It is clear that significantly more women than men attended evening classes at the education
centre. We can also see that evening courses were much more popular among older adults.!
!
According to the bar chart, drama, painting and language courses all attracted more women than
men to the education centre in 2009. Language classes had the highest number of participants
overall, with 40 female and 20 male students, while painting was a popular choice among both
genders, attracting 30 female and 25 male attendees. The only course with a higher number of
males was sculpture, but this course was taken by a mere 15 people in total.!
!
Looking at the age profile pie chart, we can see that the majority of people attending evening
lessons were over 40 years of age. To be precise, 42% of them were aged 50 or more, and 26%
were aged between 40 and 49. Younger adults were in the minority, with only 11% of students
aged 20 to 29, and only 5% aged under 20.!
!
!
!
!
!
!
!
!
(200 words, band 9)!
Note: word count includes all numbers!
IELTS-Simon’s video course
/>
Analysis task:!
!
1.
2.
3.
4.
5.
Underline examples of paraphrasing in the introduction, comparing it with the question.!
Look again at the 2 main points that I chose for the overview (paragraph 2).!
How did I divide the information into two ‘details’ paragraphs (3 and 4)?!
Was it necessary to compare the bar chart with the pie chart?!
Underline the numbers that I mentioned in paragraphs 3 and 4. How many numbers did I
mention in total?!
6. Underline examples of ‘comparing’ language in the report.!
7. Why didn’t I use any ‘change’ language (e.g. increase, decrease)?!
8. How many sentences did I write in each paragraph?!
!
!
Vocabulary task:!
!
Watch the video lesson again. Near the end of the lesson, find the list of good vocabulary.
Underline those phrases in the full report on page 1 of this worksheet.!
!
!
Extra task:!
!
Try to write your own report about the same two charts using what you remember from the lesson
(but without looking at my answer).!
Compare your finished report with mine, and look for areas where you could improve.
IELTS-Simon’s video course
/>