PART 11 Practical Exercises
Bạn đang xem bản rút gọn của tài liệu. Xem và tải ngay bản đầy đủ của tài liệu tại đây (2.16 MB, 34 trang )
PART 11
Practical
Exercises
The aim of Chapters 5-8 will be to illustrate the principles of ELISA
fully by:
1. Showing worked examplesof eachassay,including diagramsof platesand
representationaldata from assays;
2. Analyzing such data in terms of important rules that are learnedat each
stage;and
3. Providing full working instructronsfor workers to be ableto perform each
assayso that they obtain their own data to be analyzedas describedin (1)
and (2). This includes full instructionson the preparationand standardization of reagents.
The chapters can therefore be used in several ways. Workers without
accessto reagentswill obtain a working knowledge of ELISA through the
examples. The chapterscan also be used in training courses where reagents
may be provided (as indicated in the text). The information will also be
useful to workers who have already had some experience of the technique and who may have had difficulties in obtaining and analyzing data.
Remember that it is the application of the ELISA to specific problems,
and not the methodology for its own sake, that is the most important
reason the techniques should be mastered.
1. Test Schemes
You may be already familiar with the concepts in ELISA, whereby an
antigen binds to an antibody that can be labeled with an enzyme, or be in
turn detected with a species-specific antibody (enzyme labeled). All the
ELISAs are variations on this theme. Inherent in the methods of ELISA
described in these chapters is the fact that one of the reagents is attached
to a solid-phase, making the separation of bound (reacted) and unbound
(nonreacted) reagents simple by washing. Before performing ELISA on
disease agents, it is useful to train using reagents of defined reactivity,
which are easily available and which provide security problems. An ideal
115
116
Practical
Exercises
system is to use an imrnunoglobulin (Ig) and more particularly an immunoglobulin G (IgG) as an antigen. Do not get confused here, since you
have learned that the antibody population contains high levels of IgG
acting as antibody. In the context of learning the principles, we are using
IgG as an antigenic protein, since:
1. IgG from one animal species can be injected into another animal species so
that a specific antiserum to that IgG is prepared.
2. Such antibodies can be labeled with enzyme, or detected with a second
species-specific antibody labeled with enzyme.
Such reagents are defined, easy to standardize, stable, and available
commercially. The particular IgG system chosen in most of the chapters
involves guinea pig, but similar tests can be performed with other species IgG using the appropriate antispecies reagents. The practical elements of all the assays are very similar, i.e., reagents and equipment
needed. The systems described are analogous to the ones most commonly
used to examine problems associated with diagnosis.
The schemes will be described using symbols where:
I- = solid phase microtiter plate well
Ag = antigen
Agl, Ag2, etc. = particular antigens highlighted in assay
I-Ag = antigen passively adsorbed onto wells
I-Ab, I-AB = particular antibodies passively coated onto wells
Ab = antibody
AB = antibody from a different species to Ab
Abx, Aby = different antibodies identified by subscript letters
Anti-Ab = antispecies specific antibody (against species in which Ab was
produced)
Anti-Ab*E = antispecies specific antibody labeled with enzyme
W = washing step, involving separation of bound and free reagents
+ = addition of reagents and incubation step
S = substratekhromophore addition
Read = read test in spectrophotometer at 492 nm
Throughout
Chapters 5-8, many of the practical stages are the same.
The conjugates described are all made with horseradish peroxidase and
the substratekhromophore is hydrogen peroxide/orthophenylamine diamine
(OPD). The preparation and use of this is described in detail below.
1. Substratekhromophore: This is easiest made up from commercial tablets
of OPD that are preweighed. Commercial sources also supply citrate/phos-
Test Schemes
2.
3.
4.
5.
117
phate buffer tablets (pH 5.0). Thus, the volume of OPD can be made as
required by following the recommendations by the supplier. As an example,
30 mg tablets are available that make 75 mL of chromophore solution in
buffer. Unused OPD solution (without added hydrogen peroxide) can be
frozen at -20°C. This can then be thawed and used later. Close inspection
should be made to ensure that the OPD is not drscolored. Use complete
chromophore/substrate as soon as possible.
Larger volumes of OPD in citrate/phosphate buffer can be made and
frozen in a tightly stoppered brown bottle in small volumes. The OPD
solution should be made and frozen as quickly as possible. Do not use
solutions that show discoloration after freezing.
Hydrogen peroxide (HzO,) is the substrate for horseradish peroxidase
enzyme. This is purchased usually as 30 or 6% w/v and should be stored as
recommended by the supplier. The hydrogen peroxide should be kept
refrigerated and not subjected to heating. The addition of the hydrogen
peroxide should be made immediately before the use of the OPD in the
test. Add 5 PL of hydrogen peroxide (30% w/v) to every 10 mL of OPD
solution (pH 5.0), or 25 pL of 6% hydrogen peroxide to every 10 mL of
OPD solution. Use the substrate/chromophore immediately. OPD is a
mutagen, so care is needed in its handling and disposal.
Washing solution used in washing steps: This is PBS without the addition
of Tween 20. Washing requires the flooding and emptying of wells 4 times
with PBS.
Blocking buffer: This is PBS containing a final concentration of 1% bovine
serum albumin (BSA) and 0.05% Tween 20. This should be made in small
volumes as required, but can be stored at 4°C. Care should be taken to
avoid contaminated buffer.
Stopping solution: This 1M sulfuric acid in water. Care should be taken in
its preparation and handling.
Read: This implies reading plates using a multichannel spectrophotometer
at the appropriate wavelength for the color developing in the ELISA. In all
cases for Chapters 5-8, this is 492 nm for OPD. Plates should also be
assessedby eye to ascertain whether the test results are as expected.
CHAPTER6
Indirect
ELISA
1. Learning
Principles
1. Measure optimal antigenconcentrationto coat wells;
2. Titration of antisera;and
3. Use of antispeciesconjugates.
1.1. Reaction
I-Ag
+
Ab
+
Anti-Ab*E
w
W
I- = Microplate wells
Scheme
+ S + Read
W
Ag = Guinea pig IgG adsorbed to wells
Ab = Rabbit antiguineapig serum
Anti-Ab*E = Goat antirabbit serumconjugatedwith horseradishperoxidase
S = Hz02 + orthophenylenediamlne (OPD)
Read= Observeby eye or readin spectrophotometer
+ = Addition and incubation at 37’C or room temperaturefor 1 h
W = Washwells with PBS
2. Basis of Assay
The basis of this assay is to titrate antibodies that have reacted with an
antigen by using an antispecies conjugate. The indirect aspect, therefore,
refers to the fact that the specific antiserum against the antigen is not
labeled with an enzyme, but a second antibody specific for the particular
species in which the first antibody was produced is labeled. Such assays
offer flexibility and form the bases of other ELISAs. In principle, the
optimization of reagents is similar to the direct ELISA. However, three
factors have to be considered:
1. The optimal dilution of antigen.
2. The optimal dilutions of antisera.
3. The optimal dilution of conjugate.
Point 3. has been dealt with for the direct ELISA. You should now be
able to titrate the conjugate (antirabbit in this case).The major use of
131
Indirect
132
ELBA
indirect ELISA is to titrate antibodies against specific antigens. In this
case, a constant amount of antigen is adsorbed to wells, and antisera are
titrated against this as dilution ranges. Any antibody reacting is then
detected by addition of a constant amount of antispecies conjugate. Such
assays can be evaluated fully from the diagnostic point of view where
numbers of field and experimental antisera (known history) are available. Therefore, they can be used to assay single dilutions of antisera,
and tests can be adequately controlled using standard positive and negative antisera. Thus, the indirect ELISA has found many applications in
epidemiological studies assessing disease status.
3. Materials
and Reagents
1. Antigen (Ag) = guineapig IgG at 1 mg/mL (1 g/L).
2. Antibody (Ab) = rabbit antiguineapig serum.
3. Anti-antibody*E = sheepantirabbit serum linked to horseradishperoxidase(rabbit IgG neededif conjugatetitration not made),as for titration of
antiguineapig conjugate).
4. Microplates.
5. Multichannel and single-channelpipets.
6. 10 and 1 mL pipets.
7. Carbonate/bicarbonatebuffer, pH 9.6,0.05M.
8. PBS containing 1% bovine serumand 0.05% Tween 20.
9. Solution of OPD in citrate buffer.
10. Bottle hydrogenperoxide (30% w/v).
11. Washing solution (PBS) in bottle or reservoir.
12. 1M sulfuric acid in water.
13. Papertowels.
14. Small-volume bottles.
15. Multichannel spectrophotometer.
16. Clock.
17. Graph paper.
4. Practical
The first stage in this assay involves the titration of the antispecies
conjugate under the conditions described in the direct ELISA. Remember that the antigen used to titrate the conjugate must be appropriate,
e.g., if an antibovine conjugate is to be used, then use bovine serum as
the antigen in the original chessboard, If an antibovine IgG detection is
required, then use bovine IgG as the antigen in the direct ELISA chessboard titration. The antirabbit conjugate needs to be titrated so that we
Practical
133
know the dilution to use in the indirect assay in order to detect any reacted
rabbit serum (the optimal dilution of conjugate may be given in class if
this procedure has not been carried out). Thus:
1. Titrate the antirabbit conjugate (optimum dilution may be given).
2. Take microtiter plate with Al at the top left-hand comer. Add 50 FL of
carbonate/bicarbonate buffer to each well using a multichannel pipet.
3. Make a dilution range of the guinea pig IgG from 5 l.tg/rnL from column 1
(8 wells) to column 11. This is made exactly as described for the direct
ELISA. Add 50 pL of the guinea pig IgG at 10 p.g/rnL (or l/50 if concentration unknown) to column 1. Mix (pipet up and down eight times with
the multichannel), then transfer 50 pL to column 2, mix, and continue transfer to column 11. Discard 50 l,tL remaining in tips after mixing in column 11.
Thus, we have a twofold dilution range of IgG in each row A-H, excluding
column 12 wells.
4. Incubate at room temperature or 37OCfor 2 h.
5. Wash the wells in PBS (fill and empty wells four times).
6. Blot the plates.
7. Take the rabbit antiguinea pig serum, and dilute it to l/50 in blocking buffer
(PBS containing 1% BSA and 0.05% Tween 20). Make up 1 mL. Therefore, add 20 p.L to 1 mL of buffer.
8. Add 50 p,L blocking buffer to all wells using a multichannel.
9. Add 50 ~.LLof the l/50 antiguinea pig serum to each well of row A. Mix
and transfer 50 l,tL to row B, mix, and transfer 50 l.tL to row C, and repeat
this procedure to row H. We now have a twofold dilution series of antibody the opposite way to the IgG antigen.
10. Incubate the plate at room temperature or 37OCfor 1 h.
11. Wash and blot the plate.
12. Make up the antispecies conjugate (kept at -20°C) to the optimal dilution
found in the direct ELISA (or as instructed) in,blocking buffer. Make up
enough for all the wells of the plate + 0.5 mL (approx 5.5 mL). This might
appear wasteful, but is convenient practice since it allows for minor errors
in pipeting and avoids having to make up a small volume of conjugate when
one “runs-out” on the last row (i.e., when the exact volume to fill the plate
wells is made up). Add 50 PL of the dilution to each well using the multichannel and a clean trough.
13. Incubate at room temperature or 37OCfor 1 h.
14. Wash and blot the wells.
15. Thaw out the OPD (10 mL). Add 5 pL of HzOz immediately before use.
Mix well. Add 50 pL of this to each well, using multichannel and clean
troughs(make surethat the troughis not contaminatedwith conjugatefrom
previous addition to the plate).
Indirect
134
ELBA
Table 1
Plate Data from Section 4.1.
A
B
C
D
E
F
G
H
1
2
3
4
5
6
7
8
9
10
11
12
1.92
1.94
1.56
1.34
1.14
0.92
0.76
0.45
1.89
1.89
1.43
1.23
1.00
0.83
0.56
0.32
1.92
1.91
1.33
1.14
0.89
0.73
0.42
0.29
1.89
186
1.29
1 09
0.76
0.54
0.36
0.21
1.45
1.47
1.07
0.97
0.56
0.43
0.28
0.17
1.12
1.09
0.89
0 75
0.41
0.32
0.21
0.14
0.89
0.87
0.78
0.68
0.32
0.21
0.19
0.15
0 67
0.59
0.56
0.49
0.23
0.17
018
0.18
0.45
0.39
0.43
0 29
0.19
0.19
0.16
0 16
0.39
0.38
0.32
0.21
0.17
0.16
0.14
0.15
0 40
0.31
023
0.17
0.19
0.16
0.15
0.16
0.39
0.29
0.19
0.15
0.12
0.14
0.15
0.10
16. Incubate for 10 min (note color changes).
17. Stop any color development by adding 50 pL of l.OM sulfuric acid to
each well.
18. Read the plate by eye and at 492 nm by multichannel spectrophotometer
after titration of antigen (guinea pig IgG) and antibody (antiguinea
pig serum).
Table 1 shows the microplate reader results. Note that these produce a
similar picture to the direct ELISA results in Chapter 5, and you should
also have observed that there was a similar development of color throughout the 10 min incubation after addition of the substrate solution.
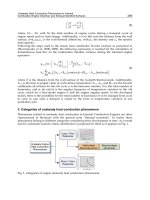
Figure 1 shows the data graphically. Plots relating the concentration
(or dilution) of the IgG (Ag) to the OD for all the different dilutions of
rabbit anti-IgG are shown.
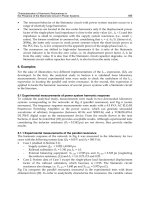
Plot your ELISA data as shown in Fig. 2. Thus, relate the IgG concentration on the plate plotted as a loglo twofold series (pg/rnL/ well, or
dilution if actual concentration is unknown) against the OD for each dilution of antibody used. You should end up with eight lines on a single
graph, one for each antiserum dilution. You have already observed in the
direct assay similar results. Similar areas of reactivity can be identified
on the indirect chessboard.
1. Plateaus of similar high color are shown in rows A and B wells 14.
2. There are higher plate background values m rows A and B (possibly C)
than for more dilute serum.
3. The serum titration
end points (where
OD value for a particular
IgG con-
centration is the same as plate background), are similar for rows A, B, C,
and D. After this dilution of antiserum there is loss in detection of IgG.
Practical
135
0.5
0
1
2
3
4
5
6
7
8
Antibody dilutions L05~(2 fold) +
Fig. 1. Titration curves of antibody for different concentrations of antigen
(IgG) on columns 1-12 of plate.
4. Loss of end pomt detection is matched by a loss m OD at high concentrations of IgG, e.g., m rows F, G, and H at 5 l.tg/mL of IgG, there is substantial and increasing loss in color, as compared to where maximal color (in
antibody excess- row A) is observed. Note that row H hardly titrates the
IgG, with very low color being obtained.
4.1. Optimization
of Reagents
Rows A and B indicate that antibodies are in excess, and there are
some problems of nonspecific attachment to the plate without antigen
having been adsorped (well 12). Note that in these rows the plateau
regions extend to well 4. Thus, no more of the antigen (IgG) is able to
absorb to the plate above the concentration in well 4. Rows C and D give
Indirect
136
01
1
I
I
I
I
I
I
I
I
I
I
2
3
4
5
6
7
8
9
10
11
ELISA
12
Zfold dilution of guinea pig IgG antigen d
-A
+B++C
+D
*E
+F
*G
*H
Fig. 2. Titration of dilution series of guinea pig IgG antigen (l-l 1) against
eight different concentrations (rows A-H) of rabbit antiguinea pig IgG.
Antirabbit conjugate constant.
optimal titrations of the IgG in that maximum values do not exceed 1.6
ODs, and high end point titers are obtained. Below these dilutions, sensitivity for the detection of IgG is lost. Thus, in order to detect the antigen
optimally, to use a single dilution of antiserum under the conditions of
the ELISA described, use a dilution of around l/400-1/800.
The optimum dilution of antigen that might be used as a single dilution to detect and possibly quantify antibodies is best assessed as the
dilution (or concentration) that shows good binding across the whole
range of antiserum dilutions. The best way to illustrate this is to draw a
graph of the plate data, but this time, plot the dilutions of serum against
Use of Indirect
ELISA
137
to Titrate Antibodies
the OD for the various antigen concentrations (or dilutions). This was
done in Fig. 1. At the first four concentrations (dilutions) of antigen
(IgG), there is little difference in the end point detection for the dilutions
of antiserum. After this, the OD readings and the end point detections are
reduced. At the extreme, in column 10, hardly any antibody is detectable
even where the serum is most concentrated. The higher values in row A,
B, and C correspond to the nonspecific binding to the wells seen in row
12. Thus, the dilution of antigen found in columns 3 and 4 is optimal to
detect antibodies.
6. Use of Indirect
ELISA
5.1. Learning
to Titrate
Principles
Antibodies
1. To titrate antibodies from positive sera using full dilution ranges.
2. To establish ELISA negative antibody levels for control nonimmune sera.
3. To duplicate samples tested.
5.2. Reaction
I-Ag
+
w
Ab
+
w
Scheme
Anti-Ab*E
+ S + Read
w
I- = microplate
Ag = optimum concentration of antigen
Ab = test serum + or - in reaction for Ag
Anti-Ab*E = antispecies antibody linked to enzyme
S = substrate/color detection system
W = wash
+ = addition and incubation of reactants
In this exercise, the Ag and anti-Ab*E are used at optimal dilution.
The test or standard Abs are added as dilution ranges.
5.3. Basis of Assay
We are now in the position to titrate antibodies, since we know the
antigen optimum and the conjugate optimum dilutions for our given
system. Thus, if sera are reacted with the antigen on the plate and if they
contain antibodies against the guinea pig IgG, they will be picked up by
the subsequent addition of the conjugate. The seropositive serum titration curves may then be compared to each other and to the seronegative
curves to establish antibody titers and examine the result of nonspecific
reactions at the various dilutions of the negative sera, within the system.
138
1.
2.
3.
4.
5.
6.
7.
8.
9.
10.
11.
12.
13.
14.
15.
16.
17.
Indirect
ELISA
5.4. Materials
and Reagents
Ag = guinea pig IgG, 1 mg/mL
Ab = 3x rabbit serum samples after injection with guinea pig sera test bled
after different times following inoculation and three rabbit sera from antibody-negative animals.
Anti-Ab*E = sheep antirabbit serum linked to horseradish peroxidase.
Microplates.
Multichannel and single-channel pipets.
lo- and 1-mL pipets.
Carbonate/bicarbonate buffer, pH 9.6,0.05M.
PBS containing final concentration 1% BSA and 0.05% Tween 20.
OPD.
Hydrogen peroxide.
Washing solution (PBS).
1M sulfuric acid in water.
Paper towels.
Small-volume bottles/microdilution system.
Multichannel spectrophotometer.
Clock.
Graph paper.
5.5. Practical
5.5.1. Titration of the Antigen Dilution
or Concentration for Use in Measuring Antibodies
This is performed as described in Section 4. l., where we also have
titrated the optimum dilution of conjugate. We are concerned now with
the titration of antibodies against guinea pig IgG in rabbit sera. Therefore,
make the chessboard titration of guinea pig IgG against the positive rabbit antiserum, and use a constant dilution of antirabbit conjugate.
Note that when one is setting-up indirect ELISA, a positive serum
against the particular antigen being detected is needed. Such sera are
often available as determined from other serological assays or from systems whereby specific antibodies are expected, e.g., from experimentally infected or vaccinated animals or from animals during the course of
an outbreak. The exact conditions of the ELISA may therefore have to be
altered during the developmental stages when many sera have been
examined as compared to the originally used positive serum. This will be
further examined below. For now the original “optimal” conditions are
determined using a defined (experimentally derived) positive serum.
Use
of Indirect
ELZSA to Titrate Antibodies
139
1
2
3
4
5
6
7
8
9
10
11
12
5.6. Titration
of Different
Sera
1. Dilute guinea pig IgG (Ag) to optimum concentration in carbonate/bicarbonate buffer, pH 9.5, 0.05M.
2. Add 50 pL to each well of the plate using a multichannel pipet.
3. Incubate at 37°C for 2 h.
4. Wash and blot the plate.
5. Add 50 l.tL of blocking buffer to all wells. Use the multichannel and trough.
6. Take the six sera supplied. Label the three positive sera 1,2, and 3. Label
the three negative sera 4, 5, and 6. Dilute each one to l/20 in blocking
buffer in small bottles. Make up a final volume of 0.5 mL of each (25 +
475 pL blocking buffer).
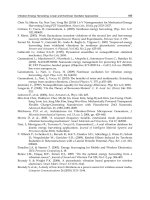
7. Take the plate with 50 l.rL blocking buffer/well. Turn so that well Hl is on
the left-hand top corner (see Fig. 3). Add 50 pL serum 1 dilution to wells
Hl, and H2. Add 50 PL of serum 2 dilution to wells H3 and H4. Add 50 PL
of serum 3 dilution to wells H5 and H6. Repeat the process adding sera 4,
140
Indirect
ELISA
FFFFFFF
HGFEDCBA
Serum 1
Serum 2
Serum 3
00000000
00000000
00000000
00000000
00000000
00000000
1
2
3
4
5
6
7
Serum 4
8
9
Serum 5
10
11
Serum 6
12
Initial dilution
of the sera
Fig. 4. Addition and dilution of sera of plate.
8.
9.
10.
11.
12.
13.
14.
5, and 6, to wells H7, H8, H9, HlO, Hll, and H12. We now have each of
the sera diluted effectively to l/40 in 100 l,tL blocking buffer in the left-hand
extreme row (H) of the plate.
Use the multichannel with 12 tips attached to mix, and dilute the sera across
wells G, F, E, D, C, B, and A, transferring 50 FL of each dilution. We now
have a twofold dilution range of the sera, in duplicate, i.e., there are two
dilution series of each of the sera (see Fig. 4).
Incubate at 37OC or room temperature for 1 h (exact conditions used in
indirect chessboard titration are best).
Wash and blot the plate.
Add 50 pL of antu-abbit conjugate per well (diluted m blockmg buffer).
Incubate at 37°C (or room temperature) for 1 h (conditions as for 1 h incubation in chess-board titration).
Wash and blot the plate.
Add substrate and chromophore (50 pL).
Use of Indirect
ELISA
40
141
to Titrate Antibodies
!
80
160
320
a-fold dilution
640
1280
2560
5120
of sera L--v’
Fig. 5. Plots of datain Table 4 showing titrations of 6 seradiluted from l/40
in a twofold seriesagainstconstantantigen.Mean values of OD areused. l-6
are different serum samples.
15. Stop color developmentafter 10 min.
16. Read the plate in the multichannel spectrophotometerat 492 nm.
Note: Remember to watch the plate as the color develops and make
relevant notes.
5.6.1. Data Explained
Figure 5 shows typical results from this assay. (The OD readings are
shown in Table 2).
Examine serum 1: Note that the values of the duplicate samples are
very similar. The titration shows a plateau region where the values are
the same (wells Hl and 2, and wells Gl and 2). Thus, there \is a maximum color obtained up to l/80; increasing the concentration of antibodies has no effect on the readings. This represents the region where all the
Indirect
142
ELBA
Table 2
Plate Data from Section 5.5.
12
A
B
C
D
E
F
G
H
3
0.34
0.54
0.87
1.16
145
1.68
1.76
179
Sera
0.32
0.56
0.91
1.14
1.49
1.70
1.73
1.76
1
456789
0.19
0.34
054
0.76
0.95
115
1.34
1.56
0.23
0.36
0.57
072
0.91
1.17
1.32
1.54
2
0.14
0.17
0.18
0.28
0.31
0.43
0.65
0.78
0.15
0.19
0.19
0.25
0.32
046
0.66
0.76
3
0.17
0.14
0.14
0.17
0.15
0.13
023
0.31
0.16
0.14
0 17
0.16
0.14
0.15
0.24
0.32
4
0.15
0.16
0.17
0 18
0.17
0.14
0 18
0.28
10
11
12
0.16
0.18
0 16
0 16
0.15
0.15
0.17
0.24
0.19
0.16
0.17
0.17
0.14
0.10
0.15
0.21
0.15
0.14
0.14
0.19
0.17
0.18
0.17
023
5
Dilution
5120
2560
1280
640
320
160
80
40
6
antigen is saturated with antibody. The value of the OD is dependent on
the amount of antigen that has attached to the wells, which in turn is
dependent on the adsorption characteristics of the plastic and the concentration of antigen. On further dilution, the antibodies are no longer in
excess,so they aretitrated as seenby a gradual decreasein the OD observed.
Serum 2: Note that the OD levels even at l/40 are not equal to those
where we had antibody excess in serum 1. Thus, the antibodies are not
saturating the antigen on the wells, thus are not present in excess. The
titration of the serum begins immediately on dilution. Note that the last
dilutions give low OD values equivalent to the plate background, unlike
serum 1.
Serum 3: Even at l/40, we have low OD values as compared to the
serum samples 1 and 2. There are fewer antibodies in this serum than in
the other two! Again the titration begins immediately on dilution and the
low OD (around 0.19) is attained at l/1280. Overall, these three positive
sera can be seen to have different reactivities in terms of the quantity of
antibody titrated. Thus, serum 1 has the highest titer, showing a plateau
(is able to saturate the antigen). Serum 2 has the next highest amount of
antibodies, since it has an end point around l/5120 (point where OD
equals the plate background). Serum 3 has the lowest amount of antibody, with an end point of around l/1280.
Serum 4: This is a negative serum (clinically). Therefore, by definition
it should contain no antibodies. The color obtained reflects the nonspecific
attachment of the serum to the antigen. Most nonspecific “sticking” might
be expected in the least dilute sample. This is what is found here, with
Use of Indirect
ELISA
143
to Titrate Antibodies
2.0
1.5
E3
3
3
n
1.0
0
0.5
background
0
OD
I
I
Dilution
I
I
I
I
of serum (Loglo ) e
Fig. 6. Serum titration curve showing sigmoidal nature.
background levels being found at l/40 and l/80 serum dilutions. Note
that the levels of nonspecific color are much lower than in the positive sera,
but are distinct from the assumed plate background, which can be taken
as the backgrounds observed for the negative sera at their highest dilution. Note that such wells as (E, D, C, B, and A) give similar results, and
no titration is observed on dilution, Sera 5 and 6 give similar results to
serum 4, although there is a lower amount of color in the l/80 wells,
reflecting different amounts of nonspecific adsorption of serum proteins.
5.6.2. Curve Shapes
The plotted data, particularly for the positive sera, produces curves
rather than straight lines, Generally, there is a region on this curve that
contains three to five points that are more linear than the rest. The nonlinear
regions occur at the top and the bottom of the graphs (see Fig. 6). Such
Indirect
ELISA
sigmoidal curves are typical of serum titrations. Note that the more linear regions of the positive serum titration curves are parallel. Note also
that the end point determinations are difficult to assess exactly, since
there is a pronounced “tail” at the low OD end of the results.
5.6.3. Comparison
of Serum Titration
Curves
The amount of specific antibody in each serum has been titrated over a
dilution range. The serum containing the most antibodies will have a
higher dilution end point (dilution where the OD is the same as the background OD). Thus, as indicated above, the end points may be compared
as representing the titer of the sera. This can be assessedby eye, as well
as by machine reading.
A better estimate of the end point is made by drawing a straight line
through the points on the curves that are nearly in a straight line. If this
was done statistically, then a regression analysis of the points would be
made and the best line of fit would be given mathematically.
Graphically, this may be approximated to sufficient accuracy (see Fig.
7). Thus, the end points are assessedwhen the regression lines (or graphically produced lines) cut the measuredbackground OD line. This assumes
that the curves are similar shapes (the lines are then parallel). This may
not always be the case, since different antibody populations may be
responsible for the ELISA color (seeFig. 8). In this case, it must be noted
and taken into account when the implications of the titers found are considered. Note that the curves obtained for the negatives above arevery flat,
even so they have an end point. Sera may also show differences in maximum plateau heights (seeFig. 8).
Figure 9 attempts to explain why there are differences in plateau
heights for different sera. Here several sera are reacting maximally with
the antigen, since on increasing their concentration, there is no increase
in color. The plateau heights are different, however, showing that different weights of antibody have reacted with the same antigen for particular
sera. This is a function of the number of reactive antigenic sites on the
antigen and the quantities and specificities of the antibody populations in
the sera. Although this is uncommon using polyclonal antibodies, it is
common when using monoclonal antibodies.
Where the curves are parallel, any point can be taken on them for comparison of samples. This is illustrated in Fig. 10. Analysis of as many
sera as possible over full dilution series and examination of the curves
Use of Indirect
ELISA
145
to Titrate Antibodies
Points
Background
I
X to Y regressed
OD
I
I
I
I
I
Dilution of serum(Logt,,) 2 fold
Fig. 7. Regression of points in a serum titration to obtain a titer at the intersection of the background OD.
should be made to establish whether there is parallelism. This is important where “spot tests” are required, so that a single dilution of test sample
can be established. The dilution can be taken where samples give results
in the parallel regions of curves.
A line is drawn at a particular OD, and the dilution of serum giving
this OD for all the sera is determined, thus giving relative titers. Such
relative titers may be expressed compared to an accepted standard serum,
which in turn can be given in any units. The actual activity of the standard serum may be known, e.g., number of j,tg/rnL specific antibody, so
that all the sera compared to this can be expressed in the same units.
5.7. Negative Sera and Control Sera
The test made involved only one control, that of negative sera. Ideally,
a plate background should be included to measure the color in wells with
Indirect
146
ELBA
2
1.5
8
R
d
1.0
Q
0.5
0
Antibody
dilution
(LoglO
) 2 fold
4
Fig. 8. Variation in sigmoidal curves for serum titrations.
antigen and conjugate only. This should correspondto the readings beyond
the titration of the antibodies, observed when a low plateau is obtained
even on dilution of the samples. Such backgrounds can be subtractedfrom
the whole-plate results before any processing of the data, or used to blank
the spectrophotometerbefore reading. The treatment of the negative serum
results depends on what is known about the negativity in terms of other
tests and clinical findings, e.g., British cattle are ideal as negative sera
when studying antifoot-and-mouth disease antisera, since Britain is disease-free. This may not always be possible in countries where disease is
endemic. Note also that control negative sera obtained from other countries may not reflect the same negative population of another country,
since there are breed differences, complications owing to other infections, and so on. This could affect the performance of kits where standard negative sera are supplied to act as controls in the ELISA. Kits must
be evaluated, wherever possible, in the country where they are to be used.
Use of Indirect
ELISA
to Titrate
Antibodies
147
Antibodies present in serum
Serum 1
Serum 2
s>
>
-c
CI
Maximum 8 molecules bind
Maximum 4 molecules bind
Fig. 9. Diagram to represent maximum number of molecules of antibody that
can bind to antigens. Difference in plateau heights can be attributed to different
populations of antibodies in sera.
The control value for the negative serum supplied may not reflect the
mean value for “negative” sera. The immunological implications are
dealt with earlier.
57.1. Selection of a Single Serum Dilution
to Perform a “Spot-Test”
Examination of the serum titration curves for positive and negative
sera can tell us which dilution might be suitable to use in the indirect
ELISA so that antibodies may be assayed on single wells (or multiple
wells using the same dilution). Thus, as shown in Fig. 5, we observe that
there is low nonspecific activity seen in the negative sera at l/40 and
l/80. The positive sera still show high OD values at these dilutions, so
that the relative sensitivity of the assay (detection of specific anti-
148
Indirect
oL
1
2
3
4
5
Dilution
sera -A
4
Titres obtained
dropping
perpendiculars
to x axis
7
8
9
10
11
ELISA
12
of sera
+ B *C
*D
Fig. 10. Comparison of serum titratton curves to standardserum titration at
threepoints (OD values 1, 2, and 3 m parallel regionsof curves).Titers can be
readfrom x axis and related(representedby gray lines).
bodies) can be made at such dilutions. However, if dilutions greater
than l/80 are used, we can still measure antibody in the absence of
nonspecific reactions. The sensitivity does drop, however. Remember
that we are trying to balance sensitivity with low background in the presence of other serum proteins in the sample. If we had used the sera only
at l/160, then we would have had values for the ELISA as shown in
Table 3.
The negative sera levels are therefore, around 0.15, whereas all the
positive sera are above this value. The next exercise will expand on this
approach.
Indirect
ELISA
to Determine the Positivity
of Sera
149
Table 3
Mean ODJg2of Antiguinea
Pig Seraat l/160 Dilution
OD
Serum
1
1.69
2
3
4
5
6
1.16
0.45
0.14
0.15
0.17
From Table 2.
6. Use of Indirect
ELISA to Determine
the Positivity
of Sera at Single Dilution
6.1. Learning
Principles
1. To examme negative serum populations for establishing OD limits of
negativity;
2. To examine antibody-positive serum populations; and
3. To examine frequency of results in a population.
I-Ag
+
6.2. Reaction
Scheme
+ S + Read
Ab
+ Anti-Ab*E
W
W
w
I- = microplate
Ag = optimum concentration of antigen
Ab = test sera at single dilution
AntiAb*E = antispecies antibody linked to enzyme
S = substrate/color detection system
In this exercise, we use Ag and anti-Ab*E at optimal dilutions. The
test sera are added at a constant dilution. Control-positive antisera can be
added at a constant dilution or as a dilution range to produce a standard
curve relating color to dilution or concentration of antibodies added.
Thus, the test sera can be related to the positive serum titration curve.
The samecan be doneby including acceptednegative control serastandards.
6.3. Materials
and Reagents
1. Ag = guinea pig IgG 1 mg/mL (or previously titrated).
2. Ab = 48 rabbit sera, including high, moderate, and low titer againstguinea
pig IgG (24) and negative sera (24).
Indirect
3.
4.
5.
6.
7.
8.
9.
10.
11.
12.
13.
14.
15.
16.
17.
18.
ELISA
Anti-Ab*E = sheep antirabbit serum linked to horseradish peroxidase.
Microplates.
Multichannel and single-channel pipets.
lo- and 1-mI. pipets.
Carbonate/bicarbonate buffer.
PBS containing 1% BSA, 0.05% Tween 20.
OPD solution.
Hydrogen peroxide.
Washing solution.
Paper towels.
1M sulfuric acid in water.
Small-volume bottles/microdilution equipment.
Multichannel spectrophotometer.
Clock.
Graph paper.
Calculator.
6.4. Practical
From earlier exercises, you should have assessed the dilution of test
serum that can be used to discriminate between positive and negative
nonspecific results, based on the difference noted between the selected
positive and negative sera titrated over full dilution ranges. We are going
to titrate all the sera at the dilution found as duplicates (2 wells/serum
dilution in the indirect ELISA).
1. Add the guinea pig IgG to the wells of a microtiter plate at optimum dilution (as in earlier exercises). Incubate at 37°C for 2 h (or under particular
optimal conditions).
2. Wash and blot the plate.
3. Dilute the test serum samples appropriately in blocking buffer. Sera may
be diluted into small volume bottles. However, this causes two problems:
a. Manipulation (capping, and so on) is laborious; and
b. Transfer of serum dilutions must be made with a single-channel prpet.
Point (b) is important since it takes a long time to transfer all the sera
to the different wells. The initially added samples will therefore receive
a longer contact time with the antigen, and this may well affect the results.
This can be avoided if the samples are transferred to other plates before
dilution, e.g., plastic non-ELISA rnicrotiter plates in volumes that need
not be accurate. The plate can then be sampled using a multichannel pipet
if the dilution factor for the serais not too high. The initial dilution could
Indirect
ELISA
to Determine the Positivity
of Sera
151
Samples
A
1-12
13-24
2536
37-48
6
C
D
E
F
G
H
00000000000
00000000000
000000
00000
00000000000
00000000000
00000000000
00000000000
00000000000
Fig. 11. Use of micronics systemfor dilution of samples.Order of samples.
be made directly into, say, 100 l.tL of blocking buffer in the non-ELISA
plates. The transfer of the required volume of the diluted test sample can
then be effected using a multichannel pipet. Thus, the samples are transferred at approximately the same time.
Special systems have been developed for use with multichannel pipets.
These are ideal for the dilution and storage of test samples. Volumes of
about 1 mL can be made up making the accurate dilution of up to l/200
(5 FL sample/ml) easy. The microtiter dilution system should be available for this exercise.
Add a volume of blocking buffer to the plastic tubes held in the tube
holder, e.g., if a dilution of l/100 is required, add 0.5 mL of blocking
buffer/tube, then add 5 PL of test sample. If a l/80 dilution is required,
see Fig. 11 for pattern of samples on plate.
6.4.1. Example of Data
Typical results are shown in Table 4. The results obtained in your specific assay can be processed in the same way. Figure 12 shows a representation of a stopped plate.
Since duplicates have been made, examine the variation between the values. This should not be high, i.e., there should be little difference between the
ODs for both test wells of the samesample.Take the mean(averageresult) of
the OD from both wells if the difference is not large. Variation in results will
be discussedlater in the text. Take the mean value to two decimal places.