material flow analysis of phosphorous and chemical oxygen demand in domestic wastewater and food waste in song cong town, vietnam
Bạn đang xem bản rút gọn của tài liệu. Xem và tải ngay bản đầy đủ của tài liệu tại đây (3.2 MB, 82 trang )
THAI NGUYEN UNIVERITY
UNIVERSITY OF AGRICULTURE AND FORESTRY
PHAM MY ANH
TOPIC TITLE:
MATERIAL FLOW ANALYSIS OF PHOSPHOROUS AND CHEMICAL
OXYGEN DEMAND IN DOMESTIC WASTEWATER AND FOOD WASTE IN
SONG CONG TOWN, VIETNAM
BACHELOR THESIS
Study Mode : Full-time
Major
: Environmental Science and Management
Faculty
: International Training and Development Center
Batch
: 2011-2016
Thai Nguyen, 30/06/2015
Thai Nguyen University of Agriculture and Forestry
Degree Program:
Bachelor of Environmental Science and Management
Student name:
Pham My Anh
Student ID:
DTN 1153170001
“MATERIAL FLOW ANALYSIS OF PHOSPHOROUS
Thesis Title:
AND CHEMICAL OXYGEN DEMAND IN DOMESTIC
WASTEWATER AND FOOD WASTE IN SONG CONG
TOWN, VIETNAM”
Supervisor:
Nguyen Huu Tho, PhD.
Abstract:
Vietnam’s fast economic growth has to a large extent been achieved on the
expense of a rapid deterioration of the natural environment, including
eutrophication of local water sources. Proper planning is needed to move towards
a sustainable wastewater management and one recognized tool for such planning
is material flow analysis (MFA).
This thesis uses MFA to define the current flows of phosphorus (P) and organic
matter, measured as COD, in domestic wastewater and food waste in Song Cong
town, Thai Nguyen province, Vietnam. The aim is further to compare two different
improved wastewater management scenarios with a business-as-usual scenario. The
methods used to find data for the MFA are literature review, interviews and a survey
questionnaire. The literature review presents challenges facing the wastewater sector
of Vietnam and treatment techniques for wastewater and septage.
The wastewater sector is affected by technical difficulties such as lack of capacity and
organizational challenges as a result of adjacent and overlapping authorities.
Contradictions and gaps in legislation, poor governance, and problems with financing
are all issues that need to be addressed.
Although the number of wastewater treatment plants in Vietnam is increasing,
ii
not more than 10% of the wastewater is being treated. Various techniques are
tried out in Vietnam, among others constructed treatment wetlands and activated
sludge
techniques,
such
as
Sequencing
Batch
Reactors
and
Anaerobic/Anoxic/Oxic processes. These and other techniques are explained and
compared in the literature review.
From the gathered data three future scenarios for Song Cong’s wastewater and food
waste treatment were created along with one of the current situation. The future
business-as-usual scenario (BAU-2030) shows the development in Song Cong if no
changes are implemented before year 2030, while the centralized scenario (CTP2030) redirects flows of wastewater to a conventional chemical/biological treatment
plant. The third scenario, semi-centralized (STP-2030), implements one treatment
plant with enhanced biological phosphate removal (EBPR) followed by a constructed
treatment wetland, and a bigger EBPR plant followed by disinfection. Both of the
improved scenarios also use food waste and sludge to produce biogas and digit ate
that can be used as compost in agriculture.
The results of the MFA indicate that if nothing is done to change the current
management, a 24% increase of pollutants to the Song Cong is imminent in just 15
years. In addition, if one of the improved scenarios is implemented, 92% (CTP- 2030)
or 90% (STP-2030) of the P will be available for reuse in agriculture, reducing the
need for artificial fertilizer. Further biogas is produced, which can substitute
petroleum based gas for domestic purposes or be used to generate electricity.
Wastewater, Material flow analysis (MFA),
Keywords
Phosphorus (P), Chemical oxygen demand (COD).
Number of pages
52 pages
Date of submission
30/09/2015
Supervisor signature
iii
ACKNOWLEDGEMENT
My bachelor thesis in environmental engineering at Thai Nguyen University of
Agriculture and Forestry, Viet Nam. The thesis is part of a partnership project between
the municipality of Linköping, Sweden, and the Thai Nguyen province, Vietnam. The
overall aim of the partnership is to achieve a democratic and transparent planning
process, involving stakeholders at different levels in the field of wastewater and
organic waste management in Song Cong town. This includes giving stakeholders new
methods and tools for a participatory planning process.
Foremost, I would like to express my sincere gratitude to my supervisor:
Nguyen Huu Tho, PhD of Department of Science Management and International
Relation, Thai Nguyen University of Agriculture and Forestry (TUAF), Viet Nam for
giving permission to accomplish my Bachelor thesis there, and also his constant
motivating supervision during my studies in the research group of Sweden.
I wish to express my thanks to Mr. Duong Manh Cuong of Faculty of
Biotechnology and Food Technology, (TUAF), Viet Nam for support, help, and
encouragement, advise me during visit to Song Cong town.
Besides my supervisors, most of all thank Mr. Olli Sammalisto and
Ms. Zanna Sefane at the University of Gävle, Sweden for helping, giving necessary
advices and guidance, support me during doing the experiment and completing my
thesis.
Last but not least, I would like to say thankful my family and good friends who
encourage and backing me unceasingly.
Thank you so much!
Thai Nguyen, October 2015
Sincerely,
Pham My Anh
iv
TABLE OF CONTENTS
ACKNOWLEDGEMENT .......................................................................................... iv
TABLE OF CONTENTS ............................................................................................. v
LIST OF FIGURES ...................................................................................................... 1
LIST OF TABLES ........................................................................................................ 3
LIST OF ABBREVIATIONS ...................................................................................... 4
PART I. INTRODUCTION ......................................................................................... 5
1.1. Research rationale .............................................................................................. 5
1.2. Research’s objectives ......................................................................................... 6
1.3. Research questions ............................................................................................. 6
1.4. Limitation of the research ................................................................................. 6
PART II. LITERATURE REVIEW ........................................................................... 7
2.1. Challenges in the Vietnamese Wastewater Sector .......................................... 7
2.2. Wastewater Treatment Solutions in Vietnam ................................................. 8
2.3. Conventional Wastewater Treatment Plants .................................................. 9
2.4. Activated Sludge Techniques ............................................................................ 9
2.4.1. Enhanced Biological Phosphorus Removal ........................................................... 10
2.4.2. Sequencing Batch Reactor ...................................................................................... 11
2.5. Compilation of P and COD Removal Efficiency in WWTP ........................ 11
2.6. Constructed Treatment Wetlands .................................................................. 13
2.6.1. Free Water Surface (FWS) Wetlands ...................................................................... 14
2.6.2. Floating Treatment Wetlands (FTW) ...................................................................... 14
2.6.3. Subsurface Flows (SSF) .......................................................................................... 14
2.6.4. Hybrids .................................................................................................................... 15
v
2.7. Compilation of P and COD Removal Efficiency in Constructed Treatment
Wetlands................................................................................................................... 15
2.8. Further Comparison of the Wastewater Treatment Techniques ................ 16
2.9. Sludge and Food Waste Treatment ................................................................ 19
PART III. METHODS ............................................................................................... 20
3.1. Survey Questionnaire....................................................................................... 20
3.1.1. Sampling method ..................................................................................................... 21
3.1.2. Compilation of the Survey Results ......................................................................... 21
3.2. Scenario Development ..................................................................................... 22
3.3. MFA ................................................................................................................... 22
3.3.1. MFA Terminology ................................................................................................... 22
3.3.2. Mass Flow and Stock Change Quantification ......................................................... 23
3.3.3. MFA in STAN .......................................................................................................... 25
PART IV. RESULTS .................................................................................................. 26
4.1. Survey Results and Scenario Development ................................................... 26
4.1.1. The Survey Results .................................................................................................. 26
4.1.2. MFA Processes ........................................................................................................ 26
4.2. Background Data on Song Cong Town .......................................................... 30
4.3. Current Wastewater Management in Song Cong ......................................... 31
4.4. Future Wastewater Management in Song Cong ........................................... 32
4.5. Scenario Descriptions ...................................................................................... 34
4.5.1. Baseline Scenario (BLS-2015) ................................................................................ 34
4.5.2. Business as Usual (BAU-2030) ............................................................................... 36
4.5.3. Centralized Treatment Plant (CTP-2030) ............................................................... 36
4.5.4. Semi-centralized Treatment Plant (STP-2030) ....................................................... 36
4.5.5. Semi-centralized Treatment Plant (STP-2030) ....................................................... 37
vi
4.6. Material Flow Analysis of Song Cong ............................................................ 37
4.6.1. Baseline Scenario (BLS-2015) ................................................................................ 38
4.6.2. Business as Usual (BAU-2030) ............................................................................... 40
4.6.3. Centralized Treatment Plant (CTP-2030) ............................................................... 41
4.6.4. Semi-centralized Treatment Plant (STP-2030) ....................................................... 43
4.7. Compilation of the MFA results ..................................................................... 45
PART V. DISCUSSION AND CONCLUSION ....................................................... 47
5.1. Discussions. ....................................................................................................... 47
5.1.1. Analysis of the MFA Results................................................................................... 47
5.1.2. Scenario discussion ................................................................................................. 47
5.1.2. Implementation Challenges ..................................................................................... 49
5.1.3. Sources of Error ...................................................................................................... 50
5.2. Conclusion ......................................................................................................... 51
5.2.1. Conclusions. ............................................................................................................ 51
5.2.2. Future Studies ......................................................................................................... 51
REFERENCES ........................................................................................................... 53
Appendix A. Parameters for import of P to inhabitants ........................................ 59
Appendix B. Requested data from Song Cong town authorities ........................... 61
Appendix C. Interview questions .............................................................................. 63
Appendix D. Song Cong survey ................................................................................. 64
Appendix E. Survey results ................................. Ошибка! Закладка не определена.
Appendix F. Quantification of the confidence interval ........................................... 68
Appendix G. Modified parameters in the BAU-2030, CTP- 2030 and STP-2030
scenarios ..................................................................................................... 69
Appendix H. Parameters used in the MFA .............................................................. 71
vii
LIST OF FIGURES
Figure 1. The steps of the different EBPR treatment processes, showing
Anaerobic/Oxic (A/O) at the top, Anaerobic/Anoxic/Oxic (A2O) in
the middle and University of Cape Town (UCT) at the bottom. ........ 11
Figure 2. STAN flowchart showing the processes involved in the treatment of
Song Cong’s wastewater and food waste. .......................................... 30
Figure 3. The six urban wards of Song Cong town, with the Cong River running
in the east. ........................................................................................... 31
Figure 4. Wastewater canal in Bach Quang ward, Song Cong. ......................... 32
Figure 5. Detail planned map of future Song Cong. Three locations have been
identified by local authorities as suitable for construction of
wastewater treatment plants, location 1, 2 and 3. ............................... 33
Figure 6. Solid waste collection in Song Cong town. ........................................ 35
Figure 7. Flowchart of P in the Baseline Scenario (BLS-2015). ....................... 38
Figure 8. Flowchart of COD in the Baseline Scenario (BLS-2015). ................. 39
Figure 9. Flowchart of P in the Business as Usual (BAU-2030) scenario......... 40
Figure 10. Flowchart of COD in the Business as Usual (BAU-2030) scenario. 41
Figure 11. Flowchart of P in the Centralized Treatment Plant (CTP-2030)
scenario. .............................................................................................. 42
Figure 12. Flowchart of COD in the Centralized Treatment Plant (CTP-2030)
scenario. .............................................................................................. 43
1
Figure 13. Flowchart of P in the Semi-centralized Treatment Plant (STP-2030)
scenario ............................................................................................... 44
Figure 14. Flowchart of COD in the Semi-centralized Treatment Plant (STP2030) scenario. .................................................................................... 45
Figure 15. Summary of the results for P flows to each export destination for all
scenarios. The BLS-2015 scenario is included to show the difference
from the future improved and unimproved scenarios. ........................ 46
Figure 16. Summary of the results for COD flows to each export destination for
all scenarios. The BLS-2015 scenario is included to show the
difference from the future improved and unimproved scenarios ....... 46
2
LIST OF TABLES
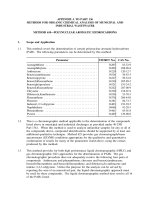
Table 1. Removal rates of P in WWTP based on different literature sources, ranging
from 25 % to 95 % ......................................................................................................13
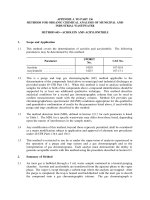
Table 2. Removal rates of COD in WWTP based on different literature sources,
ranging from 76 % to 97% .........................................................................................14
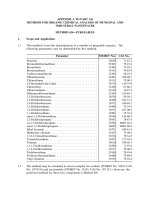
Table 3. Removal rates of P in wetlands based on different literature sources, ranging
from 41% to 84% .......................................................................................................16
Table 4. Removal rates of COD in wetlands based on different literature sources,
ranging from 45% to 93% ..........................................................................................17
Table 5. Comparison between the biological wastewater treatment techniques (Tilley
et al., 2014) ................................................................................................................19
Table 6. Terminology used in MFA (Brunner & Rechberger, 2003) .......................25
Table 7. List and description of the MFA processes involved in the treatment of Song
Cong’s wastewater and food waste ...........................................................................29
3
LIST OF ABBREVIATIONS
A/O
Anaerobic/Oxic
A2 O
Anaerobic/Anoxic/Oxic
AS
Activated sludge
BAU
Business as usual
COD
Chemical oxygen demand
CTP
Centralized treatment plant
CW
Constructed wetland
STP
Semi-centralized treatment plant
EBPR
Enhanced biological phosphorus removal
ECPS
Environmental Cooperation and Public Work of SongCong
FDI
Foreign direct investment
FTW
Floating treatment wetland
FWS
Free water subsurface
HLR
Hydraulic loading rate
HRT
Hydraulic retention time
HSSF
Horizontal subsurface flow
MFA
Material flow analysis
N
Nitrogen
NGO
Non-governmental organization
P
Phosphorus
PAO
Phosphorus accumulating organisms
SBR
Sequencing batch reactor
SSF
Subsurface flow
TEUC
Thai Nguyen Environment and Urban Works Joint Stock
Company (author’s abbreviation)
UCT
University of Cape Town
VFA
Volatile fatty acids
VSSF
Vertical subsurface flow
WWTP
Wastewater treatment plant
4
PART I. INTRODUCTION
1.1. Research rationale
Worldwide problems including climate change, eutrophicated water sources
and increasing amounts of waste are all direct long-term effects of man’s pursuit of
increased prosperity. Today many developing countries, The Socialist Republic of
Vietnam being one of them, face a decision. A choice between a path leading to long
term growth in a sustainable fashion, or a path focusing on rapid economic growth at
the expense of a deteriorating natural environment.
Vietnam is in many ways an example of how fast a country can develop
economically. After a history of war and poverty, Vietnam can boast of having left the
designation of a low-income country in only a few decades. As of 2009 the World
Bank recognized Vietnam as a lower middle economy (World Bank, 2014). Much of
this development can be attributed to the economic reform of 1986 called Đổi Mới.
The term literally translates into renovation and the process brought the country from a
centrally planned agricultural economy towards a more industrialized market economy
(World Bank, 2014).
One negative effect of the past decades’ focus on economic growth is visible in
the polluted water sources. Vietnam faces severe problems with eutrophication
because of poor or nonexistent wastewater treatment from both households and
industries. As late as in 2004, “none of Vietnam’s cities collected or treated municipal
wastewater” (World Bank, 2011, p. 223). In 2009 six cities had wastewater treatment
plants and by 2013 the number had increased to eight (WEPA, 2013). Despite these
figures only 10 % of the wastewater is actually being treated (World Bank, 2013). The
pollution degrades water reserves available for human consumption, agriculture and
aquaculture, amplifying the shortage of freshwater in and around the region (Dan et
al., 2011; WEPA, n.d.). Thus, in order to continue the journey towards becoming a
high-income country, Vietnam must ensure functioning and sustainable wastewater
treatment systems, which can only be completed through proper planning.
A recognized method for decision-making in wastewater treatment planning is
material flow analysis (MFA) (Montangero & Belevi, 2007; Montangero et al., 2007;
Montangero & Belevi, 2008; Nga et al., 2011; Zimmermann, 2014). This thesis uses
5
the method to define the current flows of two important pollutants, phosphorous and
organic matter, in domestic wastewater in the Vietnamese, Song Cong town. It in the
flatlands of northern Vietnam, and was inhabited by 52 056 persons at the beginning
of 2015. The purpose of the thesis is to compare different systems for wastewater
treatment and their effect on substance flows, as a basis for implementation of a
sustainable wastewater management in Song Cong.
1.2. Research’s objectives
The purpose of this study is to identify and compare different treatment systems
for wastewater, with potential to be implemented in Song Cong town in the Thai
Nguyen province of Vietnam. The comparison was based on how efficiently the
different technical solutions separate phosphorus (P) and chemical oxygen demand
(COD), from the wastewater.
1.3. Research questions
The research aims to answer the following objectives:
Define the current domestic wastewater system in Song Cong town.
Define the flows of domestic food waste to show the possibilities for
future biogas production.
Create a flowchart of the current P and COD flows in wastewater and
food waste using MFA.
Identify different solutions for wastewater treatment, focusing on their
effectiveness in reducing P and COD.
Conduct and present a MFA of P and COD flows of future scenarios and
compare the results with a business-as-usual (BAU) scenario.
1.4. Limitation of the research
This thesis focuses on analyzing the flows of P and COD in wastewater and
food waste from the households of the six urban wards of Song Cong town. Only a
basic comparison based on other aspects, including economic, energy and climate, is
conducted.
6
PART II. LITERATURE REVIEW
The background intends to provide an overview of significant deficiencies that
affect the Vietnamese wastewater sector, to better understand existing challenges in
the planning and implementation process. The chapter also reviews various
wastewater treatment techniques, with potential to be implemented in the urban wards
of Song Cong town. Note that the urban wards of Song Cong town will be referred to
as Song Cong in the following text.
2.1. Challenges in the Vietnamese Wastewater Sector
It can be challenging to decide which wastewater treatment system to
implement in a specific area. Whereas decentralized solutions are used with a higher
frequency in developing countries, centralized solutions are more common in
developed countries (Libralato et al., 2011). This does not imply that all developing
countries should introduce centralized systems, it is important to analyze the social,
economic and environmental aspects of the local area. Decentralized systems have
advantages such as cheaper operating and construction costs and a shorter drainage
network (Maurer et al., 2006). Libralato et al. mention easier recycling of water and
nutrients and the reduced risk of the water being contaminated by industrial
wastewater as additional benefits.
Today the on-site solution, septic tank, is the most common method for treating
wastewater in Vietnam. Although up to 80 % of the Vietnamese urban households are
connected to septic tanks (Nguyen el al. 2013), only 10 % of the wastewater and 4 %
of the septage is treated (World Bank, 2013). These issues are affected by technical
difficulties as well as several other factors, such as organizational, cultural,
educational and financial.
The technical challenges include lacking capacity. A majority of the sewerage
systems are combined rather than separated. However, most combined systems are
only designed to discharge rainwater, which causes issues with overflowing systems
(World Bank, 2013). Many of the septic tanks are also undersized and emptied too
rarely (Schramm, 2011). The technical challenges are further aggravated in many lowincome areas which are too densely populated for desludging trucks to access, instead
manual desludging is performed. Consequently the septage from these areas tends to
7
be dumped in close vicinity to peoples’ living quarters, in drains, canals or dikes
(AECOM & Sandec, 2010).
Organizational challenges arise because of confusions about responsibilities and
division of labor, as a result of adjacent and overlapping authorities between several
agencies on different levels (Karius, 2011; Zimmermann, 2014). Misunderstandings
also arise in the legal system, in which gaps and contradictions exist between laws and
regulations at various levels (Nguyen, 2013). These issues contribute to poor
infrastructure planning, lack of law enforcement and inefficiency in approaching
social and environmental issues. Bassan et al. (2014) highlights the absence of national
standards regulating a safe sludge management as an issue that needs to be addressed.
In addition it is essential to raise the public awareness of environmental issues, making
sure the residents understand the importance of a well-managed wastewater system
and by following regulations.
The financing is another challenge that needs to be addressed if Vietnam is to
achieve a self-sustaining wastewater treatment infrastructure. Today public services
are often provided by utility companies that deal in a wide array of businesses, such as
water supply, waste collection, construction and property development. Reportedly the
tariffs for water supply and wastewater treatment are rarely sufficient for operation
and maintenance (AECOM & Sandec, 2010; Schramm, 2011, World Bank, 2014),
much less for improvements. This lack of capital forces the companies to subsidize
parts of their operations that cannot carry their own costs with income from more
profitable ones. Some companies have started to privatize, but in order for it to be a
sustainable business for any investor the tariffs have to be increased. A problem with
raising the tariffs is the unfamiliarity of paying for public services, which is a remnant
of the past times, planned economy (AECOM & Sandec, 2010; Zimmerman, 2014).
2.2. Wastewater Treatment Solutions in Vietnam
The Vietnamese authorities’ desire to improve the overall wastewater situation
has during the past years led to an increasing number of wastewater treatment plants.
Various techniques are tried out in different areas of the country. Both constructed
wetlands (CW) and activated sludge (AS) techniques, such as Sequencing Batch
Reactors (SBR) and Anaerobic/Anoxic/Oxic (A2O) exist (WEPA, 2013; Bassan et al.,
8
2014). Since these techniques already occur in Vietnam, the thesis will give a basic
overview of their function. A comparison will be made, mainly focusing on the
efficiency in separating P and COD from the wastewater, in order to suggest how the
wastewater treatment system in Song Cong could be planned.
2.3. Conventional Wastewater Treatment Plants
A widespread method in industrialized countries for reducing P from municipal
wastewater is through conventional mechanical/biological/chemical treatment
methods. During the chemical treatment process a metal salt, usually iron or
aluminum, is added to precipitate and coagulate dissolved COD and P, where on the
flocs are separated from the water through sedimentation. Removed from the process
is a chemical sludge (Carlsson & Hallin, 2003). Carlsson & Hallin states that
depending on the type of substance used for precipitation and in which stage the
chemical is added – either before, after or both before and after the biological
treatment – the removal efficiency varies. Figures of the P and COD removal in
conventional WWTP and plants using activated biological sludge techniques are
presented in Table 2 and Table 3 below.
2.4. Activated Sludge Techniques
The suspended growth process, activated sludge (AS), is the dominating
technique for secondary biological treatment of municipal wastewater (Mittal, 2011).
In the process the water flows into an aerated tank where aerobic microorganisms
digest nutrients and organic matter. Thereafter the biological flocs sediment while an
effluent of treated water flows out from the process. Activated sludge is subsequently
recycled to the aeration tank to keep the process alive. Waste sludge is removed from
the process.
AS processes are typically chosen when an efficient removal of organic matter
and particles is desired. The removal of P is less effective, it is mainly removed in
the mechanical treatment step or through uptake by microorganisms (Carlsson &
Hallin, 2003). Moreover, biological P treatment in an AS plant is a sensitive process
(South, 2014; Oneke, 2006). Tilley et al. (2014) emphasize the importance of an
9
accurate design based on the volume and properties of the wastewater to ensure full
treatment capacity.
2.4.1. Enhanced Biological Phosphorus Removal
For a more efficient removal of P, Enhanced Biological Phosphorus Removal
(EBPR) methods have been developed from the AS technique. The EBPR processes
most frequently mentioned in literature are Anaerobic/Oxic (A/O), which focuses on
P removal only, and the Anaerobic/Anoxic/Oxic (A2O) and University of Cape
Town (UCT) processes, which efficiently remove both P and N (Figure 1). The
principle for the techniques is the same, letting activated sludge circulate through
anaerobic and aerobic steps. To drive the process the bacteria Phosphorus
Accumulating Organisms (PAO) are mixed with the conventional microorganisms.
The PAO are specialized in storing and metabolizing P whereas the conventional
bacteria can “convert easily biodegradable material” into volatile fatty acids (VFA)
(Haandel & Lubbe, 2007, p. 220).
Figure 1. The steps of the different EBPR treatment processes, showing
Anaerobic/Oxic (A/O) at the top, Anaerobic/Anoxic/Oxic (A2O) in
the middle and University of Cape Town (UCT) at the bottom.
10
A significant difference between the A2O and UCT is to which stage the
activated sludge is recycled. Both processes are constructed with anaerobic-anoxicoxic processes in a series of steps. The A2O recycle the sludge from the oxic zone to
the anaerobic stage, while the activated sludge in the UCT is recycled to the anoxic
zone, as illustrated in Figure 2. Subsequently mixed liquor is returned from the anoxic
zone to the anaerobic zone. Because the nitrate level in UCT is kept low in the anoxic
zone, this reduces the nitrogen content in the anaerobic zone, which in turn enhances
the P removal efficiency. Gu et al. (2007) conclude that the UCT perform better in
both P and N removal efficiency.
The P removal efficiency from the EBPR processes is however difficult to
generalize since the processes are sensitive and can be disturbed by many different
factors, such as low pH or, as indicated above, high nitrate content in the anaerobic
zone. Additionally it is important that the amount of Volatile Fatty Acids (VFA) in
the process is abundant. Särner et al. (2004) and Yu et al. (2008) explain that one
technique by which VFA can be increased is through hydrolysis of primary or
excess sludge.
2.4.2. Sequencing Batch Reactor
As mentioned, another common wastewater treatment technique in Vietnam is
the SBR. It is a simple AS method where, instead of letting the water flow
continuously from one step to the other, all the treatment steps occur in the same tank.
The SBR operation can be varied with aerobic, anaerobic and anoxic stages depending
on the wanted removal efficiency (Kapdan & Ozturk, 2005). An advantage of SBR
compared to other AS methods is the relatively low capital cost and space
requirement.
2.5. Compilation of P and COD Removal Efficiency in WWTP
Table 1 and Table 2 conclude the described WWTP’s P and COD removal
efficiency
according
to
various
sources.
The
conventional
WWTP
with
chemical/biological treatment performs best in both P and COD removal, on an
average above 90 %. The COD removal for the AS techniques is relatively high,
between 76 % and 90 %. The P removal for the conventional AS is however low and
ranges between 25 % and 45 %. The wide range can be explained by the sensitiveness
11
in the P removal process, which as mentioned is affected by several factors, indicating
that the local conditions are important. The figures of the EBPR include both the A2O
and the UCT processes, which are both relatively effective. The high P removal in the
SBR shows the best case scenario, combining the anaerobic/anoxic/oxic processes in
the reactor. An SBR with only aeration would not be as effective.
Table 1. Removal rates of P in WWTP based on different literature sources,
ranging from 25 % to 95 %
Conventional
Source
WWTP
Conventional
Activated
Enhanced
Sequencing
biological
batch
Phosphate
reactor
removal (%)
(%)
(%)
sludge (%)
SMED (2012)
95
-
-
-
Naturvårdsverket(2003)
90
-
-
-
Carlsson&Hallin(2003)
-
30
-
-
Kivaisi (2001)
-
30-45
-
-
von Sperling (2007)
-
25-30
-
-
Wang et al. (2009b)
-
-
-
<90
Pambrun et al. (2004)
-
-
-
<90
Wang et al. (2013)
-
-
80
-
Zhang et al. (2010)
-
-
80
-
Wang et al. (2009a)
-
-
-
71
82-96
39
87
-
Rodriguez-Garcia (2011)
12
Table 2. Removal rates of COD in WWTP based on different literature sources,
ranging from 76 % to 97%
Sequencing
Conventional
Source
Conventional
Enhanced
biological
batch
reactor
WWTP
Activated
(%)
sludge (%)
Wang et al. (2009a)
-
-
-
80
Kulikowska et al.(2006)
-
-
-
76-83
Silva et al.(2014)
-
80-85
85-90
-
93-97
83
92
-
Rodriguez Garcia(2011)
Phosphate
(%)
removal (%)
2.6. Constructed Treatment Wetlands
Constructed wetlands (CW) can be found around the world, in many different
climates and with a variety of plant species. Most studies and performance data of
water treatment in CW are from Europe and other temperate climates according to
Trang et al. (2010) and Zhang et al. (2014). In temperate climates the microbial
activity is lower than it is expected to be in tropical areas. Thus the treatment
performance is also expected to be higher in warmer climates. In tropical countries
like Vietnam, the removal rates for COD and P in wetlands can reach levels which are
acceptable for wastewater treatment, as opposed to colder climates (Trang et al., 2010;
Dan et al., 2011).
How well nutrients, pollutants and pathogens are removed from wastewater depend on
many parameters: climate, hydraulic retention time (HRT), hydraulic load rate (HLR)
and which plants that are used (Zhang et al., 2014; Nguyen et al., 2010; Kivaisi, 2001;
Vymazal, 2007; Jóźwiakowski, 2009). Hydrologic conditions like HRT and HLR have
been highlighted by Zhang et al. (2014), Dan et al. (2011) and Trang et al. (2010) as
probably the most important.
13
HRT is a measurement of how long the contaminants in the water are in contact
with the active surface (plant rhizosphere and substrate) while the HLR is expressed in
a ratio of flow into the wetland in m3 day-1 . The rhizosphere is the area closest to the
vegetation’s roots containing high concentrations of microorganisms, thus being
important for the purification of water in wetlands (McNear, 2013).
On a general level wetlands can be divided into Free Water Surface (FWS)
wetlands, Floating Treatment Wetlands (FTW) and Subsurface Flow (SSF).
Subsurface flows can further be divided according to the direction of water flow,
horizontal (HSSF) or vertical (VSSF). The different types have varying advantages,
therefore it is often beneficial to combine them into hybrids or multiple stage wetlands
in order to achieve an increased efficiency.
2.6.1. Free Water Surface (FWS) Wetlands
FWS wetlands resemble natural marshes with a depth of around 0.4 m. The
floor of the basin is covered with a substrate (rock, gravel or sand) from which the
plants grow. The plants grow up through the water surface although not covering the
surface as in a FTW. FWS often consist of some kind of reeds. The FWS design gives
aerobic properties along the water surface while being anaerobic in the substrate and
among the plant roots.
2.6.2. Floating Treatment Wetlands (FTW)
FTWs similarly to FWS wetlands are open water sources with vegetation. The
difference is found in the bottom of the basin as the FTW do not have a substrate
supporting the plant. Instead the plants grow from a floating mat of substrate on the
water surface and have roots hanging free towards the bottom. This makes FTWs
particularly suited for uneven water levels, such as treatment of storm water drainage.
2.6.3. Subsurface Flows (SSF)
SSFs are the wetland design for which most data has been found. As
mentioned SSF can be divided into horizontal and vertical flows. The basic design
consists of a permeable substrate layer up to 0.6 m in thickness in which the plants
grow. The water filters through the substrate either horizontally or vertically
depending on the design. This gives large contact areas between the water, substrate
and plant rhizospheres. SSF wetlands create aerobic areas around the plant roots as
14
they transport oxygen from above the water surface while anaerobic and anoxic areas
occur further away from the roots.
2.6.4. Hybrids
As mentioned the reduction of pollutants varies greatly depending on the
designs, plants, HRT, HLR and which pollutant is examined. Hybrid systems combine
the above described designs in multiple stages to get the best out of each design. This
allows for multiple plants species to be used, hopefully giving a higher removal of
pollutants.
2.7. Compilation of P and COD Removal Efficiency in Constructed Treatment
Wetlands
Table 3 and Table 4 show the removal efficiency of P and COD for the
different CW designs. The presented figures are mean values from the respective
literature, like Zhang et al. (2014) who reviewed up to 16 studies to conclude the mean
removal rates of P and COD. Further the figures vary as a result of differences in the
wetlands configurations within the different designs, for example differences in HRT
and choice of plant species affect the results of both P and COD.
Table 3. Removal rates of P in wetlands based on different literature sources,
ranging from 41% to 84%
Source
Vertical
Horizontal
Subsurface
Subsurface
flow (%)
flow (%)
Free
Floating
water
Treatment
surface
wetland
(%)
(%)
Hybrid (%)
Nguyen et al.(2010)
48
-
-
-
-
Zhang et al. (2014)
60
66
49
50
55
Vymazal (2007)
60
41
49
42
-
Jóźwiakowski (2009)
51
52
-
-
84
Trag et al. (2010)
-
75
-
-
-
Dan et al. (2011)
78
58
-
-
-
15
Table 4 Removal rates of COD in wetlands based on different literature
sources, ranging from 45% to 93%
Source
Vertical
Horizontal
subsurface
subsurface
Free
Floating
water
treatment
surface
wetland
(%)
(%)
Hybrid (%)
flow (%)
flow (%)
Nguyen et al. (2010)
77
-
-
-
-
Zhang et al. (2014)
64
66
45
55
86
Vymazal (2007)
-
-
-
-
-
Jóźwiakowski (2009)
82
76
-
-
93
Trang et al. (2010)
-
71
-
-
-
Dan et al. (2011)
60
48
-
-
-
2.8. Further Comparison of the Wastewater Treatment Techniques
Although wastewater treatment in a conventional WWTP is the most efficient
method for removing P and COD from the wastewater biological treatment methods,
such as the AS and CW, have their advantages:
The cost and transport of chemicals are removed
The environmental impact is lower
The processes yield less sludge (Oneke, 2006) which is also lighter and
of better quality
Table 5 presents a further comparison between the biological treatment
techniques. However no economic comparison has been included, thus it is worth
mentioning that in general the AS techniques are more expensive than the CW, both
regarding capital and operating costs (Tilley et al., 2014). Also note that the table’s
information on the activated sludge techniques includes both conventional AS and the
EBPR processes.
16
Table 5. Comparison between the biological wastewater treatment techniques (Tilley et al., 2014)
Activated sludge
technique
Hybrid
constructed
Free water surface
Horizontal
Vertical
subsurface flow
subsurface flow
(Horizontal SSF)
(Vertical SSF)
(FWS)
Floating
treatment
(AS, EBPR)
(wetland)
P removal
25-87%
55-84 %
49 %
41-75 %
48-78 %
42-55 %
COD removal
80-92 %
86-93 %
45 %
48-76 %
60-82 %
55 %
High reduction of
Low pathogen
Pathogen removal
removal. Effluent and
sludge require further
treatment.
Land requirement
The effluent can
be used for i.e.
irrigation or
discharged to
pathogens.
Moderate pathogen
Domestic
removal.
wastewater may
require
recipient.
disinfection.
wetland (FTW)
High reduction
of pathogens.
No information
Domestic
found on pathogen
wastewater may
removal.
require
Little compared to
Requires a large
Requires a large land
Requires a large
Less than FWS or
Requires a large
natural systems.
land area.
area.
land area
Horizontal SSF.
land area.
Energy
High energy
consumption
consumption.
Electricity
generally only for
pumps.
Electricity generally
only for pumps.
Electricity
generally only for
pumps.
Requires constant
electricity.
Electricity
generally only for
pumps.
17
Appropriate for
Usually implemented
Applicability
in densely populated
areas for domestic
wastewater treatment.
Appropriate for
small
communities.
Appropriate for small
Appropriate for
small parts of
parts of urban areas
small parts of urban
urban areas or for
or for peri-urban and
areas, down to
peri-urban and
rural communities.
single households.
rural
No information.
communities.
Can be used after
Can be used after
Implementation
stage
Can be implemented
after primary or
primary
treatment,
secondary treatment.
i.e. septic tanks.
primary treatment.
Typically used for
further treatment of
effluent after
secondary treatment.
Climate
Generally used for
secondary or
tertiary treatment of
greywater or
blackwater
Generally used
Appropriate for
for secondary or
highly fluctuating
tertiary treatment.
water levels, such
Pre-treatment is
as storm water
required to
discharges or
prevent clogging.
retention tanks.
Appropriate in most
Not very tolerant
Not very tolerant to
Not very tolerant to
Not very tolerant
Not very tolerant
climates.
to cold climates.
cold climates.
cold climates
to cold climates.
to cold climates.
18