Application and test of the SWAT model i
Bạn đang xem bản rút gọn của tài liệu. Xem và tải ngay bản đầy đủ của tài liệu tại đây (949.86 KB, 6 trang )
4th International Engineering Symposium - IES 2015
March 4-6, 2015, Kumamoto University, Japan
Application and Test of the SWAT Model in the
Upper Cauvery River Basin, Karnataka, India
Kumar Raju B C and Lakshman Nandagiri
Department of Applied Mechanics & Hydraulics, National Institute of Technology
Karnataka, Surathkal, Karnataka, India, e-mail:
ABSTRACT: With increased availability of spatial data-sets of catchment characteristics
and hydrometeorological variables, distributed hydrological models are being applied to
solve a variety of problems related to catchment hydrology and water resources
management. In this study, we explore the applicability of the distributed Soil and Water
Assessment Tool (SWAT) hydrological model to map the spatial distribution of
hydrological processes in the Upper Cauvery basin (36682 km 2) located in Karnataka
State, India. SWAT was applied to the basin using input data of daily rainfall from 33
influencing rain gauges, climatic variables from 6 climate stations, land use-land cover
and topography information derived from satellite imagery and soil characteristics from a
map. Daily streamflow records of the Biligundulu gauging site was used for model
calibration and validation. Model sensitivity analysis, to identify the most critical
parameters was performed using the Latin Hypercube (LH) and One-factor-At-a-Time
(OAT) sampling approach. SWAT performance in simulating streamflow at the
Billigundulu gauge site was good as indicated by coefficient of determination (R 2) of 0.81
and Nash-Sutcliffe efficiency (ENS) of 80% between simulated and observed daily flows.
Results of this study prove that SWAT is an effective modeling tool for hydrologic
analyses in large heterogeneous tropical catchments.
Key words: SWAT, Hydrological modeling, Sensitivity analysis, Surface runoff, Cauvery
basin, India.
1. INTRODUCTION
Hydrological models are used to represent
temporal and spatial processes of the
hydrological cycle at a basin scale. These
models are also useful in identifying
sensitive parameters for basin response
for the sub hydrological process. A variety
of distributed hydrological models are
available of which some are integrated
within a Geographical Information System
(GIS)
environment
for
predicting
watershed water balance components
(Arnold et al., 1998; Beasley and Huggins,
1981; Beven and Kirkby, 1979; Young et
al., 1989).. Among these, Soil Water
Assessment Tool (SWAT) has been widely
used in various regions of the world and in
different climatic zones at daily, monthly
and annual time steps and also it has been
successfully implemented at spatial scales
ranging from small watersheds to large
river basins (Arnold et al., 1998). SWAT is
also suitable in the quantification of
relative impact using alternative input data
on water balance components, land use
changes and water quality assessment
(Tripathi et al., 2003; Xu et al., 2011). For
Indian climatic condition SWAT has been
effectively
implemented
to
predict
streamflow, sediment yield and water
quality of a catchment (Dhar and
Mazumdar, 2009; Gosain et al., 2006;
Immerzeel and Droogers, 2008; Wagner et
al., 2013). In this study, it is intended to
test a SWAT model for the upper Cauvery
basin, Karnataka, India. Also, this study
aims at identifying sensitive parameters
which govern water yield of the basin.
4th International Engineering Symposium - IES 2015
March 4-6, 2015, Kumamoto University, Japan
2. SWAT MODEL DESCRIPTION
3. STUDY AREA
The SWAT model has been used for
investigating the impact assessment of
water availability, erosion, sediment and
nutrient transport at the basin scale
(Arnold et al., 1998). SWAT requires
rainfall, climate, land use, soil data and
elevation
data
for
delineating
the
watershed boundaries, streams and flow
routing. In SWAT the watershed is
subdivided into a number of sub
watersheds. These sub watersheds are
further divided into Hydrologic Response
Units (HRUs), which are units of unique
intersections of land use and soils and it
simulates water balance components for
each HRU by using a water balance
equation. The hydrologic cycle is simulated
by the water balance equation:
The Cauvery River, also known as the
Dakshin Ganga, is one of the major
interstate peninsular rivers of South India.
The Cauvery River rises in the Western
Ghats and flows in an eastwardly direction
passing through the states of Karnataka,
Tamil Nadu, Kerala and Pondicherry before
it drains into the Bay of Bengal. The
present study was taken up to the
Billigundulu gauge site of the Cauvery
basin to simulate the water yield. The
basin up to the Billigundulu gauge site has
an area of 36682 km2 with many
tributaries,
including
the
Shimsha,
Hemavathi,
Harangi,
Arkavati,
Lakshmanathirtha and Kabini (Table 1).
The south-west monsoon covers most of
the annual precipitation. The recorded
maximum and minimum temperatures are
39.1°C and 4.8°C respectively. There are
many major and medium projects in the
upper Cauvery basin located in Karnataka
state from which water is utilized for
irrigated areas in many districts. A few of
the selected major water resources
projects in the upper Cauvery basin are
KRS dam, Harangi dam, Hemavathi dam,
and Kabini dam. The larger part of the
upper Cauvery basin is comprised of
irrigated agriculture. More than 70, 000 ha
of
land
is
irrigated
from
canals,
groundwater wells and tanks. Irrigated
agriculture in this basin provides livelihood
to a large population and contributes
significantly to the food production of
Karnataka State. An assessment of the
basin is important because it provides a
statistic on the water yield of the basin,
especially under the impacts of significant
human-induced land use/cover and climate
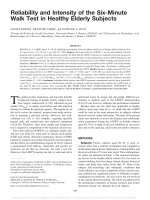
changes. The topography map of the
upper Cauvery basin is shown in Fig. 1.
(1)
t
SW t SW0 R day Q surf E a w seep Q gw
i 1
where SW is the soil water content, i is
time in days for the simulation period t,
and Rday, Qsurf, Ea, Wseep, and Qgw
respectively are the daily precipitation,
surface
runoff,
evapotranspiration,
percolation and return flow. Surface runoff
(Qsurf) for each HRU is calculated by using
SCS-CN method. The general form of the
SCS-CN method (USDA, 1972), is given by
the following equation:
Q surf
Pe2
Pe S
(2)
Where Pe (mm) is the depth of effective
precipitation (precipitation minus initial
abstraction), S (mm) is the amount of
water storage available in the soil profile
or the retention parameter and it is
defined as:
1000
S 25.4
10
CN
(3)
The CN is a function of the soil’s
permeability, land use and antecedent soil
water conditions.
Table 1 Sub basins in the Upper Cauvery
Basin
Sl.
Drainage Area
Sub basin Name
No.
(km2)
1
Hemavathy
5548.32
2
Harangi
3209.20
3
Lakshmanathirtha
1912.45
4
Kabini
7021.33
5
Shimsha
8646.89
6
Arkavathy
4123.84
Upper Cauvery
36682.00
4th International Engineering Symposium - IES 2015
March 4-6, 2015, Kumamoto University, Japan
Fig. 1 Topography of Upper Cauvery basin and the location of the rain gauge
stations
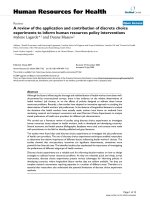
The urban areas, industrial area and
4. INPUT DATA
villages cover 2.95% of the basin. The
Basic input data required for the SWAT map and distribution of the land use
hydrological model includes topography, obtained from KSRSAC are shown in Fig.
weather, rainfall, land use and soil data. 2.
Topographic data was obtained in the form
of DEM (Digital Elevation Model) at 90 m
resolution from the SRTM (Shuttle Radar
Topography Mission) and it was used to
delineate a basin into multiple sub basins
and
calculate
topographic
related
parameters such as slope class, stream
length and locate monitoring points.
1:50,000 scale land use data was collected
from Karnataka State Remote Sensing
Application Centre (KSRSAC) and soil map
and its physical properties database were
obtained from the National Bureau of Soil
Survey and Land Use Planning (NBSS and
LUP). Daily precipitation data was collected
from Karnataka Irrigation Investigation
Division (KIID) for 33 rain gauge stations
located in and around the basin. Daily
climate data were collected from the
Indian Meteorological Department (IMD)
climate stations.
4.1 LAND USE AND SOIL
The predominant land use in the basin is
agriculture. Agricultural fields and forest
areas cover more than 64.17% and
24.47% of the basin respectively. The
water bodies include reservoirs and tanks
cover 3.9% of the basin. The barren rocky
and scrub land cover 4.51% of the basin.
5. SENSITIVITY ANALYSIS
Sensitivity analysis can give a better
understanding of the impact of change in
an individual input parameter of the model
response and can be performed using
various methods. The method in the
ArcSWAT interface combines the Latin
Hypercube (LH) and One-factor-At-a-Time
(OAT) sampling. Van Griensven et al.
(2006), characterized Global rank 1 as
“very important”, rank 2 to 6 as
‘important”, rank 7 to 19 as “slightly
important” and rank 28 as “not important”.
Sensitivity analysis was performed on 16
different SWAT model parameters for the
upper Cauvery basin. Parameters and
parameter ranges used in the sensitivity
analysis are shown in Table 2. By using
default
upper
and
lower
boundary
parameter values, the parameters were
tested for sensitivity using without
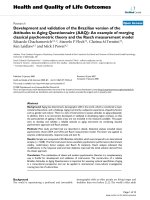
observed streamflow data. Results of
sensitivity analysis for the upper Cauvery
basin are presented in Fig. 3 with
parameters ranked according to their
magnitude of response. The most sensitive
factor governing the streamflow for the
upper Cauvery basin was base flow alpha
factor (Alpha_Bf). This indicates that base
4th International Engineering Symposium - IES 2015
March 4-6, 2015, Kumamoto University, Japan
flow is very significant in the water yield.
The SCS runoff curve number for moisture
condition II (CN2), Effective hydraulic
conductivity in main channel alluvium
(Ch_K2), threshold depth of water in the
shallow aquifer required for return flow to
occur (Gwqmn), available water capacity
(Sol_Awc)
and
soil
evaporation
compensation factor (Esco) are also
important parameters. Alpha_Bf and
Sol_Awc were correlated to base flow and
that could be the reason for their higher
ranking in the sensitivity analysis. Sol_Z,
Canmx, Blai, Gw_delay and Sol_K were
the next sensitive parameters. Ch_N2,
Gw_revap, Surlag, Epco and Revapmn
parameters had very less influence on the
streamflow.
Fig. 2 Land use/Land cover map of the upper Cauvery basin
Table 2 Parameters and their ranges considered for the sensitivity analysis
(Gw. = groundwater, Evap. = evaporation, Geom. = geomorphology)
Name
Min
Max
Definition
Process
Alpha_Bf
0
1
Base flow alpha factor (days)
Gw.
Blai
-20
20
Leaf area index for crop *
Crop
Canmx
0
10
Maximum canopy index
Effective hydraulic conductivity
channel alluvium (mm/hr)
Runoff
in
main
Ch_K2
0
150
Ch_N2
-20
20
CN2
-20
20
Manning coefficient for channel
SCS runoff curve number for
condition II *
Epco
-20
20
Plant evaporation compensation factor *
Evap.
Esco
0
1
Soil evaporation compensation factor
Evap.
Gw_delay
0
100
Groundwater delay (days)
Gw.
Gw_revap
0.02
0.2
Gw.
Gwqmn
0
1000
Revapmn
0
500
Groundwater ‘‘revap’’ coefficient
Threshold depth of water in the shallow
aquifer required for return flow to occur (mm)
Threshold depth of water in the shallow
aquifer for ‘‘revap’’ to occur (mm)
Sol_Awc
-20
20
Available water capacity (mm/mm soil)*
Soil
Sol_K
-20
20
Soil conductivity (mm/h) *
Soil
Sol_Z
-20
20
Soil depth *
Soil
Surlag
0
10
Surface runoff lag coefficient
Runoff
*Relative percent change.
Channel
Channel
moisture
Runoff
Soil
Gw.
4th International Engineering Symposium - IES 2015
March 4-6, 2015, Kumamoto University, Japan
Surlag
Sol_Z
Sol_K
Sol_Awc
Revapmn
Gwqmn
Gw_Revap
Gw_Delay
Esco
Epco
CN2
Ch_N2
Ch_K2
Canmx
Blai
Alpha_Bf
14
7
11
5
16
4
13
10
6
15
2
12
3
8
9
1
0
2
4
6
8
10
12
14
16
Fig. 3 Sensitivity ranking for hydrology over the upper Cauvery basin for SWAT model
7. RESULTS AND DISCUSSION
6. CALIBRATION OF THE SWAT
PARAMETERS
Model calibration involves the adjustment of
parameter
values
and
comparison
of
simulated streamflow, to observe data until a
defined objective function is attained. In this
study, automatic calibration was carried out
using a dataset of daily streamflow records.
The parameters obtained from the sensitivity
analysis using LH-OAT were chosen for
automatic calibration. To calibrate the SWAT
model, auto-calibration tool in the ArcSWAT
interface was used with Parasol mode. The
model predictions are evaluated for the
calibration periods using three statistical
methods: Nash–Sutcliffe efficiency coefficient
(ENS), Percent BIAS (PBIAS) and coefficient of
determination (R2).
Streamflow was estimated based on calibrated
model parameters. The SWAT model was
calibrated using the daily observed streamflow
data on Billigundulu gauge site. The
calibration period was chosen between
1/6/2005 to 31/12/2005. Fig. 4 shows the
time series and a scatter plot of simulated and
observed flows (m3/s) for the SWAT model at
the gauging site of the basin. The model was
also capable of simulating the pattern of flow
during dry and wet period reliable with the
climate data inputs. From these Figure it is
noticed
that
observed
streamflow
are
simulated well, which implies that the
performance of SWAT model is good. The
ENS, R2 and PBAIS values of the SWAT model
for the basin was 0.80, 0.81 and -2.73
respectively.
4000
3600
Observed
SWAT
3000
3000
2400
2000
1800
1200
R2 = 0.81
1000
600
0
6/1/2005
0
8/1/2005
10/1/2005
12/1/2005
0
1000
2000
3000
4000
Fig. 4 Time Series and scatter plot of observed and simulated daily streamflow in the
upper Cauvery basin
4th International Engineering Symposium - IES 2015
March 4-6, 2015, Kumamoto University, Japan
8. CONCLUSION
The present study was able to interpret the
physically based SWAT model for agricultural
dominated basin like upper Cauvery. The
behavior of the basin in terms of response to
streamflow at the gauge site was successfully
assessed
by
identifying
the
sensitive
parameters. The sensitivity analysis of the
model showed that the base flow alpha factor
was the most sensitive parameter. The model
was successfully calibrated using observed
daily flow data on the Billigundulu gauge site
using auto-calibration tool. The results
showed that the major part of flow was from
the aquifer zone nearer to the gauge site that
reaches up to 40% of the streamflow
contribution.
The
statistics
of
model
performance in simulating temporal variations
in the Billigundulu gauge site are good. In
view of the results obtained in this study, it
may be concluded that SWAT is an effective
modeling tool for hydrologic analyses and
water resources management in the upper
Cauvery basin.
ACKNOWLEDGEMENTS
The authors are grateful for the financial
assistance provided by the Department of
Applied Mechanics and Hydraulics, National
Institute of Technology Karnataka, India. We
would also like to thank all the Government
Departments and Organizations for providing
required data.
REFERENCES
[1] Arnold, J. G., et al., (1998), Large area hydrologic
modeling and assessment part i: model development,
JAWRA Journal of the American Water Resources
Association, vol. 34, pp. 73-89.
[2] Beasley, D. B. and Huggins, L. F., (1981), ANSWERS
users manual, Chicago: United States Environmental
Protection Agency,
[3] Beven, K. J. and Kirkby, M. J., (1979), A physically
based, variable contributing area model of basin
hydrology, Hydrological Sciences Bulletin, vol. 24, pp.
43-69.
[4] Dhar, S. and Mazumdar, A., (2009), Hydrological
modelling of the Kangsabati river under changed climate
scenario: case study in India, Hydrological Processes, vol.
23, pp. 2394-2406.
[5] Gosain, A., et al., (2006), Climate change impact
assessment on hydrology of Indian river basins, Current
Science, vol. 90, pp. 346-353.
[6] Immerzeel, W. W. and Droogers, P., (2008),
Calibration of a distributed hydrological model based on
satellite evapotranspiration, Journal of Hydrology, vol.
349, pp. 411-424.
[7] Tripathi, M. P., et al., (2003), Identification and
prioritisation
of
critical
sub-watersheds
for
soil
conservation management using the SWAT Model,
Biosystems Engineering, vol. 85, pp. 365-379.
[8] USDA, S., (1972), National Engineering Handbook,
Section 4: Hydrology, Washington, DC,
[9] Wagner, P. D., et al., (2013), An assessment of land
use change impacts on the water resources of the Mula
and Mutha Rivers catchment upstream of Pune, India,
Natural Hazards and Earth System Sciences, vol. 17, pp.
2233-2246.
[10] Xu, H., et al., (2011), Quantifying uncertainty in the
impacts of climate change on river discharge in subcatchments of the Yangtze and Yellow River Basins,
China, Natural Hazards and Earth System Sciences, vol.
15, pp. 333-344.
[11] Young, R. A., et al., (1989), AGNPS: A nonpointsource pollution model for evaluating agricultural
watersheds, Journal of Soil and Water Conservation, vol.
44, pp. 168-173.