tổng hợp ielts writing task 1 simon ( updated)
Bạn đang xem bản rút gọn của tài liệu. Xem và tải ngay bản đầy đủ của tài liệu tại đây (1.95 MB, 74 trang )
TỔNG HỢP BÀI MẪU& HƯỚNG DẪN LÀM BÀI
IELTS WRITING TASK 1- BAND 9.0 CỦA SIMON
( Bản update nhất -2016 )
1
IELTS Thư Đặng
Tổng Hợp Bài Mẫu & Hướng Dẫn Làm Bài IELTS Writing Task 1- Simon
Lời nói đầu:
Nhằm giúp đỡ các bạn thí sinh đang học IELTS tại trung tâm Anh ngữ Prosource, IELTS Thư
Đặng đã tổng hợp đầy đủ những bài mẫu IELTS Writing Task 1 Band 9 của thầy Simon, IELTS
Examiner nổi tiếng trên thế giới. Nhờ những bài giảng và hướng dẫn cách học IELTS Writing,
cũng như những lời khuyên hữu ích của thầy Simon về phương pháp làm bài IELTS Writing
Task 1 hiệu quả nhất, giúp bạn đạt điểm tối đa trong kỳ thi IELTS.
Lợi ích khi đọc tài liệu hướng dẫn của Simon:
Giải thích đầy đủ, cặn kẽ cách phân tích các dạng bài trong IELTS Writing Task 1.
Tổng hợp các dạng bài IELTS Writing Task 1 phổ biến nhất hiện nay.
Nâng cao vốn từ vựng về IELTS Writing Task 1
Lời giải đáp và hướng dẫn cách học dễ hiểu, xúc tích.
Là diễn đàn giúp các bạn chia sẻ kinh nghiệm và học IELTS online Miễn Phí hay
nhất.
Là tài liệu hay nhất mà các cao thủ IELTS săn lùng, học theo.
Là tài liệu hay nhất mà các thầy, cô giáo IELTS dùng làm nguồn tham khảo uy tín
cho học viên.
2
IELTS Thư Đặng
Tổng Hợp Bài Mẫu & Hướng Dẫn Làm Bài IELTS Writing Task 1- Simon
IELTS Writing Task 1: pie charts answer
Have a look at my full answer for the question below.
The pie charts below compare water usage in San Diego, California and the rest of the world.
mm
mm
The pie charts give information about the water used for residential, industrial and agricultural
purposes in San Diego County, California, and the world as a whole.
It is noticeable that more water is consumed by homes than by industry or agriculture in the two
American regions. By contrast, agriculture accounts for the vast majority of water used
worldwide.
In San Diego County and California State, residential water consumption accounts for 60% and
39% of total water usage. By contrast, a mere 8% of the water used globally goes to homes. The
opposite trend can be seen when we look at water consumption for agriculture. This accounts for
a massive 69% of global water use, but only 17% and 28% of water usage in San Diego and
California respectively.
Such dramatic differences are not seen when we compare the figures for industrial water use.
The same proportion of water (23%) is used by industry in San Diego and worldwide, while the
figure for California is 10% higher, at 33%.
(168 words, band 9)
3
IELTS Thư Đặng
Tổng Hợp Bài Mẫu & Hướng Dẫn Làm Bài IELTS Writing Task 1- Simon
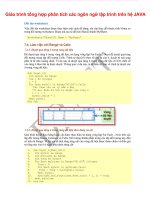
IELTS Writing Task 1: using a model sentence
The sentence below comes from a UK government website. It's a good example of how statistics
are described by native speakers in the 'real world'.
The number of live births in the UK in 2014 was 776,352, a decrease of 0.3% since 2013, when
there were 778,803 live births.
Let's try to use this sentence as a model. Can you write a similar sentence with the following
information?
In 2014, 80,000 UK students chose to study history
In 2013, 100,000 UK students chose to study history
Make sure that you use the same sentence order, the same tense, and the same punctuation. Try
to include the percentage decrease too.
FROM SIMON:
I think you've all got the right idea, but here's my sentence anyway:
The number of students who chose to study history in the UK in 2014 was 80,000, a decrease of
20% since 2013, when there were 100,000 history students.
IELTS Writing Task 1: general to specific
If you read any of my task 1 answers, you will see that I always write 4 paragraphs, and I use a
"general to specific" essay structure.
The introduction is the most general part of the report; it tells the reader what the chart
is about.
Then I write a short paragraph about the main / general points.
Finally, I write 2 paragraphs describing specific facts or figures.
I don't write a conclusion because I have already summarised the information in
paragraph 2.
One reason why I prefer to put the overview / summary near the beginning (rather than at the
end) is because I think it's easier to describe general things first, then specific things later.
IELTS Writing Task 1: 'water use' pie charts
The pie charts below compare water usage in San Diego, California and the rest of the world.
...
4
IELTS Thư Đặng
Tổng Hợp Bài Mẫu & Hướng Dẫn Làm Bài IELTS Writing Task 1- Simon
...
Introduction (just paraphrase the question):
The pie charts give information about the water used for residential, industrial and agricultural
purposes in San Diego County, California, and the world as a whole.
Overview (describe two main, general features):
It is noticeable that more water is consumed by homes than by industry or agriculture in the two
American regions. By contrast, agriculture accounts for the vast majority of water used
worldwide.
IELTS Writing Task 1: pie chart vocabulary
. Can you guess which words I used in the spaces shown?
1. In San Diego County and California State, residential water consumption _____ for
60% and 39% of total water usage _____.
2. In both US regions, the _____ for agricultural water use is significantly _____, at 17%
and 28%.
3. By contrast, a _____ 8% of the water used globally goes to homes, and a massive 69%
is required for agriculture.
IELTS Writing Task 1: charts showing countries
A few things to remember when the graph or chart shows countries:
1. If the question doesn't name the countries (e.g. "in three countries"), you could name
them in your introduction (e.g. "in Britain, France and Germany"). You could even
write "in three countries, namely Britain, France and Germany".
2. Don't forget the word "the" when writing about "the USA" and "the UK".
5
IELTS Thư Đặng
Tổng Hợp Bài Mẫu & Hướng Dẫn Làm Bài IELTS Writing Task 1- Simon
3. Always compare the countries; never describe the figures for each country in separate
paragraphs.
Finally, try to vary the way you write about countries. For example:
The number of elderly people in the USA rose.
The USA saw a rise in the number of elderly people.
The figure for the USA rose.
IELTS Writing Task 1: where to put the figure
Let's compare some sentences with figures in different positions.
1) Figures at the beginning of sentences:
10 million people voted in the election.
A quarter of the population voted.
25% of people voted in the election.
2) Figures at the end of sentences:
The number of people who voted in the election was 10 million.
The proportion of the population that voted was a quarter.
The figure for people who voted in the election was 25%.
For me, the sentences in the first group (with figures at the beginning) seem clearer and more
natural. While it's good to vary your sentence structure, it's probably best to have the "figure at
the beginning" structure as your first choice.
IELTS Vocabulary: paraphrasing and comparisons
the amount of time = the time spent
10 to 15-year-olds = aged between 10 and 15
chatting on the Internet = chatting online = chat online = engage in online conversation
playing on games consoles = playing computer games = play on their consoles
more popular = boys favour = girls prefer
the majority of = most of them = most girls
and the comparisons that I made?
...is more popular than...
Boys favour... / By contrast, girls prefer...
6
IELTS Thư Đặng
Tổng Hợp Bài Mẫu & Hướng Dẫn Làm Bài IELTS Writing Task 1- Simon
while 85% of boys..., only 55%...
close to 70% of girls..., compared to about 50% of this cohort who...
most of them..., whereas most...
IELTS Writing Task 1: stacked bar chart
The chart below shows the amount of time that 10 to 15-year-olds spend chatting on the
Internet and playing on games consoles on an average school day in the UK.
...
...
Before we write a description of this chart, here are a few quick questions:
1. Which activity is most popular overall?
2. What differences can you see between boys' and girls' habits?
3. What is the total figure for boys who play on games consoles?
4. What proportion of girls chat on the Internet for 4 hours or more?
...
Introduction
7
IELTS Thư Đặng
Tổng Hợp Bài Mẫu & Hướng Dẫn Làm Bài IELTS Writing Task 1- Simon
The bar chart compares the time spent by 10 to 15-year-olds in the UK on two activities,
namely chatting online and playing computer games.
Overview
Overall, we can see that playing computer games is marginally more popular than
chatting on the Internet. However, completely different trends can be seen if we look at
the specific figures for boys and girls.
IELTS Writing Task 1: 'details' paragraphs
Today I'll show you paragraphs 3 and 4, the 'details' paragraphs.
The chart below shows the amount of time that 10 to 15-year-olds spend chatting on the
Internet and playing on games consoles on an average school day in the UK.
Boys aged between 10 and 15 clearly favour playing on games consoles over chatting online.
According to the chart, while 85% of boys play computer games every day, only 55% chat online
daily. Furthermore, the majority of boys play on their consoles for more than one hour each day,
and 10% do this activity for four hours or more.
By contrast, girls prefer chatting online. Close to 70% of 10 to 15-year-old girls engage in online
conversation each day, compared to about 50% of this cohort who play computer games. Of the
8
IELTS Thư Đặng
Tổng Hợp Bài Mẫu & Hướng Dẫn Làm Bài IELTS Writing Task 1- Simon
girls who do play on consoles, most of them play for less than an hour, whereas most girls who
chat online do so for more than one hour, and nearly 10% chat for four hours or more.
Note:
I decided to write about boys in one paragraph and girls in the other. However, it would also be
fine to write paragraphs about chatting on the Internet and playing on consoles.
IELTS Writing Task 1: collocations
Collocations are groups of words that often go together. For example, I'm sure you've use the
collocation "increase significantly".
Here are some collocations from my most recent sample answer.
The bar chart compares the amount of time spent by people in the UK on three different types of
phone call between 1995 and 2002.
It is clear that calls made via local, fixed lines were the most popular type, in terms of overall
usage, throughout the period shown. The lowest figures on the chart are for mobile calls, but this
category also saw the most dramatic increase in user minutes.
In 1995, people in the UK used fixed lines for a total of just over 70 billion minutes for local
calls, and about half of that amount of time for national or international calls. By contrast, mobile
phones were only used for around 4 billion minutes. Over the following four years, the figures
for all three types of phone call increased steadily.
By 1999, the amount of time spent on local calls using landlines had reached a peak at 90 billion
minutes. Subsequently, the figure for this category fell, but the rise in the other two types of
phone call continued. In 2002, the number of minutes of national / international landline calls
passed 60 billion, while the figure for mobiles rose to around 45 billion minutes.
(197 words, band 9)
Typical writing task 1 collocations:
amount of time
the time spent on
in terms of
throughout the period
the period shown
a dramatic increase in
increased steadily
9
IELTS Thư Đặng
Tổng Hợp Bài Mẫu & Hướng Dẫn Làm Bài IELTS Writing Task 1- Simon
reached a peak
the figure for
the rise in
Collocations related to the 'phone calls' topic:
local calls
national calls
international calls
fixed line / landline calls
mobile calls
overall usage
user minutes
Tip: try using the online Oxford Collocations Dictionary.
IELTS Writing Task 1: mistakes in the introduction
Can you find and correct the mistakes in each of the introductions below? Why do you think
people make mistakes in their introductions?
1. The bar chart illustrates that the trend of call types in the united kingdom for 8 years
from 1995 to 2002.
2. The bar chart compares the figures in terms of minutes spent on telephone calls, splitted
into three types.
3. The bar chart gives information about telephone calls. It is in three types Local,
National & International and Mobile call minutes from year 1995 to 2002 in UK.
4. The graph compares the total using time of 3 call types in the UK over a 7-year period
from 1995.
5. The bar chart presents the amount of phone calls in billion of minutes make in the UK
over a period of seven years into the categories of local, national/international and
mobile phone calls.
To avoid mistakes, keep your introduction simple, like mine:
The bar chart compares the amount of time spent by people in the UK on three different types of
phone call between 1995 and 2002.
ANSWERS FROM SIMON:
10
IELTS Thư Đặng
Tổng Hợp Bài Mẫu & Hướng Dẫn Làm Bài IELTS Writing Task 1- Simon
The main problem seems to be that people are making the sentence too 'difficult'. If you read my
introduction (at the bottom of the lesson), it's easier and clearer than the students' sentences. Just
keep your introduction as simple as possible!
Here are the problems:
1. The main problem is the use of the word "that". Just write "The bar chart illustrates the amount
of time / the trend" etc.
2. The main mistake is the word "splitted". The past and past participle are "split" and "split".
3. The main problem is the phrase "It is in three types Local..." I don't know what the word "it"
refers to.
4. The phrase "the total using time of 3 call types" isn't right.
5. Problems with "make" and "into the categories.
FROM SIMON (continued):
Here are my suggestions:
1) The bar chart illustrates trends in different types of phone call in the United Kingdom over 8
years from 1995 to 2002.
2) The bar chart compares figures for UK phone calls in terms of minutes spent on three types of
call (between1995 and 2002).
3) The bar chart gives information about three types of telephone call, namely local,
national/international and mobile calls, in the UK between 1995 and 2002.
4) The chart compares the total number of minutes of three types of phone call made in the UK
over a 7-year period from 1995.
5) The bar chart shows the amount of time spent on three types of phone call, in billions of
minutes, in the UK over a period of seven years.
IELTS Writing Task 1: important little words
The following phrases are taken from the sample answer . Can you fill the gaps without checking
my answer?
The bar chart compares the amount of time spent by people in the UK on three different types of
phone call between 1995 and 2002.
11
IELTS Thư Đặng
Tổng Hợp Bài Mẫu & Hướng Dẫn Làm Bài IELTS Writing Task 1- Simon
It is clear that calls made via local, fixed lines were the most popular type, in terms of overall
usage, throughout the period shown. The lowest figures on the chart are for mobile calls, but this
category also saw the most dramatic increase in user minutes.
In 1995, people in the UK used fixed lines for a total of just over 70 billion minutes for local
calls, and about half of that amount of time for national or international calls. By contrast, mobile
phones were only used for around 4 billion minutes. Over the following four years, the figures
for all three types of phone call increased steadily.
By 1999, the amount of time spent on local calls using landlines had reached a peak at 90 billion
minutes. Subsequently, the figure for this category fell, but the rise in the other two types of
phone call continued. In 2002, the number of minutes of national / international landline calls
passed 60 billion, while the figure for mobiles rose to around 45 billion minutes.
(197 words, band 9)
Use these words: at, in, on, to, for, by
1. the amount of time spent _____ people in the UK _____ three different types of phone
call
2. calls made via local, fixed lines were the most popular type, _____ terms of overall
usage
3. the figures _____ all three types of phone call increased
4. the amount of time spent _____ local calls using landlines had reached a peak _____ 90
billion minutes
5. the rise _____ the other two types of phone call continued
6. the figure _____ mobiles rose _____ around 45 billion minutes
IELTS Writing Task 1: 'phone calls' bar chart
Several people have asked me for help with the following question, from Cambridge IELTS
book 9:
The chart below shows the total number of minutes (in billions) of telephone calls in the UK,
divided into three categories, from 1995-2002.
12
IELTS Thư Đặng
Tổng Hợp Bài Mẫu & Hướng Dẫn Làm Bài IELTS Writing Task 1- Simon
Here's my suggested outline for a 4-paragraph report:
1. Introduction: rewrite the question statement in your own words.
2. Overview: point out which category was highest in each year, which was lowest, and
which saw the biggest changes.
3. Details: compare the 3 categories in 1995, then say what happened up until 1999.
4. Details: notice what happened to local calls from 1999 onwards, and contrast this with
the other 2 categories. Finish with a comparison of the figures in 2002.
IELTS Writing Task 1: 'phone calls' introduction and overview
I'll finish paragraphs 3 and 4 next Thursday.
The bar chart compares the amount of time spent by people in the UK on three different types of
phone call between 1995 and 2002.
It is clear that calls made via local, fixed lines were the most popular type, in terms of overall
usage, throughout the period shown. The lowest figures on the chart are for mobile calls, but this
category also saw the most dramatic increase in user minutes.
13
IELTS Thư Đặng
Tổng Hợp Bài Mẫu & Hướng Dẫn Làm Bài IELTS Writing Task 1- Simon
Note:
Can you see the paraphrasing that I used in the introduction, and the main points that I chose for
the overview? Did I use any good words or phrases?
Here's my full answer for the 'phone calls' bar chart in this lesson:
The bar chart compares the amount of time spent by people in the UK on three different types of
phone call between 1995 and 2002.
It is clear that calls made via local, fixed lines were the most popular type, in terms of overall
usage, throughout the period shown. The lowest figures on the chart are for mobile calls, but this
category also saw the most dramatic increase in user minutes.
In 1995, people in the UK used fixed lines for a total of just over 70 billion minutes for local
calls, and about half of that amount of time for national or international calls. By contrast, mobile
phones were only used for around 4 billion minutes. Over the following four years, the figures
for all three types of phone call increased steadily.
By 1999, the amount of time spent on local calls using landlines had reached a peak at 90 billion
minutes. Subsequently, the figure for this category fell, but the rise in the other two types of
phone call continued. In 2002, the number of minutes of national / international landline calls
passed 60 billion, while the figure for mobiles rose to around 45 billion minutes.
(197 words, band 9)
IELTS Writing Task 1: 'living alone' charts
How would you write a report about the following charts?
The bar chart below shows the proportions of English men and women of different ages who
were living alone in 2011. The pie chart compares the numbers of bedrooms in these oneperson households.
...
Living alone in England by age and gender, 2011
14
IELTS Thư Đặng
Tổng Hợp Bài Mẫu & Hướng Dẫn Làm Bài IELTS Writing Task 1- Simon
Number of bedrooms in one-person households (England, 2011)
The two charts give information about single-occupant households in England in the year 2011.
The bar chart compares figures for occupants' age and gender, and the pie chart shows data about
the number of bedrooms in these homes.
Overall, females made up a higher proportion of people living alone than males, and this
difference is particularly noticeable in the older age categories. We can also see that the most
common number of bedrooms in a single-occupant home was two.
15
IELTS Thư Đặng
Tổng Hợp Bài Mẫu & Hướng Dẫn Làm Bài IELTS Writing Task 1- Simon
A significant majority of the people aged 65 or over who were living alone in England in 2011
were female. Women made up around 72% of single occupants aged 75 to 84, and 76% of those
aged 85 or over. By contrast, among younger adults the figures for males were higher. For
example, in the 35-49 age category, men accounted for nearly 65% of people living alone.
In the same year, 35.4% of one-person households in England had two bedrooms, while onebedroom and three-bedroom homes accounted for 28% and 29.8% of the total. Under 7% of
single-occupant homes had four or more bedrooms.
(189 words, band 9)
Tip:
Notice that I was forced to leave out some of the information from the bar chart. This is normal
when you only have 20 minutes; examiners expect you to select some key figures, not to try to
include everything.
IELTS Writing Task 1: don't use these phrases
Can you see what's wrong with the phrases below? Try to explain the problem with each phrase,
and suggest a better alternative.
1. The bar chart displays the percentage of...
2. A glance at the bar chart provided reveals...
3. From an overall perspective, it is clear from the evidence that...
4. Looking at the pie chart, it is noticed that...
5. As can be seen, the figures show that...
ANSWERS FROM SIMON:
First, it's important to point out that there were no grammar mistakes in the phrases. In each case,
the problem is that there is something 'unnatural', unnecessary, or inappropriate in the phrase.
Here are my suggestions.
I wouldn't use "displays". "The bar chart displays" seems strange to me as a native speaker. Just
stick with "shows", "compares" or "illustrates". Read this lesson:
/>"A glance at the bar chart reveals" is very strange - no native speaker would write this. Although
the meaning of "glance" is to look quickly, this word isn't appropriate in this context. Just use: "It
is clear that" or "it is noticeable that".
16
IELTS Thư Đặng
Tổng Hợp Bài Mẫu & Hướng Dẫn Làm Bài IELTS Writing Task 1- Simon
3. Just write: "Overall, it is clear that...". Adding the words "perspective" and "evidence"
just make the phrase seem forced and unnatural. The examiner won't be impressed.
4. Don't write "it is noticed that". Change it to "it is noticeable that".
5. "As can be seen" and "the figures show" seems like unnecessary repetition to me - too
many words for such a simple job. Just write "we can see that..." OR "the chart shows".
Don't write both phrases together.
NOTE:
The overall problem that I'm highlighting in this lesson is that so many students think that
"difficult" linking phrases are the key to a high score. They are not!
6. Remember: the examiner wants to read your description of the information shown on the
chart. Use short, simple linking phrases, and spend more time describing the information
in detail. This is the key to a high score. Look through my task 1 lessons to see how I
focus on the information rather than the linking.
IELTS Writing Task 1: table
Several people have asked me for help with the following task from Cambridge IELTS book 10.
The tables below give information about sales of Fairtrade*-labelled coffee and bananas in
1999 and 2004 in five European countries.
17
IELTS Thư Đặng
Tổng Hợp Bài Mẫu & Hướng Dẫn Làm Bài IELTS Writing Task 1- Simon
*Fairtrade: a category of products for which farmers from developing countries have been paid
an officially agreed fair price.
As usual, this is what we need to do:
1. Write an introduction by paraphrasing the question statement.
2. Write a summary of the information (2 sentences). Look for overall trends, not
individual numbers.
3. Select the most important information to describe in detail (include between 5 and 10
specific numbers from the table, for example). Try to group this description of details
into two paragraphs.
Sample:
The tables show the amount of money spent on Fairtrade coffee and bananas in two separate
years in the UK, Switzerland, Denmark, Belgium and Sweden.
It is clear that sales of Fairtrade coffee rose in all five European countries from 1999 to 2004, but
sales of Fairtrade bananas only went up in three out of the five countries. Overall, the UK saw by
far the highest levels of spending on the two products.
In 1999, Switzerland had the highest sales of Fairtrade coffee, at €3 million, while revenue from
Fairtrade bananas was highest in the UK, at €15 million. By 2004, however, sales of Fairtrade
coffee in the UK had risen to €20 million, and this was over three times higher than
Switzerland’s sales figure for Fairtrade coffee in that year. The year 2004 also saw dramatic
increases in the money spent on Fairtrade bananas in the UK and Switzerland, with revenues
rising by €32 million and €4.5 million respectively.
Sales of the two Fairtrade products were far lower in Denmark, Belgium and Sweden. Small
increases in sales of Fairtrade coffee can be seen, but revenue remained at €2 million or below in
all three countries in both years. Finally, it is noticeable that the money spent on Fairtrade
bananas actually fell in Belgium and Sweden.
Note:
This report is a bit longer (216 words) than necessary, but I think it's a useful model answer in
terms of its structure and the language used.
IELTS Writing Task 1: timing and introduction
20 minutes is a very short amount of time, so you need to be very organised. I suggest breaking
the 20 minutes into four parts, each lasting 5 minutes.
18
IELTS Thư Đặng
Tổng Hợp Bài Mẫu & Hướng Dẫn Làm Bài IELTS Writing Task 1- Simon
Part 1
First five minutes: read the question, understand it, underline key figures or trends, and write
your one-sentence introduction.
Parts 2, 3 and 4
Five minutes for each paragraph: overview, details, details.
IELTS Writing Task 1: easy but accurate
If you can use "less common" vocabulary correctly, that's great. However, using "difficult"
words or grammar often leads to lots of mistakes. It would be better to choose "easy but
accurate" language instead.
Here are the sentences from last week's lesson, with problems underlined:
1) The highest number of people residence in Australia are those living in cities.
2) The highest population of birth are those born within Australia.
3) This figure was over 50% of those given birth to outside Australia.
Let's rewrite these sentences in an "easy but accurate" way:
1) The majority of Australians live in cities.
2) Most of the people who live in Australia were born there.
3) This was over 50% higher than the figure for people born outside Australia.
Task:
Can you rewrite sentence 1 using residence, resident(s) or reside correctly?
FROM SIMON:
It's difficult to use "residence" in a natural way in this context, so I would avoid using that.
You could write:
- The majority of Australians are residents of cities.
- The majority of Australians reside in cities.
IELTS Writing Task 1: trying too hard!
One of my students asked me why she isn't getting band 7 in writing task 1. When I looked at
one of her reports, the main problem was clear:
She was trying too hard to use 'difficult' vocabulary or sentence constructions, and she was
making mistakes that could easily be avoided.
19
IELTS Thư Đặng
Tổng Hợp Bài Mẫu & Hướng Dẫn Làm Bài IELTS Writing Task 1- Simon
Here are some examples, with problems underlined:
1) The highest number of people residence in Australia are those living in cities.
2) The highest population of birth are those born within Australia.
3) This figure was over 50% of those given birth to outside Australia.
Can you suggest 'easier' versions of these sentences, without any mistakes?
FROM SIMON:
I'll show you my suggestions in next Thursday's lesson. For now, my tip is to be as simple as
possible:
1. Try using the verb "live" instead of the word "residence".
2. Try using "Most Australians..."
3. Try making a phrase with the word "born"
...
IELTS Writing Task 1: the most common mistake
The most common mistake in IELTS writing task 1 is not a grammar mistake.
Find the 2 big mistakes in the sentences below:
The unemployment rate in the UK rose by 2% between 2008 and 2009, whereas Canada
decreased by about 1%. The USA was the highest, at just over 4%.
FROM SIMON:
Here's the big mistake:
You can't write "Canada decreased" or "the USA was the highest".
These phrases don't make sense. Canada, the country, didn't decrease! We need to describe the
thing that decreased properly - in this case it's the "unemployment rate".
So, instead of saying that countries decreased or were highest, describe the topic properly. For
example:
- Unemployment in Canada decreased.
- The USA had the highest rate of unemployment.
Remember: saying that a country increases or decreases is very strange!
IELTS Advice: typical mistake in writing task 1
20
IELTS Thư Đặng
Tổng Hợp Bài Mẫu & Hướng Dẫn Làm Bài IELTS Writing Task 1- Simon
In case you didn't see my lesson on Thursday, or the answer I gave in the comments below it,
here's one of the most typical mistakes that I see people making in their writing task 1 answers:
They write things like "Canada decreased" or "the USA was the highest".
These phrases don't make sense. Canada, the country, didn't decrease! Youmust remember to
describe the topic properly. For example:
- Unemployment in Canada decreased.
- The USA had the highest rate of unemployment.
Remember: saying that a country increases or decreases sounds very strange!
IELTS Writing Task 1: pie chart and table
If you get a question like this one from Cambridge IELTS book 8, you don't need to worry about
comparing the two charts. Just describe them separately:
21
IELTS Thư Đặng
Tổng Hợp Bài Mẫu & Hướng Dẫn Làm Bài IELTS Writing Task 1- Simon
1. Introduction: say what each chart shows
2. Overview: write one general sentence about the pie chart, and one about the table
3. Details: describe the pie chart
4. Details: describe the table
Here's an example 'overview'. Notice that I write a separate sentence about each chart, and I
paraphrase several of the words from the question.
22
IELTS Thư Đặng
Tổng Hợp Bài Mẫu & Hướng Dẫn Làm Bài IELTS Writing Task 1- Simon
Overview (paragraph 2):
It is clear from the pie chart that there are three principal reasons why farmland becomes
degraded, and over-grazing is the main one. The table shows that Europe had a far higher
proportion of unproductive land than Oceania or North America in the 1990s.
Task: Find the examples of paraphrasing in the paragraph above.
IELTS Writing Task 1: 'school buildings' answer
Here's my full answer for the task below.
The diagrams below show the site of a school in 2004 and the plan for changes to the school
site in 2024.
(Source: Official IELTS Practice Materials 2)
The two pictures compare the layout of a school as it was in the year 2004 with a proposed site
design for the year 2024.
23
IELTS Thư Đặng
Tổng Hợp Bài Mẫu & Hướng Dẫn Làm Bài IELTS Writing Task 1- Simon
It is clear that the main change for 2024 involves the addition of a new school building. The
school will then be able to accommodate a considerably larger number of students.
In 2004, there were 600 pupils attending the school, and the two school buildings were separated
by a path running from the main entrance to the sports field. By 2024, it is expected that there
will be 1000 pupils, and a third building will have been constructed. Furthermore, the plan is to
join the two original buildings together, creating a shorter path that links the buildings only.
As the third building and a second car park will be built on the site of the original sports field, a
new, smaller sports field will need to be laid. A new road will also be built from the main
entrance to the second car park. Finally, no changes will be made to the main entrance and
original car park.
(183 words, band 9)
IELTS Writing Task 1: 'school building' diagrams
A student asked me to help with this question from Official IELTS Practice Materials book 2:
The diagrams below show the site of a school in 2004 and the plan for changes to the school
site in 2024.
24
IELTS Thư Đặng
Tổng Hợp Bài Mẫu & Hướng Dẫn Làm Bài IELTS Writing Task 1- Simon
Before trying to write a report for the question above, have a look at these lessons about similar
questions:
25
IELTS Thư Đặng
Tổng Hợp Bài Mẫu & Hướng Dẫn Làm Bài IELTS Writing Task 1- Simon