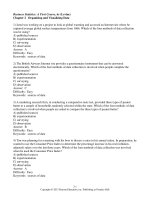
Introduction to business statistics 6th edition part 2
Bạn đang xem bản rút gọn của tài liệu. Xem và tải ngay bản đầy đủ của tài liệu tại đây (30.89 MB, 435 trang )
Chapter 10
Hypothesis Tests
Involving a Sample
Mean or Proportion
Fat-Free or Regular Pringles:
Can Tasters Tell the Difference?
© Michael Newman/PhotoEdit
When the makers of Pringles potato chips came out with new Fat-Free Pringles, they
wanted the fat-free chips to taste just as good as their already successful regular
Pringles. Did they succeed? In an independent effort to answer this question,
USA Today hired registered dietitian Diane Wilke to give 44 people a chance to see
whether they could tell the difference between the two kinds of Pringles. Each tester
was given two bowls of chips—one containing Fat-Free Pringles, the other containing
regular Pringles—and nobody was told which was which.
On average, if the two kinds of chips really taste the same, we’d expect such
testers to have a 50% chance of correctly identifying the bowl containing the fat-free
chips. However, 25 of the 44 testers (56.8%) successfully identified the bowl with the
fat-free chips.
Does this result mean that Pringles failed in its attempt to make the
products taste the same, or could the difference between
me?
lf the ti
the observed 56.8% and the theoretical
than ha
re
o
m
y
cantl
50% have happened just by
t signifi
r correc
te
s
ta
e
Is th
chance? Actually, if the chips
really taste the same and we were
to repeat this type of test many
times, pure chance would lead to
about 1͞5 of the tests yielding a
sample percentage at least as high
as the 56.8% observed here. Thus,
this particular test would not allow us
to rule out the possibility that the
chips taste the same. After reading
Sections 10.3 and 10.6 of this chapter,
you’ll be able to verify how we reached
this conclusion. For now, just trust us
and read on. Thanks.
Source: Beth Ashley, “Taste Testers Notice Little Difference
Between Products,” USA Today, September 30, 1996,
p. 6D. Interested readers may also refer to Fiona Haynes,
“Do Low-Fat Foods Really Taste Different?”,
, August 9, 2006.
310
Part 4: Hypothesis Testing
learning
objectives
After reading this
chapter, you should
be able to:
10.1
•
•
Describe the meaning of a null and an alternative hypothesis.
•
Describe what is meant by Type I and Type II errors, and explain how these can be
reduced in hypothesis testing.
•
Carry out a hypothesis test for a population mean or a population proportion,
interpret the results of the test, and determine the appropriate business
decision that should be made.
•
•
•
Determine and explain the p-value for a hypothesis test.
•
Determine and explain the operating characteristic curve for a hypothesis test
and a given decision rule.
Transform a verbal statement into appropriate null and alternative hypotheses,
including the determination of whether a two-tail test or a one-tail test is
appropriate.
Explain how confidence intervals are related to hypothesis testing.
Determine and explain the power curve for a hypothesis test and a given
decision rule.
INTRODUCTION
In statistics, as in life, nothing is as certain as the presence of uncertainty. However, just because we’re not 100% sure of something, that’s no reason why we
can’t reach some conclusions that are highly likely to be true. For example, if a
coin were to land heads 20 times in a row, we might be wrong in concluding that
it’s unfair, but we’d still be wise to avoid engaging in gambling contests with its
owner. In this chapter, we’ll examine the very important process of reaching conclusions based on sample information — in particular, of evaluating hypotheses
based on claims like the following:
•
•
Titus Walsh, the director of a municipal transit authority, claims that 35% of
the system’s ridership consists of senior citizens. In a recent study, independent
researchers find that only 23% of the riders observed are senior citizens.
Should the claim of Walsh be considered false?
Jackson T. Backus has just received a railroad car of canned beets from his
grocery supplier, who claims that no more than 20% of the cans are dented.
Jackson, a born skeptic, examines a random sample from the shipment and
finds that 25% of the cans sampled are dented. Has Mr. Backus bought a
batch of botched beets?
Each of the preceding cases raises a question of “believability” that can be
examined by the techniques of this chapter. These methods represent inferential
statistics, because information from a sample is used in reaching a conclusion
about the population from which the sample was drawn.
Null and Alternative Hypotheses
The first step in examining claims like the preceding is to form a null hypothesis,
expressed as H0 (“H sub naught”). The null hypothesis is a statement about the
value of a population parameter and is put up for testing in the face of numerical
evidence. The null hypothesis is either rejected or fails to be rejected.
Chapter 10: Hypothesis Tests Involving a Sample Mean or Proportion
The null hypothesis tends to be a “business as usual, nothing out of the ordinary is happening” statement that practically invites you to challenge its truthfulness. In the philosophy of hypothesis testing, the null hypothesis is assumed to be
true unless we have statistically overwhelming evidence to the contrary. In other
words, it gets the benefit of the doubt.
The alternative hypothesis, H1 (“H sub one”), is an assertion that holds if the
null hypothesis is false. For a given test, the null and alternative hypotheses
include all possible values of the population parameter, so either one or the other
must be false.
There are three possible choices for the set of null and alternative hypotheses
to be used for a given test. Described in terms of an (unknown) population mean
(), they might be listed as shown below. Notice that each null hypothesis has an
equality term in its statement (i.e., “ϭ,” “Ն,” or “Յ”).
Null
Hypothesis
Alternative
Hypothesis
H0: ϭ $10
H0: Ն $10
H0: Յ $10
H1: $10
H1: Ͻ $10
H1: Ͼ $10
( is $10, or it isn’t.)
( is at least $10, or it is less.)
( is no more than $10, or it is more.)
Directional and Nondirectional Testing
A directional claim or assertion holds that a population parameter is greater than
(Ͼ), at least (Ն), no more than (Յ), or less than (Ͻ) some quantity. For example,
Jackson’s supplier claims that no more than 20% of the beet cans are dented.
A nondirectional claim or assertion states that a parameter is equal to some
quantity. For example, Titus Walsh claims that 35% of his transit riders are senior
citizens.
Directional assertions lead to what are called one-tail tests, where a null
hypothesis can be rejected by an extreme result in one direction only. A nondirectional assertion involves a two-tail test, in which a null hypothesis can be rejected
by an extreme result occurring in either direction.
Hypothesis Testing and the Nature of the Test
When formulating the null and alternative hypotheses, the nature, or purpose, of
the test must also be taken into account. To demonstrate how (1) directionality
versus nondirectionality and (2) the purpose of the test can guide us toward the
appropriate testing approach, we will consider the two examples at the beginning
of the chapter. For each situation, we’ll examine (1) the claim or assertion leading
to the test, (2) the null hypothesis to be evaluated, (3) the alternative hypothesis,
(4) whether the test will be two-tail or one-tail, and (5) a visual representation of
the test itself.
Titus Walsh
1. Titus’ assertion: “35% of the riders are senior citizens.”
2. Null hypothesis: H0: ϭ 0.35, where ϭ the population proportion. The
null hypothesis is identical to his statement since he’s claimed an exact value
for the population parameter.
3. Alternative hypothesis: H1:
0.35. If the population proportion is not
0.35, then it must be some other value.
311
312
Part 4: Hypothesis Testing
FIGURE 10.1
Hypothesis tests can be
two-tail (a) or one-tail (b),
depending on the purpose
of the test. A one-tail test
can be either left-tail
(not shown) or
right-tail (b).
H0: p = 0.35
H1: p ≠ 0.35
Reject H0
Do not reject H0
Reject H0
0.35
Proportion of senior citizens in a random sample of transit riders
(a) Titus Walsh: “35% of the transit riders are senior citizens”
H0: p ≤ 0.20
H1: p > 0.20
Do not reject H0
Reject H0
0.20
Proportion of dented containers in a random sample of beet cans
(b) Jackson Backus' supplier: “No more than 20% of the cans are dented”
4. A two-tail test is used because the null hypothesis is nondirectional.
5. As part (a) of Figure 10.1 shows, ϭ 0.35 is at the center of the hypothesized
distribution, and a sample with either a very high proportion or a very low
proportion of senior citizens would lead to rejection of the null hypothesis.
Accordingly, there are reject areas at both ends of the distribution.
Jackson T. Backus
1. Supplier’s assertion: “No more than 20% of the cans are dented.”
2. Null hypothesis: H0: Յ 0.20, where ϭ the population proportion. In this
situation, the null hypothesis happens to be the same as the claim that led to
the test. This is not always the case when the test involves a directional claim
or assertion.
3. Alternative hypothesis: H1: Ͼ 0.20. Jackson’s purpose in conducting the
test is to determine whether the population proportion of dented cans could
really be greater than 0.20.
4. A one-tail test is used because the null hypothesis is directional.
5. As part (b) of Figure 10.1 shows, a sample with a very high proportion of
dented cans would lead to the rejection of the null hypothesis. A one-tail test
in which the rejection area is at the right is known as a right-tail test. Note
that in part (b) of Figure 10.1, the center of the hypothesized distribution is
identified as ϭ 0.20. This is the highest value for which the null hypothesis
could be true. From Jackson’s standpoint, this may be viewed as somewhat
conservative, but remember that the null hypothesis tends to get the benefit of
the doubt.
Chapter 10: Hypothesis Tests Involving a Sample Mean or Proportion
313
TABLE 10.1
A. VERBAL STATEMENT IS AN EQUALITY, “”؍.
Example: “Average tire life is 35,000 miles.”
H0:
H1:
ϭ 35,000 miles
35,000 miles
B. VERBAL STATEMENT IS “Ն” OR “Յ” (NOT Ͼ OR Ͻ).
Example: “Average tire life is at least 35,000 miles.”
H0:
H1:
Ն 35,000 miles
Ͻ 35,000 miles
Example: “Average tire life is no more than 35,000 miles.”
H0:
H1:
Յ 35,000 miles
Ͼ 35,000 miles
In directional tests, the directionality of the null and alternative hypotheses
will be in opposite directions and will depend on the purpose of the test. For
example, in the case of Jackson Backus, Jackson was interested in rejecting
H0: Յ 0.20 only if evidence suggested to be higher than 0.20. As we proceed
with the examples in the chapter, we’ll get more practice in formulating null and
alternative hypotheses for both nondirectional and directional tests. Table 10.1
offers general guidelines for proceeding from a verbal statement to typical null
and alternative hypotheses.
Errors in Hypothesis Testing
Whenever we reject a null hypothesis, there is a chance that we have made a
mistake — i.e., that we have rejected a true statement. Rejecting a true null
hypothesis is referred to as a Type I error, and our probability of making such
an error is represented by the Greek letter alpha (␣). This probability, which is
referred to as the significance level of the test, is of primary concern in hypothesis testing.
On the other hand, we can also make the mistake of failing to reject a false null
hypothesis — this is a Type II error. Our probability of making it is represented by
the Greek letter beta (). Naturally, if we either fail to reject a true null hypothesis
or reject a false null hypothesis, we’ve acted correctly. The probability of rejecting
a false null hypothesis is called the power of the test, and it will be discussed in
Section 10.7. The four possibilities are shown in Table 10.2 (page 314). In hypothesis testing, there is a necessary trade-off between Type I and Type II errors: For a
given sample size, reducing the probability of a Type I error increases the probability of a Type II error, and vice versa. The only sure way to avoid accepting false
claims is to never accept any claims. Likewise, the only sure way to avoid rejecting
true claims is to never reject any claims. Of course, each of these extreme
approaches is impractical, and we must usually compromise by accepting a reasonable risk of committing either type of error.
Categories of verbal
statements and typical null
and alternative hypotheses
for each
314
Part 4: Hypothesis Testing
TABLE 10.2
A summary of the
possibilities for mistakes
and correct decisions in
hypothesis testing. The
probability of incorrectly
rejecting a true null
hypothesis is ␣, the
significance level. The
probability that the test will
correctly reject a false null
hypothesis is (1 Ϫ ), the
power of the test.
THE NULL HYPOTHESIS (H0) IS REALLY
TRUE
“Do not reject H0”
FALSE
Correct decision.
Incorrect decision
(Type II error).
Probability of making
this error is .
Incorrect decision
(Type I error). Probability
of making this error is ␣,
the significance level.
Correct decision.
Probability (1 Ϫ ) is
the power of the test.
Hypothesis tests says
“Reject H0”
exercises
10.1 What is the difference between a null hypothesis and
an alternative hypothesis? Is the null hypothesis always the
same as the verbal claim or assertion that led to the test?
Why or why not?
10.2 For each of the following pairs of null and alterna-
tive hypotheses, determine whether the pair would be
appropriate for a hypothesis test. If a pair is deemed
inappropriate, explain why.
a. H0: Ն 10, H1: Ͻ 10
b. H0: ϭ 30, H1: 30
c. H0: Ͼ 90, H1: Յ 90
d. H0: Յ 75, H1: Յ 85
e. H0: x– Ն 15, H1: x– Ͻ 15
f. H0: x– ϭ 58, H1: x– 58
10.3 For each of the following pairs of null and alterna-
tive hypotheses, determine whether the pair would be
appropriate for a hypothesis test. If a pair is deemed
inappropriate, explain why.
a. H0: Ն 0.30, H1: Ͻ 0.35
b. H0: ϭ 0.72, H1: 0.72
c. H0: Յ 0.25, H1: Ͼ 0.25
d. H0: Ն 0.48, H1: Ͼ 0.48
e. H0: Յ 0.70, H1: Ͼ 0.70
f. H0: p Ն 0.65, H1: p Ͻ 0.65
10.4 The president of a company that manufactures
central home air conditioning units has told an
investigative reporter that at least 85% of its
homeowner customers claim to be “completely
satisfied” with the overall purchase experience. If the
reporter were to subject the president’s statement to
statistical scrutiny by questioning a sample of the company’s residential customers, would the test be one-tail
or two-tail? What would be the appropriate null and
alternative hypotheses?
10.5 On CNN and other news networks, guests often
express their opinions in rather strong, persuasive, and
sometimes frightening terms. For example, a scientist
who strongly believes that global warming is taking place
will warn us of the dire consequences (such as rising sea
levels, coastal flooding, and global climate change) she
foresees if we do not take her arguments seriously. If the
scientist is correct, and the world does not take her seriously, would this be a Type I error or a Type II error?
Briefly explain your reasoning.
10.6 Many law enforcement agencies use voice-stress
analysis to help determine whether persons under interrogation are lying. If the sound frequency of a person’s
voice changes when asked a question, the presumption is
that the person is being untruthful. For this situation,
state the null and alternative hypotheses in verbal terms,
then identify what would constitute a Type I error and a
Type II error in this situation.
10.7 Following a major earthquake, the city engineer
must determine whether the stadium is structurally sound
for an upcoming athletic event. If the null hypothesis is
“the stadium is structurally sound,” and the alternative
hypothesis is “the stadium is not structurally sound,”
which type of error (Type I or Type II) would the engineer
least like to commit?
10.8 A state representative is reported as saying that about
10% of reported auto thefts involve owners whose cars
have not really been stolen, but who are trying to defraud
their insurance company. What null and alternative
Chapter 10: Hypothesis Tests Involving a Sample Mean or Proportion
hypotheses would be appropriate in evaluating the
statement made by this legislator?
10.9 In response to the assertion made in Exercise 10.8,
suppose an insurance company executive were to claim
the percentage of fraudulent auto theft reports to be “no
more than 10%.” What null and alternative hypotheses
would be appropriate in evaluating the executive’s
statement?
10.10 For each of the following statements, formulate
appropriate null and alternative hypotheses. Indicate
whether the appropriate test will be one-tail or two-tail,
then sketch a diagram that shows the approximate location of the “rejection” region(s) for the test.
a. “The average college student spends no more than
$300 per semester at the university’s bookstore.”
b. “The average adult drinks 1.5 cups of coffee per
day.”
c. “The average SAT score for entering freshmen is at
least 1200.”
d. “The average employee put in 3.5 hours of overtime
last week.”
315
10.11 In administering a “field sobriety” test to suspected
drunks, officers may ask a person to walk in a straight
line or close his eyes and touch his nose. Define the Type I
and Type II errors in terms of this setting. Speculate on
physiological variables (besides the drinking of alcoholic
beverages) that might contribute to the chance of each
type of error.
10.12 In the judicial system, the defense attorney argues
for the null hypothesis that the defendant is innocent. In
general, what would be the result if judges instructed
juries to
a. never make a Type I error?
b. never make a Type II error?
c. compromise between Type I and Type II errors?
10.13 Regarding the testing of pharmaceutical companies’
claims that their drugs are safe, a U.S. Food and Drug
Administration official has said that it’s “better to turn
down 1000 good drugs than to approve one that’s
unsafe.” If the null hypothesis is H0: “The drug is not
harmful,” what type of error does the official appear to
favor?
HYPOTHESIS TESTING: BASIC PROCEDURES
There are several basic steps in hypothesis testing. They are briefly presented here
and will be further explained through examples that follow.
1. Formulate the null and alternative hypotheses. As described in the preceding
section, the null hypothesis asserts that a population parameter is equal to, no
more than, or no less than some exact value, and it is evaluated in the face of
numerical evidence. An appropriate alternative hypothesis covers other possible values for the parameter.
2. Select the significance level. If we end up rejecting the null hypothesis, there’s
a chance that we’re wrong in doing so—i.e., that we’ve made a Type I error.
The significance level is the maximum probability that we’ll make such a mistake. In Figure 10.1, the significance level is represented by the shaded area(s)
beneath each curve. For two-tail tests, the level of significance is the sum of
both tail areas. In conducting a hypothesis test, we can choose any significance level we desire. In practice, however, levels of 0.10, 0.05, and 0.01 tend
to be most common—in other words, if we reject a null hypothesis, the maximum chance of our being wrong would be 10%, 5%, or 1%, respectively.
This significance level will be used to later identify the critical value(s).
3. Select the test statistic and calculate its value. For the tests of this chapter, the
test statistic will be either z or t, corresponding to the normal and t distributions, respectively. Figure 10.2 (page 316) shows how the test statistic is selected.
An important consideration in tests involving a sample mean is whether the
population standard deviation () is known. As Figure 10.2 indicates, the z-test
(normal distribution and test statistic, z) will be used for hypothesis tests
involving a sample proportion.
10.2
316
Part 4: Hypothesis Testing
FIGURE 10.2
An overview of the process
of selecting a test statistic
for single-sample
hypothesis testing. Key
assumptions are reviewed
in the figure notes.
Hypothesis test,
one population
Population mean, m
Population proportion, p
Is np ≥ 5 and
n(1 – p) ≥ 5?
s known
s unknown
Is the population
truly or
approximately
normally
distributed?
Is the population
truly or
approximately
normally
distributed?
No
No
Is n ≥ 30?
Is n ≥ 30?
Yes
Yes
Yes
z-test, with
test statistic
x – m0
z = –––––
sx
where
s
sx = –––
√n
and m0 is from H0
Section 10.3
Note 1
No
Use
distribution-free
test.
No
Convert to
underlying
binomial
distribution.
Yes
t-test, with
test statistic
x – m0
t = –––––
sx
df = n – 1
s
sx = –––
√n
and m0 is from H0
z-test, with
test statistic
p – p0
z = –––––
sp
where
p0(1 – p0)
sp = –––––––––
n
and p0 is from H0
Section 10.5
Note 2
Section 10.6
Note 3
√
z distribution: If the population is not normally distributed, n should be Ն30 for the central limit theorem to apply.
The population is usually not known.
2The t distribution: For an unknown , and when the population is approximately normally distributed, the t-test
is appropriate regardless of the sample size. As n increases, the normality assumption becomes less important. If
n Ͻ 30 and the population is not approximately normal, nonparametric testing (e.g., the sign test for central tendency,
in Chapter 14) may be applied. The t-test is “robust” in terms of not being adversely affected by slight departures from
the population normality assumption.
3When n Ն 5 and n(1 Ϫ ) Ն 5, the normal distribution is considered to be a good approximation to the binomial distribution. If this condition is not met, the exact probabilities must be derived from the binomial distribution. Most practical business settings involving proportions satisfy this condition, and the normal approximation is used in this chapter.
1The
Chapter 10: Hypothesis Tests Involving a Sample Mean or Proportion
317
4. Identify critical value(s) for the test statistic and state the decision rule. The
critical value(s) will bound rejection and nonrejection regions for the null
hypothesis, H0. Such regions are shown in Figure 10.1. They are determined
from the significance level selected in step 2. In a one-tail test, there will
be one critical value since H0 can be rejected by an extreme result in just one
direction. Two-tail tests will require two critical values since H0 can be
rejected by an extreme result in either direction. If the null hypothesis
were really true, there would still be some probability (the significance level,
␣) that the test statistic would be so extreme as to fall into a rejection region.
The rejection and nonrejection regions can be stated as a decision rule specifying the conclusion to be reached for a given outcome of the test (e.g.,
“Reject H0 if z Ͼ 1.645, otherwise do not reject”).
5. Compare calculated and critical values and reach a conclusion about the null
hypothesis. Depending on the calculated value of the test statistic, it will fall
into either a rejection region or the nonrejection region. If the calculated
value is in a rejection region, the null hypothesis will be rejected. Otherwise,
the null hypothesis cannot be rejected. Failure to reject a null hypothesis does
not constitute proof that it is true, but rather that we are unable to reject it
at the level of significance being used for the test.
6. Make the related business decision. After rejecting or failing to reject the null
hypothesis, the results are applied to the business decision situation that precipitated the test in the first place. For example, Jackson T. Backus may decide
to return the entire shipment of beets to his distributor.
exercises
10.14 A researcher wants to carry out a hypothesis test
involving the mean for a sample of size n ϭ 18. She does
not know the true value of the population standard deviation, but is reasonably sure that the underlying population is approximately normally distributed. Should she
use a z-test or a t-test in carrying out the analysis? Why?
10.15 A research firm claims that 62% of women in the
40–49 age group save in a 401(k) or individual retirement
account. If we wished to test whether this percentage
could be the same for women in this age group living in
New York City and selected a random sample of 300
such individuals from New York, what would be the null
and alternative hypotheses? Would the test be a z-test or a
t-test? Why?
10.16 In hypothesis testing, what is meant by the decision
rule? What role does it play in the hypothesis-testing
procedure?
10.17 A manufacturer informs a customer’s design engi-
neers that the mean tensile strength of its rivets is at
least 3000 pounds. A test is set up to measure the tensile
strength of a sample of rivets, with the null and alternative hypotheses, H0: Ն 3000 and H1: Ͻ 3000. For
each of the following individuals, indicate whether the
person would tend to prefer a numerically very high
(e.g., ␣ ϭ 0.20) or a numerically very low (e.g.,
␣ ϭ 0.0001) level of significance to be specified for
the test.
a. The marketing director for a major competitor of the
rivet manufacturer.
b. The rivet manufacturer’s advertising agency, which
has already made the “at least 3000 pounds” claim in
national ads.
10.18 It has been claimed that no more than 5% of
the units coming off an assembly line are defective.
Formulate a null hypothesis and an alternative
hypothesis for this situation. Will the test be one-tail
or two-tail? Why? If the test is one-tail, will it be
left-tail or right-tail? Why?
318
Part 4: Hypothesis Testing
10.3
TESTING A MEAN, POPULATION STANDARD
DEVIATION KNOWN
Situations can occur where the population mean is unknown but past experience
has provided us with a trustworthy value for the population standard deviation.
Although this possibility is more likely in an industrial production setting, it can
sometimes apply to employees, consumers, or other nonmechanical entities.
In addition to the assumption that is known, the procedure of this section
assumes either (1) that the sample size is large (n Ն 30), or (2) that, if n Ͻ 30, the
underlying population is normally distributed. These assumptions are summarized
in Figure 10.2. If the sample size is large, the central limit theorem assures us that
the distribution of sample means will be approximately normally distributed,
regardless of the shape of the underlying distribution. The larger the sample size,
the better this approximation becomes. Because it is based on the normal distribution, the test is known as the z-test, and the test statistic is as follows:
Test statistic, z-test for a sample mean:
zϭ
N
O
T
E
x Ϫ 0
x
where x ϭ standard error for the
sample mean, ϭ /͙n
x ϭ sample mean
0 ϭ hypothesized population mean
n ϭ sample size
The symbol 0 is the value of that is assumed for purposes of the hypothesis
test.
Two-Tail Testing of a Mean, Known
example
Two-Tail Test
When a robot welder is in adjustment, its mean time to perform its task is 1.3250
minutes. Past experience has found the standard deviation of the cycle time to be
0.0396 minutes. An incorrect mean operating time can disrupt the efficiency of
other activities along the production line. For a recent random sample of 80 jobs,
the mean cycle time for the welder was 1.3229 minutes. The underlying data are
in file CX10WELD. Does the machine appear to be in need of adjustment?
SOLUTION
Formulate the Null and Alternative Hypotheses
H0:
H1:
ϭ 1.3250 minutes
1.3250 minutes
The machine is in adjustment.
The machine is out of adjustment.
In this test, we are concerned that the machine might be running at a mean speed
that is either too fast or too slow. Accordingly, the null hypothesis could be
Chapter 10: Hypothesis Tests Involving a Sample Mean or Proportion
319
FIGURE 10.3
H0: m = 1.3250 minutes
H1: m ≠ 1.3250 minutes
Reject H0
Do not reject H0
Reject H0
Area = 0.025
Area = 0.025
m0 = 1.3250 minutes
z = –1.96
z = +1.96
Test statistic:
z = –0.47
rejected by an extreme sample result in either direction. The hypothesized value
for the population mean is 0 ϭ 1.3250 minutes, shown at the center of the distribution in Figure 10.3.
Select the Significance Level
The significance level used will be ␣ ϭ 0.05. If the machine is running properly,
there is only a 0.05 probability of our making the mistake of concluding that it
requires adjustment.
Select the Test Statistic and Calculate Its Value
The population standard deviation () is known and the sample size is large, so
the normal distribution is appropriate and the test statistic will be z, calculated as
zϭ
x Ϫ 0 1.3229 Ϫ 1.3250 Ϫ0.0021
ϭ
ϭ
ϭ Ϫ0.47
x
0.00443
0.0396͙͞80
Identify Critical Values for the Test Statistic and State the Decision Rule
For a two-tail test using the normal distribution and ␣ ϭ 0.05, z ϭ Ϫ1.96 and
z ϭ ϩ1.96 will be the respective boundaries for lower and upper tails of 0.025
each. These are the critical values for the test, and they identify the rejection and
nonrejection regions shown in Figure 10.3. The decision rule can be stated as
“Reject H0 if calculated z Ͻ Ϫ1.96 or Ͼ ϩ1.96, otherwise do not reject.”
Compare Calculated and Critical Values and Reach a Conclusion for the
Null Hypothesis
The calculated value, z ϭ Ϫ0.47, falls within the nonrejection region of Figure 10.3.
At the 0.05 level of significance, the null hypothesis cannot be rejected.
Make the Related Business Decision
Based on these results, the robot welder is not in need of adjustment. The difference between the hypothesized population mean, 0 ϭ 1.3250 minutes, and the
observed sample mean, x ϭ 1.3229, is judged to have been merely the result of
chance variation.
When the robot welder is in
adjustment, the mean cycle
time is 1.3250 minutes. This
two-tail test at the 0.05
level of significance
indicates that the machine
is not out of adjustment.
320
N
Part 4: Hypothesis Testing
O
T
E
If we had used the sample information and the techniques of Chapter 9 to construct
a 95% confidence interval for , the interval would have been
xϮz
͙n
ϭ 1.3229 Ϯ 1.96
0.0396
͙80
, or from 1.3142 to 1.3316 minutes
Notice that the hypothesized value, 0 ϭ 1.3250 minutes, falls within the 95%
confidence interval—that is, the confidence interval tells us that could be 1.3250
minutes. This is the same conclusion we get from the nondirectional hypothesis test
using ␣ ϭ 0.05, and it is not a coincidence. A 100(1 Ϫ ␣)% confidence interval is
equivalent to a nondirectional hypothesis test at the ␣ level, a relationship that will be
discussed further in Section 10.4.
One-Tail Testing of a Mean, Known
example
One-Tail Test
The lightbulbs in an industrial warehouse have been found to have a mean lifetime of 1030.0 hours, with a standard deviation of 90.0 hours. The warehouse
manager has been approached by a representative of Extendabulb, a company
that makes a device intended to increase bulb life. The manager is concerned that
the average lifetime of Extendabulb-equipped bulbs might not be any greater than
the 1030 hours historically experienced. In a subsequent test, the manager tests
40 bulbs equipped with the device and finds their mean life to be 1061.6 hours.
The underlying data are in file CX10BULB. Does Extendabulb really work?
SOLUTION
Formulate the Null and Alternative Hypotheses
The warehouse manager’s concern that Extendabulb-equipped bulbs might not be
any better than those used in the past leads to a directional test. Accordingly, the
null and alternative hypotheses are:
H0:
H1:
Յ 1030.0 hours
Ͼ 1030.0 hours
Extendabulb is no better than the present system.
Extendabulb really does increase bulb life.
At the center of the hypothesized distribution will be the highest possible value for
which H0 could be true, 0 ϭ 1030.0 hours.
Select the Significance Level
The level chosen for the test will be ␣ ϭ 0.05. If Extendabulb really has no favorable effect, the maximum probability of our mistakenly concluding that it does
will be 0.05.
Select the Test Statistic and Calculate Its Value
As in the previous test, the population standard deviation () is known and the
sample size is large, so the normal distribution is appropriate and the test statistic
will be z. It is calculated as
x Ϫ 0 1061.6 Ϫ 1030.0
ϭ
ϭ 2.22
zϭ
x
90.0͙͞40
Chapter 10: Hypothesis Tests Involving a Sample Mean or Proportion
321
FIGURE 10.4
H0: m ≤ 1030 hours
H1: m > 1030 hours
Do not reject H0
Reject H0
Area = 0.05
m0 = 1030 hours
z = +1.645
Test statistic:
z = 2.22
Select the Critical Value for the Test Statistic and State the Decision Rule
For a right-tail z-test in which ␣ ϭ 0.05, z ϭ ϩ1.645 will be the boundary separating the nonrejection and rejection regions. This critical value for the test is included
in Figure 10.4. The decision rule can be stated as “Reject H0 if calculated
z Ͼ ϩ1.645, otherwise do not reject.”
Compare Calculated and Critical Values and Reach a Conclusion for the
Null Hypothesis
The calculated value, z ϭ ϩ2.22, falls within the rejection region of the diagram
in Figure 10.4. At the 0.05 level of significance, the null hypothesis is rejected.
Make the Related Business Decision
The results suggest that Extendabulb does increase the mean lifetime of the bulbs.
The difference between the mean of the hypothesized distribution, 0 ϭ 1030.0
hours, and the observed sample mean, x ϭ 1061.6, is judged too great to have
occurred by chance. The firm may wish to incorporate Extendabulb into its warehouse lighting system.
Other Levels of Significance
This test was conducted at the 0.05 level, but would the conclusion have been different if other levels of significance had been used instead? Consider the following
possibilities:
•
•
•
For the 0.05 level of significance at which the test was conducted. The critical
z is ϩ1.645, and the calculated value, z ϭ 2.22, exceeds it. The null hypothesis is rejected, and we conclude that Extendabulb does increase bulb life.
For the 0.025 level of significance. The critical z is ϩ1.96, and the calculated
value, z ϭ 2.22, exceeds it. The null hypothesis is rejected, and we again conclude that Extendabulb increases bulb life.
For the 0.005 level of significance. The critical z is ϩ2.58, and the calculated
value, z ϭ 2.22, does not exceed it. The null hypothesis is not rejected, and we
conclude that Extendabulb does not increase bulb life.
The warehouse manager
is concerned that
Extendabulb might not
increase the lifetime of
lightbulbs. This right-tail
test at the 0.05 level
suggests otherwise.
322
Part 4: Hypothesis Testing
As these possibilities suggest, using different levels of significance can lead to
quite different conclusions. Although the primary purpose of this exercise was to
give you a little more practice in hypothesis testing, consider these two key questions: (1) If you were the manufacturer of Extendabulb, which level of significance would you prefer to use in evaluating the test results? (2) On which level of
significance might the manufacturer of a competing product wish to rely in discussing the Extendabulb test? We will now examine these questions in the context
of describing the p-value method for hypothesis testing.
The p-value Approach to Hypothesis Testing
There are two basic approaches to conducting a hypothesis test:
•
•
Using a predetermined level of significance, establish critical value(s), then see
whether the calculated test statistic falls into a rejection region for the test. This
is similar to placing a high-jump bar at a given height, then seeing whether you
can clear it.
Determine the exact level of significance associated with the calculated value
of the test statistic. In this case, we’re identifying the most extreme critical
value that the test statistic would be capable of exceeding. This is equivalent
to your jumping as high as you can with no bar in place, then having
the judges tell you how high you would have cleared if there had been a
crossbar.
In the two tests carried out previously, we used the first of these approaches,
making the hypothesis test a “yes–no” decision. In the Extendabulb example,
however, we did allude to what we’re about to do here by trying several different
significance levels in our one-tail test examining the ability of Extendabulb to
increase the lifetime of lightbulbs.
We saw that Extendabulb showed a significant improvement at the 0.05 and
0.025 levels, but was not shown to be effective at the 0.005 level. In our highjumping analogy, we might say that Extendabulb “cleared the bar” at the 0.05
level, cleared it again when it was raised to the more demanding 0.025 level, but
couldn’t quite make the grade when the bar was raised to the very demanding
0.005 level of significance. In summary:
•
•
•
•
0.05 level Extendabulb significantly increases bulb life (e.g., “clears the
high-jump bar”).
0.025 level Extendabulb significantly increases bulb life (“clears the bar”).
p-value level Extendabulb just barely shows significant improvement in bulb
life (“clears the bar, but lightly touches it on the way over”).
0.005 level Extendabulb shows no significant improvement in bulb life
(“insufficient height, fails to clear”).
As suggested by the preceding, and illustrated in part (a) of Figure 10.5, there
is some level of significance (the p-value) where the calculated value of the test
statistic is exactly the same as the critical value. For a given set of data, the p-value
is sometimes referred to as the observed level of significance. It is the lowest possible level of significance at which the null hypothesis can be rejected. (Note: The
lowercase p in “p-value” is not related to the symbol for the sample proportion.)
For the Extendabulb test, the calculated value of the test statistic was z ϭ 2.22.
For a critical z ϭ ϩ2.22, the right-tail area can be found using the normal distribution table at the back of the book.
Chapter 10: Hypothesis Tests Involving a Sample Mean or Proportion
323
FIGURE 10.5
p-value = 0.0132
m0 = 1030 hours
(a) p-value for one-tail (Extendabulb) example of Figure 10.4
Test statistic:
z = 2.22
p-value = 2(0.3192) = 0.6384
p-value/2 = 0.3192
p-value/2 = 0.3192
m0 = 1.3250 minutes
Test statistic:
z = –0.47
z = +0.47
(b) p-value for two-tail (robot welder) example of Figure 10.3
Referring to the normal distribution table, we see that 2.22 standard error units
to the right of the mean includes an area of 0.4868, leaving (0.5000 Ϫ 0.4868), or
0.0132, in the right-tail area. This identifies the most demanding level of significance that Extendabulb could have achieved. If we had originally specified a
significance level of 0.0132 for our test, the critical value for z would have been
exactly the same as the value calculated. Thus, the p-value for the Extendabulb test
is found to be 0.0132.
The Extendabulb example was a one-tail test — accordingly, the p-value was
the area in just one tail. For two-tail tests, such as the robot welder example of
Figure 10.3, the p-value will be the sum of both tail areas, as shown in part (b) of
Figure 10.5. The calculated test statistic was z ϭ Ϫ0.47, resulting in an area
of (0.5000 Ϫ 0.1808), or 0.3192, in the left tail of the distribution. Since the
robot welder test was two-tail, the 0.3192 must be multiplied by 2 to get the
p-value of 0.6384.
The p-value of a test is
the level of significance
where the observed value
of the test statistic is
exactly the same as a
critical value for that level.
These diagrams show the
p-values, as calculated in
the text, for two of the
tests performed in this
section. When the
hypothesis test is two-tail,
as in part (b), the p-value is
the sum of two tail areas.
324
Part 4: Hypothesis Testing
Computer-Assisted Hypothesis Tests and p-values
When the hypothesis test is computer-assisted, the output will include a p-value
for your interpretation. Regardless of whether a p-value has been approximated
by your own calculations and table reference, or is a more exact value included in
a computer printout, it can be interpreted as follows:
Interpreting the p-value in a computer printout:
Yes
Reject the null hypothesis. The sample result
is more extreme than you would have been
willing to attribute to chance.
No
Do not reject the null hypothesis. The
sample result is not more extreme than you
would have been willing to attribute to chance.
Is the p-value < your specified level
of significance, a?
Computer Solutions 10.1 shows how we can use Excel or Minitab to carry out
a hypothesis test for the mean when the population standard deviation is known or
assumed. In this case, we are replicating the hypothesis test in Figure 10.4, using the
40 data values in file CX10BULB. The printouts in Computer Solutions 10.1 show
the p-value (0.0132) for the test. This p-value is essentially making the following
statement: “If the population mean really is 1030 hours, there is only a 0.0132
probability of getting a sample mean this large (1061.6 hours) just by chance.”
Because the p-value is less than the level of significance we are using to reach our
conclusion (i.e., p-value ϭ 0.0132 is Ͻ ␣ ϭ 0.05), H0: Յ 1030 is rejected.
computer solutions 10.1
Hypothesis Test for Population Mean, Known
These procedures show how to carry out a hypothesis test for the population mean when the population
standard deviation is known.
EXCEL
1
2
3
4
5
6
7
8
9
10
11
12
A
Z-Test: Mean
B
Mean
Standard Deviation
Observations
Hypothesized Mean
SIGMA
z Stat
P(Z<=z) one-tail
z Critical one-tail
P(Z<=z) two-tail
z Critical two-tail
C
D
hours
1061.61
93.60
40
1030
90
2.221
0.0132
1.645
0.0264
1.96
Chapter 10: Hypothesis Tests Involving a Sample Mean or Proportion
325
Excel hypothesis test for based on raw data and known
1. For example, for the 40 bulb lifetimes (file CX10BULB.XLS) on which Figure 10.4 is based, with the label and 40 data
values in A1:A41: Click Tools. Click Data Analysis Plus. Click Z-Test: Mean. Click OK.
2. Enter A1:A41 into the Input Range box. Enter the hypothesized mean (1030) into the Hypothesized Mean box.
Enter the known population standard deviation (90.0) into the Standard Deviation (SIGMA) box. Click Labels, since
the variable name is in the first cell within the field. Enter the level of significance for the test (0.05) into the Alpha
box. Click OK. The printout includes the p-value for this one-tail test, 0.0132.
Excel hypothesis test for based on summary statistics and known
1. For example, with x ϭ 1061.6, ϭ 90.0, and n ϭ 40, as in Figure 10.4: Open the TEST STATISTICS.XLS workbook,
supplied with the text.
2. Using the arrows at the bottom left, select the z-Test_Mean worksheet. Enter the sample mean (1061.6), the known sigma
(90.0), the sample size (40), the hypothesized population mean (1030), and the level of significance for the test (0.05).
(Note: As an alternative, you can use Excel worksheet template TMZTEST.XLS, supplied with the text. The steps are
described within the template.)
MINITAB
Minitab hypothesis test for based on raw data and known
One-Sample Z: hours
Test of mu = 1030 vs > 1030
The assumed standard deviation = 90
Variable
hours
N
40
Mean
1061.6
StDev
93.6
SE Mean
14.2
95%
Lower
Bound
1038.2
Z
2.22
P
0.013
1. For example, using the data (file CX10BULB.MTW) on which Figure 10.4 is based, with the 40 data values in column C1:
Click Stat. Select Basic Statistics. Click 1-Sample Z.
2. Select Samples in Columns and enter C1 into the box. Enter the known population standard deviation (90.0) into
the Standard deviation box. Select Perform hypothesis test and enter the hypothesized population mean (1030)
into the Hypothesized mean: box.
3. Click Options. Enter the desired confidence level as a percentage (95.0) into the Confidence Level box. Within the
Alternative box, select greater than. Click OK. Click OK. By default, this test also provides the lower boundary of
the 95% confidence interval (unless another confidence level has been specified).
Minitab hypothesis test for based on summary statistics and known
Follow the procedure in steps 1 through 3, above, but in step 2 select Summarized data and enter 40 and 1061.6 into
the Sample size and Mean boxes, respectively.
exercises
applicable to hypothesis testing?
necessary to use the z-statistic in carrying out a hypothesis
test for the population mean?
10.20 If the population standard deviation is known,
10.21 What is a p-value, and how is it relevant to
but the sample size is less than 30, what assumption is
hypothesis testing?
10.19 What is the central limit theorem, and how is it
326
Part 4: Hypothesis Testing
10.22 The p-value for a hypothesis test has been reported
10.31 Following maintenance and calibration, an extru-
as 0.03. If the test result is interpreted using the ␣ ϭ 0.05
level of significance as a criterion, will H0 be rejected?
Explain.
sion machine produces aluminum tubing with a mean outside diameter of 2.500 inches, with a standard deviation
of 0.027 inches. As the machine functions over an
extended number of work shifts, the standard deviation
remains unchanged, but the combination of accumulated
deposits and mechanical wear causes the mean diameter
to “drift” away from the desired 2.500 inches. For a
recent random sample of 34 tubes, the mean diameter was
2.509 inches. At the 0.01 level of significance, does the
machine appear to be in need of maintenance and calibration? Determine and interpret the p-value for the test.
10.23 The p-value for a hypothesis test has been reported
as 0.04. If the test result is interpreted using the ␣ ϭ 0.01
level of significance as a criterion, will H0 be rejected?
Explain.
10.24 A hypothesis test is carried out using the ␣ ϭ 0.01
level of significance, and H0 cannot be rejected. What
is the most accurate statement we can make about the
p-value for this test?
10.25 For each of the following tests and z values,
determine the p-value for the test:
a. Right-tail test and z ϭ 1.54
b. Left-tail test and z ϭ Ϫ1.03
c. Two-tail test and z ϭ Ϫ1.83
10.26 For each of the following tests and z values, deter-
mine the p-value for the test:
a. Left-tail test and z ϭ Ϫ1.62
b. Right-tail test and z ϭ 1.43
c. Two-tail test and z ϭ 1.27
10.32 A manufacturer of electronic kits has found that the
mean time required for novices to assemble its new circuit
tester is 3 hours, with a standard deviation of 0.20 hours.
A consultant has developed a new instructional booklet
intended to reduce the time an inexperienced kit builder
will need to assemble the device. In a test of the effectiveness of the new booklet, 15 novices require a mean of
2.90 hours to complete the job. Assuming the population
of times is normally distributed, and using the 0.05 level
of significance, should we conclude that the new booklet
is effective? Determine and interpret the p-value for the
test.
10.27 For a sample of 35 items from a population for
which the standard deviation is ϭ 20.5, the sample
mean is 458.0. At the 0.05 level of significance, test
H0: ϭ 450 versus H1: 450. Determine and
interpret the p-value for the test.
10.28 For a sample of 12 items from a normally
distributed population for which the standard deviation
is ϭ 17.0, the sample mean is 230.8. At the 0.05 level
of significance, test H0: Յ 220 versus H1: Ͼ 220.
Determine and interpret the p-value for the test.
10.29 A quality-assurance inspector periodically
examines the output of a machine to determine whether
it is properly adjusted. When set properly, the machine
produces nails having a mean length of 2.000 inches,
with a standard deviation of 0.070 inches. For a sample
of 35 nails, the mean length is 2.025 inches. Using the
0.01 level of significance, examine the null hypothesis
that the machine is adjusted properly. Determine and
interpret the p-value for the test.
10.30 In the past, patrons of a cinema complex have
spent an average of $2.50 for popcorn and other snacks,
with a standard deviation of $0.90. The amounts of these
expenditures have been normally distributed. Following
an intensive publicity campaign by a local medical
society, the mean expenditure for a sample of 18 patrons
is found to be $2.10. In a one-tail test at the 0.05 level
of significance, does this recent experience suggest a
decline in spending? Determine and interpret the p-value
for the test.
/ data set / Note: Exercises 10.33 and 10.34 require
a computer and statistical software.
10.33 According to Remodeling magazine, the average
cost to convert an existing room into a home office with
custom cabinetry and rewiring for electronic equipment is
$5976. Assuming a population standard deviation of
$1000 and the sample of home office conversion prices
charged for 40 recent jobs performed by builders in a
region of the United States, examine whether the mean
price for home office conversions for builders in this
region might be different from the average for the nation
as a whole. The underlying data are in file XR10033.
Identify and interpret the p-value for the test. Using the
0.025 level of significance, what conclusion will be
reached? SOURCE: National Association of Homebuilders, 1998 Housing
Facts, Figures, and Trends, p. 38.
10.34 A machine that fills shipping containers with drive-
way filler mix is set to deliver a mean fill weight of 70.0
pounds. The standard deviation of fill weights delivered
by the machine is known to be 1.0 pounds. For a recent
sample of 35 containers, the fill weights are listed in data
file XR10034. Using the mean for this sample, and assuming that the population standard deviation has remained
unchanged at 1.0 pounds, examine whether the mean fill
weight delivered by the machine might now be something
other than 70.0 pounds. Identify and interpret the p-value
for the test. Using the 0.05 level of significance, what
conclusion will be reached?
Chapter 10: Hypothesis Tests Involving a Sample Mean or Proportion
CONFIDENCE INTERVALS AND HYPOTHESIS TESTING
In Chapter 9, we constructed confidence intervals for a population mean or proportion. In this chapter, we sometimes carry out nondirectional tests for the null
hypothesis that the population mean or proportion could have a given value.
Although the purposes may differ, the concepts are related.
In the previous section, we briefly mentioned this relationship in the context of
the nondirectional test summarized in Figure 10.3. Consider this nondirectional
test, carried out at the ␣ ϭ 0.05 level:
1. Null and alternative hypotheses: H0: ϭ 1.3250 minutes and H1: 1.3250
minutes.
2. The standard error of the mean: x ϭ ͙͞n ϭ 0.0396͙͞80, or 0.00443
minutes.
3. The critical z values for a two-tail test at the ␣ ϭ 0.05 level are z ϭ Ϫ1.96
and z ϭ ϩ1.96.
4. Expressing these z values in terms of the sample mean, critical values for x
would be calculated as 1.325 Ϯ 1.96(0.00443), or 1.3163 minutes and 1.3337
minutes.
5. The observed sample mean was x ϭ 1.3229 minutes. This fell within the
acceptable limits and we were not able to reject H0.
Based on the ␣ ϭ 0.05 level, the nondirectional hypothesis test led us to conclude that H0: ϭ 1.3250 minutes was believable. The observed sample mean
(1.3229 minutes) was close enough to the 1.3250 hypothesized value that the difference could have happened by chance.
Now let’s approach the same situation by using a 95% confidence interval. As
noted previously, the standard error of the sample mean is 0.00443 minutes. Based on
the sample results, the 95% confidence interval for is 1.3229 Ϯ 1.96(0.00443), or
from 1.3142 minutes to 1.3316 minutes. In other words, we have 95% confidence
that the population mean is somewhere between 1.3142 minutes and 1.3316 minutes.
If someone were to suggest that the population mean were actually 1.3250 minutes,
we would find this believable, since 1.3250 falls within the likely values for that
our confidence interval represents.
The nondirectional hypothesis test was done at the ␣ ϭ 0.05 level, the confidence interval was for the 95% confidence level, and the conclusion was the same
in each case. As a general rule, we can state that the conclusion from a nondirectional hypothesis test for a population mean at the ␣ level of significance will be
the same as the conclusion based on a confidence interval at the 100(1 Ϫ ␣)%
confidence level.
When a hypothesis test is nondirectional, this equivalence will be true. This
exact statement cannot be made about confidence intervals and directional tests —
although they can also be shown to be related, such a demonstration would take
us beyond the purposes of this chapter. Suffice it to say that confidence intervals
and hypothesis tests are both concerned with using sample information to make a
statement about the (unknown) value of a population mean or proportion. Thus,
it is not surprising that their results are related.
By using Seeing Statistics Applet 12, at the end of the chapter, you can see how
the confidence interval (and the hypothesis test conclusion) would change in
response to various possible values for the sample mean.
327
10.4
328
Part 4: Hypothesis Testing
exercises
10.35 Based on sample data, a confidence interval has
been constructed such that we have 90% confidence that
the population mean is between 120 and 180. Given this
information, provide the conclusion that would be
reached for each of the following hypothesis tests at
the ␣ ϭ 0.10 level:
a. H0: ϭ 170 versus H1: 170
b. H0: ϭ 110 versus H1: 110
c. H0: ϭ 130 versus H1: 130
d. H0: ϭ 200 versus H1: 200
10.36 Given the information in Exercise 10.27, construct
a 95% confidence interval for the population mean, then
reach a conclusion regarding whether could actually
10.5
be equal to the value that has been hypothesized. How
does this conclusion compare to that reached in
Exercise 10.27? Why?
10.37 Given the information in Exercise 10.29, construct
a 99% confidence interval for the population mean, then
reach a conclusion regarding whether could actually
be equal to the value that has been hypothesized. How
does this conclusion compare to that reached in
Exercise 10.29? Why?
10.38 Use an appropriate confidence interval in reaching
a conclusion regarding the problem situation and null
hypothesis for Exercise 10.31.
TESTING A MEAN, POPULATION STANDARD
DEVIATION UNKNOWN
The true standard deviation of a population will usually be unknown. As Figure 10.2 shows, the t-test is appropriate for hypothesis tests in which the sample
standard deviation (s) is used in estimating the value of the population standard
deviation, . The t-test is based on the t distribution (with number of degrees of
freedom, df ϭ n Ϫ 1) and the assumption that the population is approximately
normally distributed. As the sample size becomes larger, the assumption of population normality becomes less important.
As we observed in Chapter 9, the t distribution is a family of distributions
(one for each number of degrees of freedom, df ). When df is small, the t distribution is flatter and more spread out than the normal distribution, but for larger
degrees of freedom, successive members of the family more closely approach the
normal distribution. As the number of degrees of freedom approaches infinity, the
two distributions become identical.
Like the z-test, the t-test depends on the sampling distribution for the sample
mean. The appropriate test statistic is similar in appearance, but includes s instead
of , because s is being used to estimate the (unknown) value of . The test statistic can be calculated as follows:
Test statistic, t-test for a sample mean:
tϭ
x Ϫ 0
sx
where sx– ϭ estimated standard error for the
sample mean, ϭ s/͙n
x ϭ sample mean
0 ϭ hypothesized population mean
n ϭ sample size
Chapter 10: Hypothesis Tests Involving a Sample Mean or Proportion
Two-Tail Testing of a Mean, Unknown
example
Two-Tail Test
The credit manager of a large department store claims that the mean balance for
the store’s charge account customers is $410. An independent auditor selects a
random sample of 18 accounts and finds a mean balance of x ϭ $511.33 and
a standard deviation of s ϭ $183.75. The sample data are in file CX10CRED. If
the manager’s claim is not supported by these data, the auditor intends to examine all charge account balances. If the population of account balances is
assumed to be approximately normally distributed, what action should the
auditor take?
SOLUTION
Formulate the Null and Alternative Hypotheses
H0:
H1:
ϭ $410
$410
The mean balance is actually $410.
The mean balance is some other value.
In evaluating the manager’s claim, a two-tail test is appropriate since it is a nondirectional statement that could be rejected by an extreme result in either direction.
The center of the hypothesized distribution of sample means for samples of
n ϭ 18 will be 0 ϭ $410.
Select the Significance Level
For this test, we will use the 0.05 level of significance. The sum of the two tail
areas will be 0.05.
Select the Test Statistic and Calculate Its Value
The test statistic is t ϭ (x Ϫ 0)͞sx , and the t distribution will be used to describe
the sampling distribution of the mean for samples of n ϭ 18. The center of the
distribution is 0 ϭ $410, which corresponds to t ϭ 0.000. Since the population
standard deviation is unknown, s is used to estimate . The sampling distribution
has an estimated standard error of
sx ϭ
$183.75
s
ϭ $43.31
ϭ
͙18
͙n
and the calculated value of t will be
tϭ
x Ϫ 0
$511.33 Ϫ $410.00
ϭ
ϭ 2.340
sx
$43.31
Identify Critical Values for the Test Statistic and State the Decision Rule
For this test, ␣ ϭ 0.05, and the number of degrees of freedom will be
df ϭ (n Ϫ 1), or (18 Ϫ 1) ϭ 17. The t distribution table at the back of the book
provides one-tail areas, so we must identify the boundaries where each tail area is
one-half of ␣, or 0.025. Referring to the 0.025 column and 17th row of the table,
the critical values for the test statistic are found to be t ϭ Ϫ2.110 and
t ϭ ϩ2.110. (Although the “Ϫ2.110” is not shown in the table, we can identify
329
330
Part 4: Hypothesis Testing
FIGURE 10.6
The credit manager has
claimed that the mean
balance of his charge
customers is $410, but the
results of this two-tail test
suggest otherwise.
H0: m = $410
H1: m ≠ $410
Reject H0
Do not reject H0
Reject H0
Area = 0.025
Area = 0.025
m0 = $410
t = –2.110
t = +2.110
Test statistic:
t = 2.340
this as the left-tail boundary because the distribution is symmetrical.) The rejection and nonrejection areas are shown in Figure 10.6, and the decision rule can be
stated as “Reject H0 if the calculated t is either Ͻ Ϫ2.110 or Ͼ ϩ2.110, otherwise do not reject.”
Compare the Calculated and Critical Values and Reach a Conclusion
for the Null Hypothesis
The calculated test statistic, t ϭ 2.340, exceeds the upper boundary and falls into
this rejection region. H0 is rejected.
Make the Related Business Decision
The results suggest that the mean charge account balance is some value other than
$410. The auditor should proceed to examine all charge account balances.
One-Tail Testing of a Mean, Unknown
example
One-Tail Test
The Chekzar Rubber Company, in financial difficulties because of a poor reputation for product quality, has come out with an ad campaign claiming that the
mean lifetime for Chekzar tires is at least 60,000 miles in highway driving. Skeptical, the editors of a consumer magazine purchase 36 of the tires and test
them in highway use. The mean tire life in the sample is x ϭ 58,341.69 miles,
with a sample standard deviation of s ϭ 3632.53 miles. The sample data are in
file CX10CHEK.
Chapter 10: Hypothesis Tests Involving a Sample Mean or Proportion
331
SOLUTION
Formulate the Null and Alternative Hypotheses
Because of the directional nature of the ad claim and the editors’ skepticism regarding its truthfulness, the null and alternative hypotheses are
H0:
H1:
Ն 60,000 miles
Ͻ 60,000 miles
The mean tire life is at least 60,000 miles.
The mean tire life is under 60,000 miles.
Select the Significance Level
For this test, the significance level will be specified as 0.01.
Select the Test Statistic and Calculate Its Value
The test statistic is t ϭ (x Ϫ 0)͞s x , and the t distribution will be used to describe
the sampling distribution of the mean for samples of n ϭ 36. The center of the
distribution is the lowest possible value for which H0 could be true, or
0 ϭ 60,000 miles. Since the population standard deviation is unknown, s is used
to estimate . The sampling distribution has an estimated standard error of
sx ϭ
s
͙n
ϭ
3632.53 miles
͙36
ϭ 605.42 miles
and the calculated value of t will be
tϭ
x Ϫ 0
58,341.69 Ϫ 60,000.00
ϭ
ϭ Ϫ2.739
sx
605.42
Identify the Critical Value for the Test Statistic and State the Decision Rule
For this test, ␣ has been specified as 0.01. The number of degrees of freedom is
df ϭ (n Ϫ 1), or (36 Ϫ 1) ϭ 35. The t distribution table is now used in finding
the value of t that corresponds to a one-tail area of 0.01 and df ϭ 35 degrees
of freedom. Referring to the 0.01 column and 35th row of the table, this critical
value is found to be t ϭ Ϫ2.438. (Although the value listed is positive, remember that the distribution is symmetrical, and we are looking for the left-tail
boundary.) The rejection and nonrejection regions are shown in Figure 10.7, and
FIGURE 10.7
H0: m ≥ 60,000 miles
H1: m < 60,000 miles
Reject H0
Do not reject H0
Area = 0.01
m0 = 60,000 miles
t = –2.438
Test statistic:
t = –2.739
The Chekzar Rubber
Company has claimed that,
in highway use, the mean
lifetime of its tires is at least
60,000 miles. At the 0.01
level in this left-tail test, the
claim is not supported.
332
Part 4: Hypothesis Testing
the decision rule can be stated as “Reject H0 if the calculated t is less than
Ϫ2.438, otherwise do not reject.”
Compare the Calculated and Critical Values and Reach a Conclusion
for the Null Hypothesis
The calculated test statistic, t ϭ Ϫ2.739, is less than the critical value, t ϭ Ϫ2.438,
and falls into the rejection region of the test. The null hypothesis, H0: Ն 60,000
miles, must be rejected.
Make the Related Business Decision
The test results support the editors’ doubts regarding Chekzar’s ad claim. The
magazine may wish to exert either readership or legal pressure on Chekzar to
modify its claim.
N
O
T
E
Compared to the t-test, the z-test is a little easier to apply if the analysis is carried
out by pocket calculator and references to a statistical table. (There are lesser
“gaps” between areas listed in the normal distribution table compared to values
provided in the t table.) Also, courtesy of the central limit theorem, results can be
fairly satisfactory when n is large and s is a close estimate of .
Nevertheless, the t-test remains the appropriate procedure whenever is
unknown and is being estimated by s. In addition, this is the method you will
either use or come into contact with when dealing with computer statistical packages handling the kinds of analyses in this section. For example, with Excel,
Minitab, SYSTAT, SPSS, SAS, and others, we can routinely (and correctly) apply
the t-test whenever s has been used to estimate .
An important note when using statistical tables to determine p-values: For
t-tests, the p-value can’t be determined as exactly as with the z-test, because the
t table areas include greater “gaps” (e.g., the 0.005, 0.01, 0.025 columns, and so
on). However, we can narrow down the t-test p-value to a range, such as
“between 0.01 and 0.025.”
For example, in the Chekzar Rubber Company t-test of Figure 10.7, the calculated t statistic was t ϭ Ϫ2.739. We were able to reject the null hypothesis at
the 0.01 level (critical value, t ϭ Ϫ2.438), and would also have been able to reject
H0 at the 0.005 level (critical value, t ϭ Ϫ2.724). Based on the t table, the most
accurate conclusion we can reach is that the p-value for the Chekzar test is less
than 0.005. Had we used the computer in performing this test, we would have
found the actual p-value to be 0.0048.
Computer Solutions 10.2 shows how we can use Excel or Minitab to carry out
a hypothesis test for the mean when the population standard deviation is unknown.
In this case, we are replicating the hypothesis test shown in Figure 10.6, using the
18 data values in file CX10CRED. The printouts in Computer Solutions 10.2 show
the p-value (0.032) for the test. This p-value represents the following statement:
“If the population mean really is $410, there is only a 0.032 probability of getting
a sample mean this far away from $410 just by chance.” Because the p-value is less
than the level of significance we are using to reach a conclusion (i.e., p-value ϭ
0.032 is Ͻ ␣ ϭ 0.05), H0: ϭ $410 is rejected.
In the Minitab portion of Computer Solutions 10.2, the 95% confidence interval is shown as $420.0 to $602.7. The hypothesized population mean ($410) does
not fall within the 95% confidence interval; thus, at this confidence level, the
results suggest that the population mean is some value other than $410. This same
conclusion was reached in our two-tail test at the 0.05 level of significance.
Chapter 10: Hypothesis Tests Involving a Sample Mean or Proportion
333
computer solutions 10.2
Hypothesis Test for Population Mean, Unknown
These procedures show how to carry out a hypothesis test for the population mean when the population
standard deviation is unknown.
EXCEL
1
2
3
4
5
6
7
8
9
10
11
12
A
t-Test: Mean
B
C
D
balance
511.33
183.750
410
17
2.3396
0.0159
1.7396
0.0318
2.1098
Mean
Standard Deviation
Hypothesized Mean
df
t Stat
P(T<=t) one-tail
t Critical one-tail
P(T<=t) two-tail
t Critical two-tail
Excel hypothesis test for based on raw data and unknown
1. For example, for the credit balances (file CX10CRED.XLS) on which Figure 10.6 is based, with the label and 18 data
values in A1:A19: Click Tools. Click Data Analysis Plus. Click t-Test: Mean. Click OK.
2. Enter A1:A19 into the Input Range box. Enter the hypothesized mean (410) into the Hypothesized Mean box. Click
Labels. Enter the level of significance for the test (0.05) into the Alpha box. Click OK. The printout shows the p-value
for this two-tail test, 0.0318.
Excel hypothesis test for based on summary statistics and unknown
1. For example, with x ϭ 511.33, s ϭ 183.75, and n ϭ 18, as in Figure 10.6: Open the TEST STATISTICS.XLS workbook,
supplied with the text.
2. Using the arrows at the bottom left, select the t-Test_Mean worksheet. Enter the sample mean (511.33), the sample
standard deviation (183.75), the sample size (18), the hypothesized population mean (410), and the level of significance for the test (0.05).
(Note: As an alternative, you can use Excel worksheet template TMTTEST.XLS, supplied with the text. The steps are
described within the template.)
MINITAB
Minitab hypothesis test for based on raw data and unknown
One-Sample T: balance
Test of mu = 410 vs not = 410
Variable
balance
N
18
Mean
511.3
StDev
183.8
SE Mean
43.3
95% CI
(420.0, 602.7)
T
2.34
P
0.032
1. For example, using the data (file CX10CRED.MTW) on which Figure 10.6 is based, with the 18 data values in column C1:
Click Stat. Select Basic Statistics. Click 1-Sample t.
2. Select Samples in Columns and enter C1 into the box. Select Perform hypothesis test and enter the hypothesized
population mean (410) into the Hypothesized mean: box.
(continued)