FooddrinkQ12015 BMI
Bạn đang xem bản rút gọn của tài liệu. Xem và tải ngay bản đầy đủ của tài liệu tại đây (688.58 KB, 140 trang )
Q1 2015
www.businessmonitor.com
VIETNAM
FOOD & DRINK REPORT
INCLUDES 5-YEAR FORECASTS TO 2018
ISSN 1749-3072
Published by:Business Monitor International
Vietnam Food & Drink Report Q1
2015
INCLUDES 5-YEAR FORECASTS TO 2018
Part of BMI’s Industry Report & Forecasts Series
Published by: Business Monitor International
Copy deadline: December 2014
Business Monitor International
Senator House
85 Queen Victoria Street
London
EC4V 4AB
United Kingdom
Tel: +44 (0) 20 7248 0468
Fax: +44 (0) 20 7248 0467
Email:
Web:
© 2014 Business Monitor International
All rights reserved.
All information contained in this publication is
copyrighted in the name of Business Monitor
International, and as such no part of this
publication may be reproduced, repackaged,
redistributed, resold in whole or in any part, or used
in any form or by any means graphic, electronic or
mechanical, including photocopying, recording,
taping, or by information storage or retrieval, or by
any other means, without the express written consent
of the publisher.
DISCLAIMER
All information contained in this publication has been researched and compiled from sources believed to be accurate and reliable at the time of
publishing. However, in view of the natural scope for human and/or mechanical error, either at source or during production, Business Monitor
International accepts no liability whatsoever for any loss or damage resulting from errors, inaccuracies or omissions affecting any part of the
publication. All information is provided without warranty, and Business Monitor International makes no representation of warranty of any kind as
to the accuracy or completeness of any information hereto contained.
Vietnam Food & Drink Report Q1 2015
CONTENTS
BMI Industry View ............................................................................................................... 7
SWOT .................................................................................................................................... 9
Food ....................................................................................................................................................... 9
Drink .................................................................................................................................................... 11
Mass Grocery Retail ................................................................................................................................ 13
Industry Forecast .............................................................................................................. 15
Consumer Outlook ................................................................................................................................... 15
Food ..................................................................................................................................................... 16
Food Consumption ................................................................................................................................ 16
Table: Food Consumption Indicators - Historical Data & Forecasts (Vietnam 2011-2018) . . . . . . . . . . . . . . . . . . . . . . . . . . . . . . . . . . . . . . . . . . . . . . . . . . . . . . . . . . 18
Canned Food ........................................................................................................................................ 18
Confectionery ........................................................................................................................................ 19
Table: Confectionery Value/Volume Sales, Production & Trade - Historical Data & Forecasts (Vietnam 2011-2018) . . . . . . . . . . . . . . . . . . . . . . . . . . . . . . 21
Pasta ................................................................................................................................................... 23
Table: Pasta Volume Sales, Production & Trade - Historical Data & Forecasts (Vietnam 2013-2018) . . . . . . . . . . . . . . . . . . . . . . . . . . . . . . . . . . . . . . . . . . . . . . 23
Dairy ................................................................................................................................................... 23
Table: Dairy Volume Sales, Production & Trade - Historical Data & Forecasts (Vietnam 2013-2018) . . . . . . . . . . . . . . . . . . . . . . . . . . . . . . . . . . . . . . . . . . . . . . 24
Drink .................................................................................................................................................... 25
Alcoholic Drinks .................................................................................................................................... 25
Table: Alcoholic Drinks Value/Volume Sales, Production & Trade - Historical Data & Forecasts (Vietnam 2013-2018) . . . . . . . . . . . . . . . . . . . . . . . . . . . 27
Hot Drinks ............................................................................................................................................ 29
Table: Hot Drink Value/Volume Sales, Production & Trade - Historical Data & Forecasts (Vietnam 2013-2018) . . . . . . . . . . . . . . . . . . . . . . . . . . . . . . . . . . 30
Soft Drinks ............................................................................................................................................ 31
Table: Soft Drinks Sales, Production & Trade (Vietnam 2013-2018) . . . . . . . . . . . . . . . . . . . . . . . . . . . . . . . . . . . . . . . . . . . . . . . . . . . . . . . . . . . . . . . . . . . . . . . . . . . . . . . . . . 32
Mass Grocery Retail ................................................................................................................................ 34
Table: Mass Grocery Retail Sales By Format - Historical Data & Forecasts (Vietnam 2013-2018) . . . . . . . . . . . . . . . . . . . . . . . . . . . . . . . . . . . . . . . . . . . . . . . . . . 37
Table: Grocery Retail Sales By Format (%) . . . . . . . . . . . . . . . . . . . . . . . . . . . . . . . . . . . . . . . . . . . . . . . . . . . . . . . . . . . . . . . . . . . . . . . . . . . . . . . . . . . . . . . . . . . . . . . . . . . . . . . . . . . 37
Trade .................................................................................................................................................... 38
Table: Trade Balance - Historical Data & Forecasts (Vietnam 2013-2018) . . . . . . . . . . . . . . . . . . . . . . . . . . . . . . . . . . . . . . . . . . . . . . . . . . . . . . . . . . . . . . . . . . . . . . . . . . 39
Macroeconomic Forecast ................................................................................................ 40
Expecting Sustained Growth Momentum In 2015 ........................................................................................... 40
Table: Economic Activity (Vietnam 2009-2018) . . . . . . . . . . . . . . . . . . . . . . . . . . . . . . . . . . . . . . . . . . . . . . . . . . . . . . . . . . . . . . . . . . . . . . . . . . . . . . . . . . . . . . . . . . . . . . . . . . . . . . . . 44
Industry Risk Reward Index ............................................................................................. 45
Asia Pacific - Risk/Reward Index ................................................................................................................ 45
Table: Asia Pacific Food & Drink Risk/Reward Index Q115 . . . . . . . . . . . . . . . . . . . . . . . . . . . . . . . . . . . . . . . . . . . . . . . . . . . . . . . . . . . . . . . . . . . . . . . . . . . . . . . . . . . . . . . . . . 46
Table: Asia Pacific Food & Drink Risk/Reward Sub-Factor Index Q115 - Selected Countries (scores out of 10) . . . . . . . . . . . . . . . . . . . . . . . . . . . . . . . . . . . 50
Vietnam Risk/Reward Index ....................................................................................................................... 51
Market Overview ............................................................................................................... 53
© Business Monitor International
Page 4
Vietnam Food & Drink Report Q1 2015
Food .....................................................................................................................................................
Agriculture ...........................................................................................................................................
Food Processing ....................................................................................................................................
Food Consumption .................................................................................................................................
Drink ....................................................................................................................................................
Hot Drinks ..........................................................................................................................................
Soft Drinks ............................................................................................................................................
Alcoholic Drinks ....................................................................................................................................
53
53
54
54
56
56
56
57
Mass Grocery Retail ................................................................................................................................ 60
Table: Structure Of Mass Grocery Retail Market By Estimated Number of Outlets (Vietnam 2005-2014) . . . . . . . . . . . . . . . . . . . . . . . . . . . . . . . . . . . . . . . . . . . 61
Table: Mass Grocery Retail Sales By Format (Vietnam 2005-2014) . . . . . . . . . . . . . . . . . . . . . . . . . . . . . . . . . . . . . . . . . . . . . . . . . . . . . . . . . . . . . . . . . . . . . . . . . . . . . . . . . . 62
Industry Trends And Developments ................................................................................ 63
Food .....................................................................................................................................................
Key Industry Trends And Developments ......................................................................................................
Drink ....................................................................................................................................................
Key Industry Trends And Developments ......................................................................................................
Mass Grocery Retail ................................................................................................................................
Key Industry Trends And Developments ......................................................................................................
63
63
68
68
77
77
Competitive Landscape .................................................................................................... 81
Table: Key Players In Vietnam's Food Sector . . . . . . . . . . . . . . . . . . . . . . . . . . . . . . . . . . . . . . . . . . . . . . . . . . . . . . . . . . . . . . . . . . . . . . . . . . . . . . . . . . . . . . . . . . . . . . . . . . . . . . . . . . 81
Table: Key Players In Vietnam's Drink Sector . . . . . . . . . . . . . . . . . . . . . . . . . . . . . . . . . . . . . . . . . . . . . . . . . . . . . . . . . . . . . . . . . . . . . . . . . . . . . . . . . . . . . . . . . . . . . . . . . . . . . . . . . 81
Table: Key Players In Vietnam's Mass Grocery Retail Sector . . . . . . . . . . . . . . . . . . . . . . . . . . . . . . . . . . . . . . . . . . . . . . . . . . . . . . . . . . . . . . . . . . . . . . . . . . . . . . . . . . . . . . . . . 82
Company Profile ................................................................................................................ 84
Vinamilk ................................................................................................................................................ 84
Table: Vinamilk - Financial Highlights, 2008-2013 . . . . . . . . . . . . . . . . . . . . . . . . . . . . . . . . . . . . . . . . . . . . . . . . . . . . . . . . . . . . . . . . . . . . . . . . . . . . . . . . . . . . . . . . . . . . . . . . . . . . 94
Unilever Vietnam ..................................................................................................................................... 96
Nestlé Vietnam ........................................................................................................................................ 99
Masan Consumer ................................................................................................................................... 101
San Miguel Pure Foods Vietnam Co Ltd .................................................................................................... 104
Hanoi Beer Alcohol Beverage Corp (Habeco) ............................................................................................. 106
Saigon Beer Alcohol And Beverage Corporation (Sabeco) ............................................................................. 109
Carlsberg ............................................................................................................................................. 111
Saigon Co-op ........................................................................................................................................ 113
Global Industry Overview ................................................................................................ 116
Table: Dollar General And Family Dollar Historic Quarterly Same-Store Sales Growth (% Change Y-O-Y) . . . . . . . . . . . . . . . . . . . . . . . . . . . . . . . . . . . . . . . 120
Table: Selected US And Global Spirits Companies - Historical Financial Indicators . . . . . . . . . . . . . . . . . . . . . . . . . . . . . . . . . . . . . . . . . . . . . . . . . . . . . . . . . . . . . . . . 123
Table: Select US Beverage Companies - Historic Eva Spread . . . . . . . . . . . . . . . . . . . . . . . . . . . . . . . . . . . . . . . . . . . . . . . . . . . . . . . . . . . . . . . . . . . . . . . . . . . . . . . . . . . . . . . . 125
Table: Food and Drink Team's Core Views . . . . . . . . . . . . . . . . . . . . . . . . . . . . . . . . . . . . . . . . . . . . . . . . . . . . . . . . . . . . . . . . . . . . . . . . . . . . . . . . . . . . . . . . . . . . . . . . . . . . . . . . . . . 126
Demographic Forecast ................................................................................................... 128
Table: Population Headline Indicators (Vietnam 1990-2025) . . . . . . . . . . . . . . . . . . . . . . . . . . . . . . . . . . . . . . . . . . . . . . . . . . . . . . . . . . . . . . . . . . . . . . . . . . . . . . . . . . . . . . . . 129
Table: Key Population Ratios (Vietnam 1990-2025) . . . . . . . . . . . . . . . . . . . . . . . . . . . . . . . . . . . . . . . . . . . . . . . . . . . . . . . . . . . . . . . . . . . . . . . . . . . . . . . . . . . . . . . . . . . . . . . . . . 129
Table: Urban/Rural Population & Life Expectancy (Vietnam 1990-2025) . . . . . . . . . . . . . . . . . . . . . . . . . . . . . . . . . . . . . . . . . . . . . . . . . . . . . . . . . . . . . . . . . . . . . . . . . . . 130
© Business Monitor International
Page 5
Vietnam Food & Drink Report Q1 2015
Table: Population By Age Group (Vietnam 1990-2025) . . . . . . . . . . . . . . . . . . . . . . . . . . . . . . . . . . . . . . . . . . . . . . . . . . . . . . . . . . . . . . . . . . . . . . . . . . . . . . . . . . . . . . . . . . . . . . 130
Table: Population By Age Group % (Vietnam 1990-2025) . . . . . . . . . . . . . . . . . . . . . . . . . . . . . . . . . . . . . . . . . . . . . . . . . . . . . . . . . . . . . . . . . . . . . . . . . . . . . . . . . . . . . . . . . . . 131
Glossary ........................................................................................................................... 133
Food & Drink ...................................................................................................................................... 133
Mass Grocery Retail ............................................................................................................................. 133
Methodology .................................................................................................................... 135
Industry Forecast Methodology .............................................................................................................. 135
Sector-Specific Methodology .................................................................................................................. 136
Sources .............................................................................................................................................. 136
Risk/Reward Index Methodology ............................................................................................................. 137
Table: Food & Drink Risk/Reward Index Indicators . . . . . . . . . . . . . . . . . . . . . . . . . . . . . . . . . . . . . . . . . . . . . . . . . . . . . . . . . . . . . . . . . . . . . . . . . . . . . . . . . . . . . . . . . . . . . . . . . . 138
Table: Weighting . . . . . . . . . . . . . . . . . . . . . . . . . . . . . . . . . . . . . . . . . . . . . . . . . . . . . . . . . . . . . . . . . . . . . . . . . . . . . . . . . . . . . . . . . . . . . . . . . . . . . . . . . . . . . . . . . . . . . . . . . . . . . . . . . . . . . . . 139
© Business Monitor International
Page 6
Vietnam Food & Drink Report Q1 2015
BMI Industry View
BMI View: We hold a positive outlook for the Vietnamese consumer, as the government targets economic
growth through public spending and promoting investment and exports. We forecast real GDP growth at
5.7% in 2014 and 6.4% in 2015, on the back of supportive government policies, as well as a strong outlook
for foreign investment and exports. However, political risks remain in the form of Chinese tensions, which
we believe will continue for some time.
Headline Industry Data (local currency)
■
2014 total food consumption growth: +19.2%; compound annual growth rate (CAGR) 2013 to 2018:
+19.6%.
■
2014 per capita food consumption growth: +18.1%; CAGR to 2018: +18.6%.
■
2014 alcoholic drinks value sales growth: +12.0%; CAGR to 2018: +11.2%.
■
2014 soft drinks value sales growth: +10.5%; CAGR to 2018: +9.7%.
■
2014 MGR sales growth: +13.3%; compound annual growth rate (CAGR) 2014 to 2018: +12.6%.
Key Industry Trends
Metro Retail Exit Does Not Diminish Positive Vietnam View: In early August 2014, the German cash-andcarry retailer Metro is planning to sell its Vietnam business, potentially pulling in EUR1.75bn. The
decision to leave Vietnam is driven by the need to re-focus on its core Europe business and strengthen its
balance sheet, rather than being based on any major structural issues or re-rating in the growth profile of the
organised food retail sector. Like some of the other major European retailers, namely Carrefour and Tesco,
Metro has had to rein in spending internationally over the past two to three years as retail sales across
Western Europe have remained weak while, more recently, Russia, one of Metro's key markets, has slowed
down in 2014. We still see Vietnam as one of South-East Asia's best retail opportunities.
Vietnam Likely To Benefit From Russia Import Ban: Vietnam will benefit from Russia's ban on agricultural
imports from select countries, including the US and the EU. Russia implemented the ban in August 2014
and it will likely last for one year from announcement. The Russian Economic Development Minister has
urged ASEAN countries to increase food exports to the country, particularly highlighting the need for
seafood, nuts, beef, pork, chicken, fruit and vegetables. We believe that Vietnam's seafood and livestock
sectors will particularly benefit.
© Business Monitor International
Page 7
Vietnam Food & Drink Report Q1 2015
ThaiBev Looks To High Growth Vietnam: Thai Beverage Public Company (ThaiBev), Thailand's largest
beverage producer and distributor, is seeking expansion opportunities in South East Asian countries, due to
limited opportunities in its domestic market. ThaiBev has recently shown interest in purchasing a stake in
Vietnam's leading beer company, Sabeco, which controls 45-50% of Vietnam's beer market. The
Vietnamese government currently owns 89% of Sabeco, but is expected to sell more than 50% of the
company to investors. We believe this will be an opportunity for ThaiBev to boost its exposure to a highgrowth market as Thailand slows down.
© Business Monitor International
Page 8
Vietnam Food & Drink Report Q1 2015
SWOT
Food
SWOT Analysis
Strengths
■
The food processing sector accounts for a sizeable proportion of industrial output and
GDP, with the sector attracting significant foreign investment in recent years from
global industry majors such as Unilever, Nestlé and San Miguel.
■
Vietnamese consumers, particularly the young and affluent, are fairly brand aware by
regional standards. Accordingly, renowned Western products, backed by investment
in marketing and promotions, tend to have highly successful launches.
■
The wealthy urban centres of Hanoi and Ho Chi Minh City now provide highly
receptive consumer audiences.
■
Large and diverse domestic agricultural output aids the stability of ingredient supplies
and prices for local producers - a vital strength during this period of global volatility.
■
Strong economic and private consumption growth will help fuel food consumption
growth.
Weaknesses
■
There are wide income disparities between urban and rural areas, and local
consumption patterns vary significantly according to income.
■
The food processing industry remains largely fragmented, except for a few key
sectors such as dairy and confectionery.
■
The country's agricultural sector has been criticised for being too slow to adapt to
new technologies to be globally competitive in the long term, although the
government is working hard to address this.
■
Vietnam's infrastructure is still weak. Roads, railways and ports are inadequate to
cope with the country's economic growth and links with the outside world.
■
The lack of white goods among large sections of the consumer base slows down the
development of the high-potential dairy sector.
© Business Monitor International
Page 9
Vietnam Food & Drink Report Q1 2015
SWOT Analysis - Continued
Opportunities
■
The government's focus on investment within the manufacturing and exports industry
will help create a regional food and drink trade hub.Vietnam's upcoming ASEAN
Economic Community membership in 2015 should provide greater access to both
foreign markets and capital, while making Vietnamese enterprises stronger through
increased competition.
■
Rising income levels and changing lifestyles, particularly in urban areas, are
increasing consumer demand for snacks, convenience and luxury food items.
■
Vietnam's large domestic market, growing export opportunities and low labour costs,
as well as the prospect of acquiring newly privatised food companies, offer further
investment opportunities.
■
The country's agricultural sector is in need of significant investment, and willing
investors can expect assisted entry.
Threats
■
A growing tourism sector fuels interest in convenience categories.
■
Vietnam's WTO membership may result in smaller companies who are unable to cope
with the increased competition being forced out of business.
■
If relations with China deteriorate, the Vietnamese economy will suffer and could lose
a significant political ally and trade partner.
© Business Monitor International
Page 10
Vietnam Food & Drink Report Q1 2015
Drink
SWOT Analysis
Strengths
■
Vietnamese consumers, particularly the young and affluent, are fairly brand aware by
regional standards. Accordingly, renowned Western products, backed by investment
in marketing and promotions, tend to have highly successful launches.
■
The wealthy urban centres of Hanoi and Ho Chi Minh City now provide highly
receptive consumer audiences.
■
Alcoholic drinks are widely consumed and have gained popularity in recent years.
■
Competitive pressure is quickly intensifying in the drinks sectors, which is likely to
drive greater sector dynamism and fuel growth.
Weaknesses
■
There are wide income disparities between urban and rural areas, and local
consumption patterns vary significantly according to income.
■
The drinks industry remains largely fragmented, except for a few key sectors, such as
alcohol and soft drinks.
■
Despite the growing presence of multinationals, local firms continue to dominate the
beer market.
■
Vietnam's infrastructure is still weak. Roads, railways and ports are inadequate to
cope with the country's economic growth and links with the outside world.
■
Establishing separate breweries in different regions is costly but remains one of the
best strategies to overcome the lack of infrastructure.
Opportunities
■
The government's focus on investment within the manufacturing and exports industry
will help create a regional food and drink trade hub.
■
Vietnam's upcoming ASEAN Economic Community membership in 2015 should
provide greater access to both foreign markets and capital, while making Vietnamese
enterprises stronger through increased competition.
© Business Monitor International
Page 11
Vietnam Food & Drink Report Q1 2015
SWOT Analysis - Continued
■
Vietnam's large domestic market, growing export opportunities and low labour costs,
as well as the prospect of acquiring newly privatised drink companies, offer further
investment opportunities.
■
A growing tourism sector is fuelling interest in convenience categories, in addition to
sub-sectors such as soft and alcoholic drinks.
■
In line with consumers' rising disposable incomes, there are opportunities for
premium-branded products in the soft and alcoholic drinks sub-sectors.
■
The global trend towards health consciousness provides an opportunity for drinks
manufacturers to diversify into perceived healthier options.
Threats
■
Vietnam's WTO membership may result in smaller companies who are unable to cope
with the increased competition being forced out of business.
■
If relations with China deteriorate, the Vietnamese economy will suffer and could lose
a significant political ally and trade partner.
© Business Monitor International
Page 12
Vietnam Food & Drink Report Q1 2015
Mass Grocery Retail
SWOT Analysis
Strengths
■
The potential size of the mass grocery retail market makes it an attractive target for
foreign retailers once improved market terms are granted. Further growth is expected,
especially in the supermarket format.
■
Hypermarkets, supermarkets and convenience stores have all proved popular in
Vietnam, catering for different types of consumers and different shopping occasions.
■
A growing multinational presence in the retail sector has aided the acceptance of
modern retail best practices in Vietnam, particularly things such as added-value instore services.
■
Vietnamese economic growth averaged 7.1% annually between 2000 and 2012,
fuelling a steady middle-class emergence and growing consumerism. The economic
boom has lifted many Vietnamese out of poverty, generating a greater demand for the
higher-value modern retail concepts.
■
The formation of buying groups has proved an effective means of facilitating quicker
expansion among smaller industry players.
Weaknesses
■
Vietnam's retail distribution networks remain underdeveloped, and expansionoriented firms must invest in infrastructural development as well as new store
openings.
■
Regulations governing international participation in modern retail in Vietnam have
resulted in slow rates of expansion, and aspects of government policy continue to
make life challenging for foreign firms in spite of WTO accession.
■
Poverty levels among the country's vast rural population hugely inhibit the potential
audience size for modern retail in Vietnam.
■
Vietnam's infrastructure is still weak. Roads, railways and ports are inadequate to
cope with the country's economic growth and links with the outside world.
© Business Monitor International
Page 13
Vietnam Food & Drink Report Q1 2015
SWOT Analysis - Continued
Opportunities
■
The hypermarket concept is still in its infancy and, as familiarity with modern retailing
grows, this format will represent an immense growth opportunity.
■
Modern retail is currently focused on the major urban centres of the north and south,
which still boast space for new entrants. Central Vietnam and the provinces provide
further opportunities still.
■
Modern retail concepts, such as discounting and private labelling, are likely to prove
popular with price-conscious Vietnamese consumers as familiarity with modern
retailing builds.
■
Rapid urbanisation and the development of new housing complexes provide ideal
locations for modern retail outlets.
■
The government's focus on investment within the manufacturing and exports industry
will result in lower production costs for such items, which have the potential to boost
the profits of MGR firms.
Threats
■
Rising operating costs will threaten retailer profit margins; price increases have to
date been passed on to shoppers, but this cannot continue indefinitely in the priceconscious market.
■
The potential exit of Metro from Vietnam highlights the more inward looking global
MGR sector, which could limit investment in emerging markets for the foreseeable
future.
■
If relations with China deteriorate, the Vietnamese economy will suffer and could lose
a significant political ally and trade partner.
© Business Monitor International
Page 14
Vietnam Food & Drink Report Q1 2015
Industry Forecast
Consumer Outlook
We hold a positive outlook for the Vietnamese consumer, as the government targets economic growth
through public spending and promoting investment and exports. However, political risks remain in the form
of Chinese tensions, which we believe will continue for some time.
In line with our positive outlook for the Vietnamese economy, we forecast real GDP growth at 5.7% in
2014 and 6.4% in 2015, on the back of supportive government policies, as well as a strong outlook for
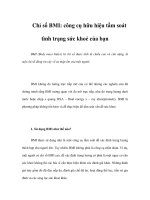
foreign investment and exports. Following weaker-than-expected H114 growth numbers, Vietnam's real
GDP growth accelerated to 6.2% in Q314, marking the fastest pace of expansion since Q411. Over the first
eleven months of 2014, the manufacturing sector expanded by 7.5% year-on-year (y-o-y). The Purchasing
Managers' Index (PMI) came at 52.1 in November, representing the 15th consecutive month of expansion.
The services sector was also a strong driver of growth. Over January-November, total retail sales of goods
and services expanded by 11.1% y-o-y.
Sustained Expansion On The Cards
Vietnam - Purchasing Managers' Index (PMI)
Source: Bloomberg, BMI
© Business Monitor International
Page 15
Vietnam Food & Drink Report Q1 2015
We believe that the food and drink industry in Vietnam will benefit from the government's drive to increase
the manufacturing sector for regional and international trade. Vietnam is quickly becoming a regional trade
powerhouse, especially in the food and drink sector. Vietnam's export sector continues to be a driver of
growth for the country, and we forecast this trend to remain in play over the coming months. Exports in the
first eleven months of the year expanded by a robust 13.7% y-o-y. We expect exports to continue driving
growth going forward given that the Vietnamese government has been making a concerted push to build
diplomatic and trade ties with many countries and is negotiating several free trade agreements. One of the
most important ones is the Trans-Pacific Partnership (TPP), which could be signed by as early as 2015.
On the consumer side, we note that a proposed increase in the tax base on food and drink products could be
implemented in July 2015. This will decrease sales of certain food and drink items, predominantly products
such as carbonated drinks and confectionery. If and when this tax increase is confirmed, we will be
adjusting our forecasts accordingly.
In the long term, rapid economic growth in Vietnam over the coming years is likely to translate into higher
income, in turn benefiting consumerism. We forecast strong private consumption growth over the next few
years, at 6.5% in 2014 and 2015. Most exciting is the country's favourable demographic profile: 49.6% of
the population is estimated to be younger than 30. This implies potentially dynamic opportunities for
consumer goods players targeting the mass-market segment in particular. Rapid urbanisation provides
additional opportunities for modern retail outlets.
What Vietnam offers investors is arguably one of the most attractive consumer bases in South East Asia
after India. With a youthful population of 90mn, and GDP growth forecast at 5.7% in 2014, the country
provides attractive demographic potential for retailers keen to capture the vast consumer base. A flurry of
international investment interest in the country over recent years has given continued focus on the merits of
the unravelling consumer story in Vietnam, particularly in its mass grocery retail sector. Overall, we believe
that Vietnam remains one the most exciting mass grocery retail Asian growth stories. With the potential to
outperform regionally in the coming years, the country continues to gradually prove its growing reputation
as Asia's 'little India'.
Food
Food Consumption
■
2014 total food consumption (local currency) growth: +19.2%; compound annual growth rate (CAGR)
2013 to 2018: +19.6%.
■
2014 per capita food consumption (local currency) growth: +18.1%; CAGR to 2018: +18.6%.
© Business Monitor International
Page 16
Vietnam Food & Drink Report Q1 2015
Vietnam will remain one of the most attractive
investment opportunities in the region over our
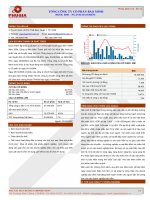
Food Consumption
forecast period to 2018 and beyond. Domestic
(2009-2018)
consumer expenditure will continue to grow, and the
country is a major regional hub for exports. The food
25
1,500,000
sector represents a large and growing portion of the
country's manufacturing output.
20
1,000,000
15
We expect per capita food consumption to grow at a
500,000
10
fast pace, by 18.1% in 2014 and by a compound
and rapid expansion of country's mass grocery retail
2018f
2017f
2016f
2015f
2014f
2013e
2012
2011
5
2010
attractive demographic profile, rapid urbanisation
0
2009
annual rate of 18.6% from 2013 through to 2018. An
Food consumption VNDbn (LHS)
Food consumption, VND, % y-o-y (RHS)
sector will fuel this growth over the longer term.
Currently, income levels in Vietnam are a long way
e/f = BMI estimate/forecast. Source: National sources, BMI
behind those enjoyed in developed economies, and
consumer purchases remain largely centred on food staples and daily necessities. However, as incomes
continue to accelerate off a low base on the back of sturdy economic growth, consumer tastes and
preferences are expected to calibrate towards the higher-value food and beverage segments, which will be
very likely to guarantee a receptive and growing audience for branded food and beverage products in the
medium term.
The massive potential provided by the burgeoning middle class in Vietnam is already attracting the sights of
major consumer-facing players in the country. The ongoing expansion of the mass grocery retail industry
will drive up per capita food consumption levels, provided goods sold through such outlets remain
competitively priced. Ultimately, food consumption growth will be driven by the government's ability to
harness rural spending power and by modern retailers' ability to find a model that stirs consumer interest,
without forgetting that price will remain the major purchasing determinant.
As a regional manufacturing and trade hub, we also highlight Vietnam's strong food processing sector as an
ongoing investment driver. Food products account for 21% of all of Vietnam's manufacturing output, which
in itself makes up about 17-18% of GDP. The manufacturing sector will expand robustly in the country on
the back of an improved macroeconomic and investment climate, a growing domestic market, and an
abundant working age population with competitive wages relative to regional peers.
© Business Monitor International
Page 17
Vietnam Food & Drink Report Q1 2015
Table: Food Consumption Indicators - Historical Data & Forecasts (Vietnam 2011-2018)
Food
consumption
VNDbn
2011
2012
2013e
2014f
2015f
2016f
2017f
2018f
396,467.8
441,791.9
504,206.3
601,208.9
725,087.1
870,250.1
1,037,539.8
1,232,851.5
11.2
11.4
14.1
19.2
20.6
20.0
19.2
18.8
Food
consumption,
VND, % y-o-y
Food
consumption, 4,409,413.7 4,865,776.6 5,499,648.7 6,496,188.0 7,764,357.1 9,239,203.9 10,925,877.9 12,882,921.0
VND per
capita
Food
consumption,
USDbn
19.2
21.2
24.1
29.2
35.7
43.0
51.9
62.3
Food
consumption,
USD per
capita
213.5
233.1
263.1
315.9
381.9
457.0
546.3
650.7
e/f = BMI estimate/forecast. Source: National sources, BMI
Canned Food
■
2014 canned food value sales (local currency) growth: +10.7%; CAGR to 2018: +9.6%.
Canned food sales are forecast to experience strong growth in Vietnam, in line with increasing urbanisation
and growing affluence among consumers. Between 2014 and 2018 we forecast volume growth of 23.3%,
and value growth of 42.8%. Indeed, demand for higher-value products such as canned foods is expected to
pick up on the back of rising disposable incomes.
Vietnamese consumers are experiencing a growing awareness of hygiene concerns and food origin as their
living standards improve and as numerous health scares lead to increased caution. This will further
encourage consumers to purchase processed foods over fresh produce, and strong investment in this sector
from both domestic and international operators will be very likely to help to fuel sales growth. Meanwhile,
city workers are increasingly cutting back on restaurant meals and opting for canned and processed foods in
order to save money, with major retailers such as Saigon Co-op reporting a recent spike in sales.
© Business Monitor International
Page 18
Vietnam Food & Drink Report Q1 2015
Confectionery
■
2014 confectionery value (local currency) sales
growth: +10.7%; CAGR to 2018: +10.1%.
■
2014 chocolate value (local currency) sales
growth: +11.9%; CAGR to 2018: +12.4%.
■
2014 sugar confectionery (local currency) sales
growth: +9.6%; CAGR to 2018: +8.7%.
Confectionery
(2009-2018)
300,000
6
200,000
4
100,000
2
0
0
The longer-term outlook for the Vietnamese
confectionery market is positive. Factors such as
especially with regard to chocolate.
■
Rising Disposable Incomes: Rapid wealth
accrual is likely to translate into a greater
discretionary appetite for premium confectionery
products. As an increasing number of domestic
confectioners expand their upmarket product
ranges, this is likely to bolster value sales growth
over the coming years.
2018f
2017f
2016f
2015f
2014f
2013e
2012
2011
in the sector will support confectionery demand,
2010
growing health awareness and continued investments
2009
rising purchasing power, favourable demographics,
Confectionery sales, tonnes (LHS)
Confectionery sales, tonnes, % y-o-y (RHS)
e/f = BMI estimate/forecast. Source: National sources, BMI
■
A Massive Youthful Population: Almost half of the Vietnamese population is estimated to be younger
than 30, and the maturation of this demographic group means that there are dynamic opportunities in the
mass market. Moreover, this demographic group is generally more receptive to Western tastes and
innovative products, which will give an impetus to confectionery demand.
■
Growing Health Awareness: Health awareness is prompting shifts of consumption habits towards
functional and healthy confectionery products. Capitalising on the growing trend, domestic confectioners
such as Tan Tan Food & Foodstuff and Vina Mit are expanding their functional product offerings.
These products typically carry higher price tags, and their rising demand is likely to translate into higher
value sales in the sector.
■
Continued Sector Investments: Sustained competition levels in the Vietnamese confectionery sector
ensure that dynamism in the market is unlikely to cool off any time soon. Nabati Indonesia, a leading
Indonesian biscuit producer, recently announced plans to start distributing its biscuit products in Vietnam
- a testament to the attractiveness of the sector. In November 2014, Mondelez International, a global
leader in snacks and confectionery, announced that it would buy an 80% stake in domestic confectioner
Kinh Do.
However, while we highlight the positive consumption picture, we caution that growth- especially in the
burgeoning chocolate sector- could be restricted by supply issues.
© Business Monitor International
Page 19
Vietnam Food & Drink Report Q1 2015
Interest in Asia's cocoa and chocolate sectors is rising, with many local and international players entering
the cocoa grindings and chocolate making business in the region. While there is no traditional culture of
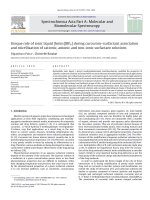
eating chocolate in the region, the Vietnamese are one of the largest chocolate eaters per capita amongst
Emerging Asian countries, with consumption per capita at 0.5kg a year, while Indian, Indonesian and Thai
consumers eat 0.1kg a year.
Room To Catch Up With Developed Asia
Select Countries - Chocolate Sales, Kg/capita
Note: f = BMI forecast. Source: National statistics, UN Industrial Commodity Statistics, UN Comtrade, BMI
Attracted by these enticing consumption trends, cocoa grinders are investing heavily across Asia, especially
in Malaysia and Indonesia.
Other Asian countries where chocolate demand is growing have also recorded investments in their grinding
capacity. Countries like Vietnam and Thailand mainly import cocoa powder due to their lack of processing
plants. This corresponds well to the taste of consumers in emerging countries, who usually prefer milder
chocolate products based on cocoa powder (cakes, biscuits and drinks) rather than cocoa butter-based
products which tend to be stronger (melt-in-your-mouth products such as chocolate bars and ice cream).
© Business Monitor International
Page 20
Vietnam Food & Drink Report Q1 2015
In spite of strong demand fundamentals for the cocoa and chocolate sectors in Asia, headwinds are growing
in the processing industry. First, the ongoing wave of investment in cocoa processing plants has led to
overcapacity in Malaysia and Indonesia. We believe the fast development of capacity will have a lingering
impact on cocoa grinders' profitability in the coming years, with margins in the industry remaining in the
doldrums. The second challenge facing the sector is the dwindling supply of cocoa beans coming Indonesia,
which has traditionally been Asia's main supplier. Cocoa production in Indonesia has been declining since
2012/13, as the government's ambitious plan to double output has been a failure so far. Seeds supplied by
the Indonesian Coffee and Cocoa Research Institute are producing defective cocoa trees that yield poorquality pods and small, discoloured beans. The scarcity of locally grown bean is being exacerbated by the
fast development of the grinding sector. Indonesia's cocoa production surplus is steadily narrowing and is
expected to come in at a low 119,600 tonnes in 2013/14, compared with the five-year average of 274,000
tonnes.
Not only have beans exports fallen recently, hampering the processing sector in Asia, but Indonesia is now
forced to import higher-quality beans from Africa. In addition, grinders in Indonesia are lobbying to lower
the import tax on cocoa beans in order to increase domestic supply. This would put further pressure on
Indonesian cocoa bean farmers, as they would have to face stiffer competition from African beans, which
are cheaper and of better quality. Many Indonesian cocoa farmers could be pushed out of business, limiting
production further in the future.
We believe the growing scarcity of Indonesian beans, on which many Asian grinders were counting to
supply their plants, will put the development of the chocolate making sector in Asia in jeopardy. The
stagnation in beans output will leave the world dependent on a single source of cocoa, West Africa, known
for its unstable production. This is likely to lead to volatile and slim margins in times of elevated cocoa
prices. Decreasing supply from Indonesia should limit the global production surpluses in the coming years,
leaving cocoa prices at high levels compared with historical averages.
Table: Confectionery Value/Volume Sales, Production & Trade - Historical Data & Forecasts (Vietnam 2011-2018)
2011
Confectionery
sales, VNDmn
2012
2013e
2014f
2015f
2016f
2017f
2018f
20,109,915 22,411,421 24,641,933 27,266,416 30,150,945 33,014,227 36,491,850
39,884,680
Confectionery
sales, VND per
capita
223,657.3
246,833.3
268,782.8
294,619.3
322,861.5
350,502.9
384,279.7
416,782.7
Confectionery
sales, USDmn
973.5
1,073.7
1,179.0
1,325.9
1,483.1
1,633.2
1,824.6
2,014.4
© Business Monitor International
Page 21
Vietnam Food & Drink Report Q1 2015
Confectionery Value/Volume Sales, Production & Trade - Historical Data & Forecasts (Vietnam 2011-2018) - Continued
Confectionery
sales, tonnes
2011
2012
2013e
2014f
2015f
2016f
2017f
2018f
164,815.7
167,979.8
173,192.3
181,310.5
190,617.3
199,339.8
210,529.0
220,143.8
Chocolate
sales, VNDmn 3,340,752.6 3,703,892.4 4,054,380.0 4,536,173.9 5,083,520.6 5,700,780.5 6,461,089.7 7,272,341.3
Chocolate
sales, USDmn
161.73
177.45
193.99
220.58
250.05
282.01
323.05
367.29
Chocolate
sales, tonnes
46,763.9
47,448.7
48,722.9
51,541.4
54,879.3
58,612.4
63,326.5
67,948.2
Chocolate
sales, kg per
capita
0.5
0.5
0.5
0.6
0.6
0.6
0.7
0.7
Sugar
confectionery
sales, tonnes
111,922.8
114,300.6
118,200.2
122,518.2
127,125.4
131,231.4
135,966.7
139,727.9
Sugar
confectionery
sales, kg per
capita
1.2
1.3
1.3
1.3
1.4
1.4
1.4
1.5
Sugar
confectionery
exports,
tonnes
26,956.6
29,615.0
30,789.8
31,952.1
33,223.4
35,614.6
36,566.9
39,188.7
Sugar
confectionery
imports,
tonnes
13,963.2
15,089.2
16,156.1
17,249.1
18,424.0
19,997.0
21,065.9
22,709.8
Sugar
confectionery
balance,
tonnes
12,993.4
14,525.8
14,633.7
14,703.0
14,799.3
15,617.6
15,501.0
16,479.0
6,129.1
6,230.6
6,269.2
7,250.9
8,612.6
9,496.0
11,235.8
12,467.6
0.1
0.1
0.1
0.1
0.1
0.1
0.1
0.1
Gum sales,
tonnes
Gum sales, kg
per capita
Gum sales,
VNDmn
1,060,011.8 1,177,461.1 1,262,944.8 1,544,923.6 1,931,391.6 2,235,979.3 2,775,288.0 3,230,437.6
Gum sales,
VND per
capita
11,789.2
12,968.2
13,775.6
16,693.2
20,681.7
23,738.8
29,225.3
33,757.1
Gum sales,
USDmn
51.32
56.41
60.43
75.12
95.00
110.61
138.76
163.15
e/f = BMI estimate/forecast. Source: National sources, BMI
© Business Monitor International
Page 22
Vietnam Food & Drink Report Q1 2015
Pasta
The Vietnamese pasta market is underdeveloped, although the product has become more recognisable in
view of Westernisation of lifestyles, particularly in urban areas. Around half of the retail market is
dominated by Barilla, with other prominent importers including Italpasta and Pasta Zara.
However, the market for instant noodles is well established, with the market supplied by a mixture of
locally made (by companies such as Masan Consumer and Acecook Vietnam JSC) and imported products.
Goods are receiving strong marketing and advertising support, especially as the more challenging economic
times have prioritised non-discretionary spending. Instant noodles are expected to remain very popular, on
account of their affordability, versatility as a cooking ingredient, wide-ranging availability and convenience.
Table: Pasta Volume Sales, Production & Trade - Historical Data & Forecasts (Vietnam 2013-2018)
2013e
2014f
2015f
2016f
2017f
2018f
Uncooked pasta production, tonnes
31,220.7
34,739.1
38,752.4
38,752.4
42,809.0
42,809.0
Uncooked pasta sales, tonnes
25,865.5
30,164.2
34,975.2
35,784.6
40,666.0
41,502.5
0.3
0.3
0.4
0.4
0.4
0.4
Uncooked pasta exports, tonnes
7,241.5
6,695.1
6,148.8
5,602.4
5,056.0
4,509.7
Uncooked pasta imports, tonnes
1,886.3
2,120.2
2,371.6
2,634.7
2,913.1
3,203.2
Uncooked pasta balance, tonnes
5,355.2
4,574.9
3,777.2
2,967.7
2,143.0
1,306.4
685,994.5
739,263.2
800,022.8
866,912.8
935,331.2
1,008,534.9
2,800.8
2,979.5
3,171.6
3,372.5
3,585.2
3,806.9
Uncooked pasta sales, kg per capita
Prepared pasta production, tonnes
Prepared pasta imports, tonnes
e/f = BMI estimate/forecast. Source: National sources, BMI
Dairy
The Vietnamese dairy sector has experienced very strong growth in recent years. Key drivers of this growth
have been increasing urbanisation and rising incomes, supported by a shift in consumer eating habits. Huge
multinational companies have, in particular, managed to sway consumer preferences with their considerable
advertising and promotional power. At the same time, the government is pouring investment in to the dairy
industry, with a view to producing 3.4bn litres of fresh milk by 2025, which would generate export revenues
of some USD200mn.
© Business Monitor International
Page 23
Vietnam Food & Drink Report Q1 2015
Table: Dairy Volume Sales, Production & Trade - Historical Data & Forecasts (Vietnam 2013-2018)
2013e
2014f
2015f
2016f
2017f
2018f
Processed liquid milk production, tonnes
425,910.8
468,472.0
517,018.3
570,462.8
625,128.4
683,617.4
Processed liquid milk sales, tonnes
210,765.4
226,680.8
243,630.6
261,404.5
280,020.4
299,495.0
13,900.6
15,084.5
16,345.3
17,667.3
19,052.1
20,500.7
5,203.0
5,661.8
6,150.4
6,662.8
7,199.5
7,760.9
30,075.6
33,028.8
36,397.3
40,105.7
43,898.8
47,957.2
Butter sales, tonnes
Cheese sales, tonnes
Ice cream production, tonnes
e/f = BMI estimate/forecast. Source: National sources, BMI
The local demand for dairy products is met by a combination of locally produced goods, which accounts for
20% of consumption, according to the US Department of Agriculture, and imports from countries including
New Zealand, the US and Australia. Vietnam Dairy Products Co (Vinamilk) is one of the key players in
the sector. Indeed, reflecting the promise of the Vietnamese dairy sector, Vinamilk aims to become one of
the largest 50 dairy firms in the world. The company is also expanding internationally, as Vietnam is in a
geographically strong place to take advantage of the growing Asian dairy story. Other prominent dairy
producers include Dutch Lady, Hanoimilk and Anco.
© Business Monitor International
Page 24
Vietnam Food & Drink Report Q1 2015
Drink
Alcoholic Drinks
■
2014 alcoholic drinks volume sales growth:
+5.9%; compound annual growth rate (CAGR)
2013 to 2018: +5.7%.
■
2014 alcoholic drinks value (local currency) sales
growth: +12.0%; CAGR to 2018: +11.2%.
■
2014 beer value (local currency) sales growth:
+12.0%; CAGR to 2018: +11.2%.
Alcoholic Drinks
(2011-2018)
400,000,000
30
25
300,000,000
■
2014 spirits value (local currency) sales growth:
+11.0%; CAGR to 2018: +11.1%.
20
200,000,000
15
100,000,000
10
In line with positive economic prospects and a
particular, we believe that the country's beer industry
2018f
2017f
2016f
2015f
2014f
2013e
2012
strong outlook for Vietnam's drinks industry. In
5
0
2011
developing MGR network, we maintain a very
Alcoholic drink sales, VNDmn (LHS)
Alcoholic drink sales, VND, % y-o-y (RHS)
will post good growth, as large amounts of foreign
investment have entered the market in recent years.
A young and growing population and rising tourist
e/f = BMI estimate/forecast. Source: National sources, BMI
arrivals will ensure the prevalence of beer in the
alcoholic drinks market. We forecast the beer sector to grow by a compound annual rate of 11.2% in local
currency terms between 2013 and 2018.
Generally speaking, favourable demographic shifts, rising affluence, strong economic growth and a fastgrowing tourist industry imply massive scope for alcoholic drinks consumption, with beer, in particular, set
to benefit. We expect premiumisation to pick up momentum in the Vietnamese alcoholic drinks sector, and
for value sales growth to outpace that of volume sales over our forecast period to 2018. The emergence of a
thriving tourist industry in Vietnam is also likely to bolster alcoholic drinks consumption given that tourists
typically have a greater penchant for higher-value consumer products.
Beer will continue to dominate the alcoholic drinks sector, accounting for the vast majority of volume sales,
and will thus also remain the main contributor to value sales. This is due to the strong interest the beer
sector has been attracting from both local and international brewers, with volume sales expected to
experience real growth of 32.1% to 2018. We also expect foreign brewers to take on a more prominent role
in driving beer sales growth in Vietnam as they seek to enter emerging markets. As foreign brewers
© Business Monitor International
Page 25