Wiley guidebook to r graphics using microsoft windows
Bạn đang xem bản rút gọn của tài liệu. Xem và tải ngay bản đầy đủ của tài liệu tại đây (5 MB, 272 trang )
Guidebook to R Graphics
Using Microsoft® Windows
Guidebook to R Graphics
Using Microsoft® Windows
Kunio Takezawa
National Agricultural Research Center,
National Agriculture and Food Research Organization
Graduate School of Life and Environmental Sciences
University ofTsukuba Ibaraki
Tsukuba, Japan
WILEY
A JOHN WILEY & SONS, INC., PUBLICATION
Copyright © 2012 by John Wiley & Sons, Inc. All rights reserved.
Published by John Wiley & Sons, Inc., Hoboken, New Jersey.
Published simultaneously in Canada.
No part of this publication may be reproduced, stored in a retrieval system or transmitted in any form or
by any means, electronic, mechanical, photocopying, recording, scanning or otherwise, except as
permitted under Section 107 or 108 of the 1976 United States Copyright Act, without either the prior
written permission of the Publisher, or authorization through payment of the appropriate per-copy fee to
the Copyright Clearance Center, Inc., 222 Rosewood Drive, Danvers, MA 01923, (978) 750-8400, fax
(978) 750-4470, or on the web at www.copyright.com. Requests to the Publisher for permission should
be addressed to the Permissions Department, John Wiley & Sons, Inc., I l l River Street, Hoboken, NJ
07030, (201) 748-6011, fax (201) 748-6008, or online at />Limit of Liability/Disclaimer of Warranty: While the publisher and author have used their best efforts in
preparing this book, they make no representation or warranties with respect to the accuracy or
completeness of the contents of this book and specifically disclaim any implied warranties of
merchantability or fitness for a particular purpose. No warranty may be created or extended by sales
representatives or written sales materials. The advice and strategies contained herein may not be
suitable for your situation. You should consult with a professional where appropriate. Neither the
publisher nor author shall be liable for any loss of profit or any other commercial damages, including
but not limited to special, incidental, consequential, or other damages.
For general information on our other products and services please contact our Customer Care
Department within the United States at (800) 762-2974, outside the United States at (317) 572-3993 or
fax (317) 572-4002.
Wiley also publishes its books in a variety of electronic formats. Some content that appears in print,
however, may not be available in electronic formats. For more information about Wiley products, visit
our web site at www.wiley.com.
Library of Congress Cataloging-in-Publication Data:
Takezawa, Kunio, 1959—
Guidebook to R graphics using Microsoft Windows / Kunio Takezawa.
p. cm.
Includes index.
ISBN 978-1-118-02639-7 (pbk.)
1. Computer graphics. 2. R (Computer program language) 3. Microsoft Windows (Computer file)
I. Title.
T385.T346 2012
006.6'633—dc23
2011049806
Printed in the United States of America.
10
9 8 7 6 5 4 3 2 1
CONTENTS
Preface
Acknowledgments
1
Basic Graphics
1.1
1.2
1.3
1.4
1.5
1.6
1.7
1.8
1.9
1.10
1.11
1.12
1.13
Introduction
Downloading and installation of R
Start-up of R, and construction and execution of R
programs
Coordinate axes
Points and straight lines
Reuse of graphs produced by R
Text
Various points and straight lines
Fonts
Figures such as circles and rectangles
Legends and logarithmic plots
Bar charts
Pie charts
ix
xiii
1
1
1
3
11
14
16
24
27
34
35
41
42
45
V
Vi
CONTENTS
1.14
1.15
Layout of multiple graphs
Summary
Exercises
46
60
62
Graphics for Statistical Analysis
65
2.1
2.2
2.3
2.4
2.5
2.6
2.7
2.8
2.9
2.10
2.11
2.12
2.13
2.14
2.15
2.16
2.17
2.18
Introduction
Stem-and-leaf displays
Histograms and probability density functions
Strip chart
Boxplots
Multiple-axis layouts
Display of confidence intervals
Scatter plot matrices
Radar charts and parallel charts
Functions of one variable
Functions of two variables
Map graphs
Histograms of two variables
Time series graphs of two variables
Implicit functions
Probability density functions
Differential values and values of integrals
Summary
Exercises
Interactive R Programs
3.1
3.2
3.3
3.4
3.5
3.6
3.7
3.8
3.9
3.10
Introduction
Positioning by mouse on a graphics window
Inputting values on the console window to draw a graph
Reading data from a data file
Moving data on a natural spline
Understanding simple regression
Adjusting three-dimensional graphs
Constructing polynomial regression equations interactively
Understanding local linear regression
Summary
Exercises
65
66
67
73
75
80
91
93
95
97
100
108
113
116
119
121
124
132
133
139
139
140
143
156
158
166
175
180
183
188
190
CONTENTS
Graphics Obtai ned Using Packages Based on R
4.1
4.2
4.3
4.4
4.5
4.6
4.7
4.8
4.9
4.10
4.11
4.12
4.13
4.14
Introduction
Package "rimage"
Package "gplots"
Package "ggplot2"
Package "scatterplot3d"
Package "rgl"
Package "misc3d"
Package "aplpack"
Package "vegan"
Package "tripack"
Package "ade4"
Package "vioplot"
Package "plotrix"
Package "rworldmap"
Exercises
VÜ
193
193
194
195
200
203
207
221
232
234
236
238
241
243
247
249
Appendix
253
A.l
A.2
A.3
253
254
254
Index
Digital files
Free software
Data
257
PREFACE
Carol Marcus: Let me show you something that will make you feel
young as when the world was new. (Star Trek: The Wrath of Khan
(1982) />Construction of appropriate graphs plays an important role in data analysis. Pertinent graphs often reveal the conditional implications of data clearly
even if the summarization of data by deriving a small number of values can
show limited aspects of the characteristics of data. In addition, persuasive
graphs are an indispensable tool for the presentation of scientific papers,
the description of commodities, patent applications, project proposals, lectures, training courses, business meetings, negotiations, legal actions, etc.
The graphical presentation of features of data and structures of concepts can
strengthen arguments.
Therefore, it is well known that producing high-quality graphs is a requisite
in diverse fields. Demand for richly expressive graphs has grown. Moreover,
people's need for better graphs at a lower cost has increased markedly because the extraordinary development of computer technology has enabled the
drawing of complicated graphs in a short period of time. Therefore, drawing
graphs using a PC is no longer a specialist skill that requires professional
expertise. It should be a fairly commonplace technique, comparable to the
creation of simple documents using a word processor.
ix
X
PREFACE
The free software "R" is now widely used for statistical calculation and
graphics. R is equipped with various functions for constructing graphs. Moreover, installing software packages enables a wider range of graphs to be produced. The importance of R as a tool for graphics has increased. However,
those unfamiliar with the use of R for statistical calculations tend to avoid the
software because its wide range of functions may make it appear daunting.
In light of this situation, this book aims to demonstrate that producing
graphs using R is an easy-to-master technique. Hence, this book often does
not describe R commands and their range of arguments exhaustively, but
rather exemplifies typical methods for constructing graphs and their results.
This makes the book a guide that aims to foster a feeling of confidence that
most graphs can be produced using R. As is generally the case with learning
word processing software, learners should obtain an overall picture of the
graphical abilities of R in a short time by gaining familiarity with its main
features rather than by acquiring details of each function; then they can realize
a greater diversity of graphics by referring to references and articles on the
Internet. This way of learning is effective provided learners are not aspiring
to careers as specialists in the software.
To achieve the aims of this book, procedures for excuting R are presented
as R programs that contain a series of R commands. That is, this book, unlike
other books in this field, does not proceed with procedures by inputting R
commands sequentially. Batch processing is focused on rather than sequential
processing (real-time processing). Sequential processing has the advantage of
being able to construct graphics while seeing the graphs in progress. However,
batch processing is clearly superior to sequential processing because inappropriate manipulation and keystroke errors often occur during the work. In
batch processing, R programs (a series of R commands) are recorded regularly, making it easy to rerun a procedure after modifying the program. In
addition, learners can review R programs that they have learned, and use or
develop them after accumulating techniques in the form of R programs.
Fortunately, if learners transform their R programs into text files, the programs can be easily found when needed by full-text searching. For example,
we assume that a folder called D: \GraphicsR contains .RData (a work image
file; this file stores R programs and data). When R programs are accumulated in .RData, it will be useful for learners to search for R programs that
they need among the programs in .RData. For this purpose, learners should
activate .RData and run the R program below, for instance.
functionO
{
obi <- objects(pos=l)
nd <- length(obi)
for(ii in l:nd) {
p r i n t (paste ("DrWGraphicsRW", o b l [ i i ] , " . t x t " , sep = ,,M ))
dump(obl[ii], paste("D:\\GraphicsR\\", o b l [ i i ] , " . t x t " ,
PREFACE
}
XI
sep = ■·"))
}
This procedure transforms all objects (R programs and data files) in .RData
into text files and outputs these text files in D: \GraphicsR. Extensions of these
text files will be . t x t . If a full-text search of these text files is carried out
with R commands as key words, the R programs that use these R commands
will be found. Additionally, if comments such as "draw a circle" or "change
a font" are written in R programs, a full-text search with the key words of
"circle" or "font" will find R programs that contain the above functions.
Moreover, this book explains the method of producing GUI (interactive)
programs. Although many people need to construct graphs or carry out statistical calculations, some would rather not go to the trouble of inputting R
commands sequentially based on a process of trial and error while considering
the function of each R command, and they would have little ability to cope
with R programs consisting of several tens of lines. To allow such people
to benefit from the useful functions of R, interactive R programs should be
prepared to create an environment in which R can be used free from the consciousness of its presence. This is a goal of this sort of program. In addition,
if interactive R programs are used in lectures on statistical analysis or as exercise materials for students taking such a course, the contents of statistical
analysis can be conceived as a smooth flow of concepts and statistical analysis
will attract a high level of interest. The author hopes that a great number of
readers will appreciate this intention to construct R programs along this line
to increase the familiarity with R.
For these purposes, the R programs listed in this book are elementary ones
that allows readers to understand each function of R. New R programs can
be developed by adapting these R programs according to readers' needs and
interests. By transforming them into text files by the method described above,
these text files will guide readers in producing graphs using R. This book
provides a platform for readers' originality and ingenuity in this manner; it is
not an introductory book that must be read in page order. Such constructive
usage of this book is expected to expand the possibilities for creating graphics
using R programs, regardless of whether this book is read alone, used as a
reference, or used as a textbook in a course on statistical analysis.
The FTP site for this book can be found at the following URL:
/>The R programs listed in this book assume that the size of the graphics
window on the display of your PC is roughly 16 cm (roughly 6.3 inch) x 16
cm (please refer to the figure below). If a larger graphics window than this
is needed, or the graphics window cannot be as large as this because of the
limited size of your display, the R programs should be modified.
XÜ
PREFACE
Figure 0.1
Graphics window
Warning: When the R programs listed in this book are executed or modified
by trainees in a lecture or a workshop, the copyright holder has made it a
condition that all trainees have purchased this book.
KUNIO TAKEZAWA
Tsukuba, Japan
March, 2012
ACKNOWLEDGMENTS
The original edition of this book was published as "Graphics and GUI Operations Using R" ("R niyoru gazouhyougen to GUI sousa"), written in Japanese.
The publisher is CUTT System Development Laboratory Inc. (Hyakunin-cho
4-9-7 8th floor, Shinjuku, Tokyo 169-0073, Japan. President: Mr. Katsutoshi
Ishizuka, Editor: Mr. Tomohiro Takei). CUTT System Development Laboratory Inc. kindly agreed to our request to publish an English edition of this
book. This English edition was not just a faithful translation, but underwent
processes of additions and alterations on the advice of the editors at Wiley.
To all these wonderful people I owe a deep sense of gratitude, especially
now that this project has been completed.
K.T.
xiii
CHAPTER 1
BASIC GRAPHICS
1.1
INTRODUCTION
This chapter first describes the procedures to start up R, produce R programs,
and run them. This is followed by explanations of R programs used to construct simple graphs. New techniques are introduced by adding new methods
to already-known materials. Hence, learning is followed by consulting, testing, and modifying the listed R programs sequentially. Alternatively, learners
can find graphs that roughly suit their purpose and experiment with them.
Previous articles may be referred to if unknown commands or functions are
used in the programs. In addition, the last part of this chapter introduces
techniques to share displayed graphs with other application software packages
and to save graphs as digital files.
1.2
DOWNLOADING AND INSTALLATION OF R
The procedure below installs R on a PC loaded with a Windows OS.
Guidebook to R Graphics Using Microsoft Windows,
First Edition. By Kunio Takezawa
Copyright © 2012 John Wiley & Sons, Inc.
1
2
BASIC GRAPHICS
1. Access "the R Project for Statistical Computing" web page
(http://www.r-proj e c t . o r g / ) .
2. Click "CRAN" under "Download, Packages" listed in the menu on the
left side.
3. Choose one of the mirror sites on the "CRAN Mirrors" page. Most of the
mirror sites are identical. For example, choose University of Tsukuba
(.j p/).
4. Click "Windows" under "Download and Install R" on "The Comprehensive R Archive Network" web page.
5. Click "base" on the same line as "base Binaries for base distribution
(managed by Duncan Murdoch)" on the "R for Windows" page.
6. Click "Download R 2.11.0 for Windows (32 megabytes)" (the version
may be different) on the "R-2.11.0 for Windows" page.
7. R-2.11.0-win32.exe (or a different version) is now available for installation. Construct a folder in the hard disk in your PC and download the
file to the folder.
8. Double-click R-2.11.0-win32.exe to start the installation process of R.
9. Agree to the "GNU General public license" and specify the location of
installation.
10. Select "Full installation" on the "Select components" page.
11. After a few further selections, installation starts.
Sets of programs called "packages" have been prepared for R. Packages can
be added to the version of R installed on your PC. If a PC is connected to
the Internet, select "Packages" in a menu after R is booted. Then, choose
"Set CRAN mirror...". Many mirror sites appear. Then, choose "Japan
(Tsukuba)", for example, and click "OK". Return to "Packages" in the menu.
Then, select "Load package" to display the names of many packages. Choose
the names of packages that you need and click "OK". The selected packages
are installed in this way.
If packages are installed in this manner, the names of packages displayed
are those that fit the version of R installed on a PC. However, some packages
that fit an older version of R can be used in a newer version of R. For example,
the "gtools" package that will be dealt with later fits version 2.10 of R but
does not fit version 2.11 of R. Hence, when the "gtools" package is used, it is
safe to employ version 2.10 of R. However, the use of the "gtools" package with
version 2.11 of R can be attempted. For this purpose, the method described
above cannot be used. A method for a PC that is not connected to the
START-UP OF R, AND CONSTRUCTION AND EXECUTION OF R PROGRAMS
3
Internet is useful for installing packages for older versions of R. This method
is as follows:
1. In the fifth step of the installation procedure of R described above, click
"contrib" on the same line of "contrib Binaries of contributed packages
(managed by Uwe Ligges)".
2. The "Index of /bin/windows/contrib" page appears. Select a version of
R that fits the packages that you will use (for example, 2.10).
3. The names of the files of packages compressed in zip format are displayed. Click the names of the files of packages needed for downloading
them.
4. R is booted. Select "Packages" in the menu.
package(s) from local zip files...".
Then, select "Install
5. Select the files that were downloaded beforehand to install packages.
Using this method, even if R version 2.11 is installed on a PC, packages for
R version 2.10 may be used.
1.3
START-UP OF R, AND CONSTRUCTION AND EXECUTION OF
R PROGRAMS
We assume that the folder used for storing data files and the results of calculations is D:\GraphicsR. Save all files created with R in this folder.
Figure 1.1
Work image file.
The file for storing R programs is called the "work image file" (Fig. 1.1).
Confirm the presence of this file in D:\GraphicsR. If the work image file is
not located in D:\GraphicsR, search for a file named ".RData" (which will
be somewhere in your hard disk if R has been installed correctly) and copy
the file by saving it in D:\GraphicsR. If the drive where .RData is originally
located is the "D" drive, hold the Ctrl key and copy the file. If the Ctrl key
is not held, the file is not copied but moved. That is, the original .RData is
deleted. When multiple .RData files are placed in the same PC, each .RData
4
BASIC GRAPHICS
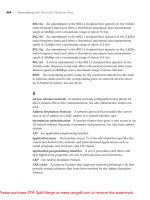
Figure 1.2
Window immediately after "R" is booted.
file stores its own R programs. Even if the version of R is upgraded, the same
.RData file can be used.
R is booted by double-clicking .RData in D:\GraphicsR. R can also be
booted by double-clicking the shortcut button assigned to .RData on the
desktop or other places. Upon booting R, the window shown in Fig. 1.2
appears.
Figure 1.3
Construction of R program.
The inner window in Fig. 1.2 is called the console window. In this window,
R commands and R programs are executed. For example, when an R program
named r p r o l O is produced, type f i x ( r p r o l ) and click the return key in the
console window (Fig. 1.3). Then, the display in Fig. 1.4 appears. The new
START-UP OF R, AND CONSTRUCTION AND EXECUTION OF R PROGRAMS
5
window is an editor. When R is installed in the standard manner, "notepad"
is used as an editor. However, users can set up another editor for this purpose.
An R program is a series of R commands listed between "function () {" and
" } " . Arguments can be specified in " ( ) " of "function () {". For example,
function (aa) { is an R program that uses aa as an argument. By setting
numerical values or text as aa, an R program with this argument is run.
Figure 1.4
Figure 1.5
Editor.
R program.
Let us produce an R program for multiplying 5 and 3 and displaying the
result in the console window. Fig. 1.5 shows an example of an R program for
this purpose. The editor is closed to execute this R program. For this, "x"
(Fig. 1.6) located of the upper right of the editor is clicked. Then, a dialogue
box asking for a selection is displayed (Fig. 1.7). "Yes" or the return key is
clicked. Only the console window is then displayed (Fig. 1.8). r p r o l O is
6
BASIC GRAPHICS
Figure 1.6
Symbol clicked to close.
typed to execute the R program rprolO (Fig. 1.9). Then, the return key
is clicked to execute rprolO and the result "15" appears (Fig. 1.10). This
series of procedures summarizes the basic use of R: the start-up of "R", the
construction of R programs, and the execution of R programs.
Figure 1.7
Figure 1.8
Dialogue box asking for selection.
Return to the console window.
When graphics windows are displayed in the console window (Fig. 1.11),
the execution of g r a p h i c s . of f O in the console window (Fig. 1.12) clears
all graphics windows, and the console window remains (Fig. 1.13). If R is
shut down and rebooted, only the console window appears. Even if only the
START-UP OF R, AND CONSTRUCTION AND EXECUTION OF R PROGRAMS
Figure 1.9
Figure 1.10
Execution of an R program.
Result of executing an R program.
7
8
BASIC GRAPHICS
Figure 1.11
Graphics windows are displayed in addition to the console window.
Figure 1.12
g r a p h i c s . o f f () is executed in the console window.
START-UP OF R, AND CONSTRUCTION AND EXECUTION OF R PROGRAMS
Figure 1.13
9
The operation shown in Fig. 1.12 clears all graphics windows.
console window is displayed, the configurations of previous graphs may affect
new graphs. The shutdown and rebooting of R solves this problem.
R uses Notepad as the standard editor by default. Other editors, however,
can be used. For example, "Programmer's Notepad" (tepad.
org/) is available as an editor: "Programmer's Notepad" has various useful
functions. For instance, the setting of "View" - "Change Scheme" - "C /
C + + " (Fig. 1.14) gives the edit screen such as Fig. 1.15. The structure of
the parentheses is shown clearly.
The following R program (f i x p O ) is useful for employing "Programmer's
Notepad" as an editor:
Program ( 1 - 1 )
function (x, . . . )
{
subx <- s u b s t i t u t e ( x )
if (is.name(subx))
subx <- deparse(subx)
if ( ! i s . c h a r a c t e r ( s u b x ) I I length(subx) != 1)
s t o p ( M ' f i x ' r e q u i r e s a name")
parent <- parent.frame()
if ( e x i s t s ( s u b x , envir = p a r e n t , i n h e r i t s = TRUE))
x <- e d i t ( g e t ( s u b x , envir = p a r e n t ) , t i t l e = "temp",
editor="C:\\Program FilesWProgrammer's NotepadWpn.exe",
else {
x <- e d i t ( f u n c t i o n ( ) {
}, t i t l e = subx, . . . )
environment(x) <- .GlobalEnv
...)
10
BASIC GRAPHICS
Figure 1.14
Notepad".
Setting of "View" - "Change Scheme" - "C / C + + " in "Programmer's
Figure 1.15
Edit screen given by setting Fig. 1.14.
COORDINATE AXES
Figure 1.16
}
11
Construction of R program using "Programmer's Notepad".
}
assign(subx, x, envir = .GlobalEnv)
This R program is obtained by modifying f i x ( ) , which is implemented in R
by default. When an R program is edited using f ixpO, f ixpO is carried out
on a console window in the same manner as that of using f i x ( ) (Fig. 1.16).
1.4
COORDINATE AXES
Fig. 1.17 shows the result of Program (1 - 2).
Program ( 1 - 2 )
functionO {
# (1)
par(mai = c ( l , 1, 1, 1 ) , omi = c ( 0 , 0, 0, 0))
# (2)
p l o t ( x = c ( 0 , 1 ) , y = c ( 0 , 1 ) , xlab = " x \ ylab = "y")
}
(1) par() sets the structure of R graphics and outputs the setting. In this
example, a graphics area is set in a graphics window. The meanings of omi =
and mai = are illustrated in Fig. 1.18. omi = sets the size of the outer margin
surrounding the graphics area. The four values from left to right indicate the
sizes of the lower, left, upper, and right margins of the graphics area (the outer
rectangle in Fig. 1.18). mai = sets the size of the figure margin. The four
values from left to right indicate the sizes of the lower, left, upper, and right
margins of the figure area (the inner rectangle in Fig. 1.18). When values or
12
BASIC GRAPHICS
oo
ö
CO
Ö
O
CM
d
o
d
Figure 1.17
Ί
1
1
1
1
Γ
0.0
0.2
0.4
0.6
0.8
1.0
Coordinate axes and two data points given by Program (1 - 2).
Outer margin 3
Figure margin 3
CM
C
σ>
CO
ε
a
1—
O
CM
c
V
CO
CO · ■ —
CO
X
E CO
£ 1
j» A.
LL
\
- « ■
\
c
CO
CO
s \
\
\
v'
^^
b
\
\
CD
\
3
CO
\
L
-«c
σ>
CU
E
V-
CD
D
O
x-axis
Figure margin 1
Outer margin 1
Figure 1.18
Structure of a graphics window.
COORDINATE AXES
13
labels are written on the lower or left side of a line chart or scatter plot, the
first two values of mai = are usually set to be larger than the last two values.
The unit for omi = and mai = is inches. However, when graphs are drawn
on a display, these values indicate relative lengths because the sizes of graphs
can be changed at will.
(2) Fig. 1.17 shows that p l o t Q illustrates a graph with two data points at
(0,0) and (1,1). Furthermore, xlab = "x" adds the label "x " on the x-axis
of the graph and y lab = "y" adds the label "y " on the y-axis of the graph.
q
o
oo
ö
CO
ó
d
CM
d
o
d
o
0.0
0.2
0.4
0.6
0.8
1.0
x
Figure 1.19
Coordinate axes and two data points drawn by Program (1 - 3).
Fig. 1.19 is identical to Fig. 1.17 and is constructed by Program (1 - 3) .
Program ( 1 - 3 )
functionO {
# (1)
par(mai = c ( l , 1, 1, 1 ) , omi = c ( 0 , 0, 0, 0))
# (2)
p l o t ( c ( 0 , 1 ) , c ( 0 , 1 ) , xlab = "x", ylab = "y")
}
In part (2), the first two arguments of plot () (x = c ( 0 , 1 ) , y = c ( 0 , 1 ) , )
are replaced with c ( 0 , 1 ) , c ( 0 , 1 ) , . In R commands, the names of arguments can usually be abbreviated if arguments are given in a preset order.
Program (1 - 4) produces Fig. 1.20 (left).
Program ( 1 - 4 )
functionO {
# (1)
14
BASIC GRAPHICS
o
σ> -
CD
-
00 -
00
-
r» -
r-. -
>»
10 -
to in
*t -
-
CO CM - 0
Ί
-2
|
-1
— i — — i — — i —
2
0
1
*
■
-
CO
-
CM
-
—r
3
Ί
-2
I
-1
I — i —
1
0
I — Γ
3
2
Figure 1.20 Coordinate axes and two data points drawn by Program (1-4) (left).
Coordinate axes and two data points drawn by Program (1-5) (right).
par(mai = c(l, 1, 1, 1), omi = c(0, 0, 0, 0))
# (2)
plot(c(-2, 3), c(2, 9), xlab = M x \ ylab = H y n )
}
The first two arguments of part (2) are replaced with c ( - 2 , 3 ) , c ( 2 , 9).
This alteration changes the positions of the two points to (—2,2) and (3,9).
Program (1 - 5) constructs Fig. 1.20 (right).
Program ( 1 - 5 )
functionO {
# (1)
par(mai = c ( l , 1, 1, 1 ) , omi = c ( 0 , 0, 0, 0))
# (2)
p l o t ( c ( - 2 , 3 ) , c ( 2 , 9 ) , xlab = " x \ ylab = " y \ type = "n")
}
In part (2) in Program (1 - 4), type = "n" is added to the arguments of
p l o t O. This removes the two data points so that only the coordinate axes
remain. This technique draws the coordinate axes only. The ranges of the
coordinate axes are set by the first two arguments.
1.5
POINTS AND STRAIGHT LINES
Program ( 1 - 6 ) produces Fig. 1.21 (left).
Program ( 1 - 6 )