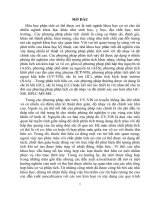
Report khả năng thuyết phục người tiêu dùng thử đổi mới
Bạn đang xem bản rút gọn của tài liệu. Xem và tải ngay bản đầy đủ của tài liệu tại đây (1.9 MB, 19 trang )
CONVINCING ASIAN
CONSUMERS TO TRY
YOUR INNOVATION
FIVE WINNING WAYS TO BEAT THE ODDS
AUGUST 2013
Copyright
©
2013
The
Nielsen
Company.
All
rights
reserved.
Copyright
©
2013
The
Nielsen
Company.
All
rights
reserved.
2
ASIAN CONSUMERS
ARE DISCERNING
They
want
‘proof
of
concept’
before
trying
a
new
product.
In
a
recent
online
survey
62
percent
in
Asia
Pacific
said
they
would
rather
‘wait’
for
an
innovaGon
to
prove
itself
before
purchasing
it,
compared
to
54
percent
in
LaGn
America
-‐
another
emerging
region.
What
makes
Asian
consumers
so
demanding?
We
oPen
see
a
tendency
amongst
Asian
cultures
towards
risk
aversion
and
conservaGsm.
For
the
average
Asian
consumer,
a
brand
relaGonship
is
viewed
as
a
long-‐term
investment.
They
will
therefore
think
deeply
about
a
newly
introduced
brand
or
product
and
spend
Gme
evaluaGng
its
tangible
benefits
(“is
it
good
for
me?”),
making
them
less
prone
to
picking
up
a
new
introducGon
as
soon
as
it
hits
the
shelves.
The
path
to
purchase
for
innovaGon
is
therefore
long
as
the
brand
or
category
needs
to
be
understood
and
evaluated
through
research
and
opinion
gathering
before
it
is
tried.
This
‘wait
and
watch’
senGment
appears
to
hold
for
several
Southeast
Asia
markets,
parGcularly
in
lower
GDP
countries
such
as
the
Philippines,
Indonesia
and
Vietnam.
Given
these
are
our
future
‘growth
engine’
markets,
companies
need
to
ensure
innovaGons
for
these
consumers
are
compelling
enough
to
risk
trial.
What
can
companies
do
to
succeed
in
Asia?
Copyright
©
2013
The
Nielsen
Company.
All
rights
reserved.
Source:
Nielsen
Global
Online
Survey
Q3
2012,
World
Bank,
IMF
3
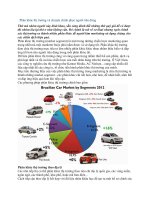
WHO IS WAITING AND
WATCHING IN ASIA
For
new
innovaGons
to
prove
themselves
before
purchasing?
76%
in
VIETNAM
75%
in
INDONESIA
74%
in
PHILIPPINES
67%
in
SOUTH
KOREA
61%
in
SINGAPORE
61%
in
HONG
KONG
61%
in
TAIWAN
60%
in
CHINA
52%
in
JAPAN
HIGH
66%
in
THAILAND
65%
in
MALAYSIA
Per
Capita
Copyright
©
2013
The
Nielsen
Company.
All
rights
reserved.
GDP
LOW
Source:
Nielsen
Online
Survey
Q3
2012
and
World
Bank
4
INNOVATION SUCCESS:
FIVE WINNING WAYS
TO BEAT THE ODDS
Copyright
©
2013
The
Nielsen
Company.
All
rights
reserved.
5
Nielsen
analysed
new
product
introducGons
across
four
categories
in
five
Asian
markets,
benchmarking
findings
with
the
US,
an
acknowledged
innovaGon
leader.
‘InnovaGon’
was
defined
as
any
new
variants
in
the
current
year
not
present
12
months
ago.
This
included
brand
re-‐
launches,
line
extensions,
new
pack
introducGons
or
new
brand
entrants.
Based
on
this
analysis,
Nielsen
idenGfies
five
winning
ways
when
it
comes
to
innovaGng
in
Asia.
Copyright
©
2013
The
Nielsen
Company.
All
rights
reserved.
6
ENSURE INNOVATION
PLANS LINE UP WITH
MARKET OPPORTUNITY
The
prospects
for
growth
in
Asia
are
exciGng
and
constantly
airacGng
new
players
and
launches.
We
found
‘InnovaGon
intensity’*
in
the
region
on
par
or
higher
than
our
benchmark
market
-‐
the
US.
Korea
and
Vietnam
in
parGcular
showed
high
intensity
across
all
four
categories.
2013
INNOVATION
INTENSITY
(Percentage
new
variants
on
total
variants)
35%
30%
25%
20%
15%
10%
5%
0%
US
Korea
Indonesia
Philippines
Thailand
Vietnam
Carbonated
SoP
Drinks
Ice
Cream
Dish
Detergent
Shampoo
*measured
as
the
percentage
share
of
new
variants
to
total
variants
in
a
category
Copyright
©
2013
The
Nielsen
Company.
All
rights
reserved.
Source:
Nielsen
Retail
Audit
2013
7
However,
experience
tells
us
for
every
successful
introducGon,
there
are
plenty
that
don’t
make
it
and
historical
failure
rates
range
from
60
to
90
percent
depending
on
market
and
category.
To
understand
what’s
happening
in
Asia
we
crossed
category
innovaGon
intensity
with
sales
contribuGon
and
grouped
them
in
four
category
types:
• Low
AcFvity-‐High
Impact
categories
(Quandrant
1)
-‐
where
innovaGon
intensity
was
relaGvely
low
but
well
noGced
by
consumers
and
contribuGng
to
sales.
• Dynamic
categories
(Q2)
-‐
where
innovaGon
intensity
was
high
and
consumers
were
again
noGcing
these
and
contribuGng
to
sales.
• Strong
AcFvity-‐Low
Impact
categories
(Q3)
-‐
where
innovaGon
intensity
was
high
but
sales
impact
was
low
either
because
consumers
were
not
noGcing
them
or
they
are
not
seen
as
being
innovaGve
enough
to
encourage
trial.
• Sluggish
categories
(Q4)
-‐
where
innovaGon
intensity
was
low
and
accompanied
by
low
impact
on
sales.
Whilst
in
an
ideal
world,
all
innovaGng
companies
would
be
in
quadrants
one
and
two,
Nielsen
data
on
Asia
shows
otherwise.
NEW
INTRODUCTION
ACTIVATION
2013
LOW
ACTIVITY
–
HIGH
IMPACT
NEW
VARIANT
PERCENTAGE
SHARE
OF
SALES
Q1
DYNAMIC
Q2
•
KR
Shampoo
•
INDO
Shampoo
•
VN
Shampoo
•
INDO
IC
•
TH
Shampoo
•
TH
IC
•
KR
IC
•
TH
Dish
•
US
Dish
•
US
Shampoo
•
KR
Dish
•
TH
CSD
•
PH
Shampoo
•
PH
IC
•
INDO
Dish
•
INDO
CSD
•
US
CSD
•
PH
CSD
•
US
IC
Q4
SLUGGISH
•
KR
CSD
•
VN
Dish
•
VN
CSD
STRONG
ACTIVITY
–
LOW
IMPACT
Q3
NEW
VARIANT
PERCENTAGE
SHARE
OF
COUNT
Copyright
©
2013
The
Nielsen
Company.
All
rights
reserved.
Source:
Nielsen
Retail
Audit
2013
8
• First,
we
see
a
large
number
of
new
variants
not
creaGng
impact
with
the
consumer
-‐
as
reflected
in
the
high
concentraGon
of
categories
in
quadrant
three
(Strong
AcFvity-‐Low
Impact
)
• Shampoo
acGvaGons
are
doing
well
regardless
of
country.
This
is
clearly
a
reflecGon
of
real
category
growth
in
response
to
new/unmet
needs
of
consumers.
• A
consistently
poor
performance
for
carbonated
soP
drinks
(CSD)
reflects
either
lack
of
innovaGon
in
this
category
or
poor
impact
of
new
variants.
The
laier
can
happen
if
companies
constantly
pump
in
incremental
innovaGon
to
retain
market
share
in
a
very
compeGGve
environment,
and
consumers
do
not
noGce
or
are
not
excited
by
the
incremental
offers.
This
highlights
the
real
danger
of
‘wasted
innovaGon’
and
the
need
to
minimise
this
waste
by
ensuring
a
deep
understanding
of
unmet
consumer
needs
and
local
market
dynamics.
The
nature
and
pace
of
innovaGon
has
to
be
in
line
with
real
market
opportunity
and
to
this
end
companies
must
ask
themselves
the
following:
• Is
there
high
innovaGon
acGvity
in
my
category?
• Is
this
in
response
to
real
consumer
demand
or
does
it
reflect
tacGcal
efforts
by
companies
to
retain
market
share?
• If
the
category
is
growing,
what
are
the
white
space
opportuniGes
for
me,
and
will
this
generate
sufficient
sales
revenue?
• If
I
have
to
introduce
incremental
innovaGon
to
retain
market
share,
is
it
disGncGve
enough
and
contribuGng
sufficiently
to
sales
revenue,
or
is
it
cannibalising
my
other
variants?
Copyright
©
2013
The
Nielsen
Company.
All
rights
reserved.
MINIMISE
‘WASTED
INNOVATION’
WHEN
YOU
KNOW
YOUR
CONSUMER
AND
MARKET
WELL.
9
DESIGN CONCEPTS ON
COMPELLING PROPOSITIONS
OTHER THAN LOW PRICE
We
know
from
prior
experience
‘value’
is
a
strong
driver
and
‘affordability’
is
predicted
to
be
an
important
guiding
principal
for
innovaGon
in
Asia.
However
focusing
only
on
absolute
low
price
as
a
way
to
airact
consumers
is
risky
for
a
number
of
reasons.
First,
there
can
only
be
one
cost
leader,
implying
other
players
will
need
to
find
alternate
posiGonings
to
demonstrate
value.
Also,
constant
play
for
lowest
price
through
promoGonal
efforts
can
slowly
erode
brand
image
and
quality
percepGons.
Companies
that
focus
on
proving
value
through
compelling
proposiGons
will
gain
in
the
long
run.
WHAT
CONSTITUTES
A
COMPELLING
PROPOSITION
IN
ASIA?
We
analysed
over
five
hundred
concept
tests
across
US
and
Asian
markets
and
consolidated
consumer
raGngs
on
a
subset
of
Nielsen’s
Factors
for
Success™
namely:
• Value
(acceptable
costs)
• Relevance
(fulfilling
a
consumer
need
or
desire)
•
Advantage
(meeGng
the
consumer
needs
in
a
way
other
products
do
not
or
solving
a
consumer
‘problem’)
• Believability
(giving
consumers
sufficient
reason
to
believe
you
will
deliver
on
your
promises).
We
looked
at
cross-‐correlaGons
of
‘value’
with
the
other
factors
to
understand
the
strength
of
these
relaGonships
and
gauge
what
will
work
in
Asia.
Copyright
©
2013
The
Nielsen
Company.
All
rights
reserved.
10
DRIVERS
OF
PERCEIVED
VALUE
(Airibute
correlaGon
with
“Value”)
The
findings
were
interesGng,
and
gave
us
important
takeaways
to
think
about:
• We
found
Nielsen
Factors
for
Success™
like
‘advantage’,
‘relevance’
and
‘believability’
had
a
stronger
correlaGon
with
‘value’
in
Asia
than
the
US,
implying
‘value
creaGon’
through
strong
proposiGons
has
a
higher
threshold
in
Asia.
This
supports
our
earlier
finding
that
Asian
consumers
are
more
discerning.
• Low
income
markets
like
Indonesia,
Vietnam,
Philippines
showed
stronger
correlaGon
of
‘advantage’
with
’value’.
Companies
should
leverage
this
fact
and
stridently
communicate
and
demonstrate
the
advantage
of
their
innovaGon
over
exisGng
offers.
This
will
resonate
well
with
consumers
in
these
growth
engine
markets.
Copyright
©
2013
The
Nielsen
Company.
All
rights
reserved.
WIN
ASIAN
CONSUMERS
WHEN
YOUR
NEW
PRODUCT
DELIVERS
ON
YOUR
BRAND
PROMISE.
Source:
Nielsen
BASES
MBA
Analysis
11
LEVERAGE BRAND
ATTRIBUTES THAT
CUE ‘ASSURANCE’
Large
global
brands
have
an
opportunity
to
leverage
their
brand
heritage
for
new
launches.
On
average,
just
38
percent
of
Asia
Pacific
consumers
said
they
prefer
local
over
large
global
brands
for
new
product
trial.
Asian
consumers
have
a
healthy
respect
for
‘foreign
brands’,
historically
seen
as
superior
to
local
brands
on
quality,
durability
and
status.
Introducing
line
extensions
under
an
established
parent
brand
or
highlighGng
country
of
origin
on
packaging
or
in
communicaGon
will
give
consumers
confidence
to
try
new
introducGons.
While
true
for
several
markets
in
Southeast
Asia,
mulGnaGonal
companies
should
not
take
this
edge
for
granted.
We
found
some
interesGng
contrasts
in
Philippines
and
Indonesia
where
consumers
showed
stronger
preference
to
try
innovaGon
from
‘local
brands’.
This
could
be
a
sign
that
large
global
brands
need
to
work
harder
to
connect
with
local
consumers
as
they
may
be
viewed
as
too
aspiraGonal
or
not
addressing
local
needs.
More
R&D
efforts
to
understand
local
needs
and
localizaGon
of
markeGng
efforts
to
build
brand
connecGons
will
be
needed
if
foreign
brands
want
to
enter
consumers’
‘circle
of
trust’.
Copyright
©
2013
The
Nielsen
Company.
All
rights
reserved.
12
FOR
NEW
PRODUCTS
I
PREFER
TO
PURCHASE
LOCAL
BRANDS
OVER
LARGE
GLOBAL
BRANDS
(Agree
percentage)
58
53
46
46
41
38
34
33
27
45
30
34
Not
very
far
into
the
future
we
predict
being
‘MNC’
or
‘Local’
will
maier
less
and
less,
and
all
companies
will
need
to
rely
on
other
aiributes
to
build
assurance
and
credibility,
such
as
wide
presence
and
availability,
innovaGve
product
benefits,
superior
technology,
quality
packaging,
online
presence
and
aPer
sales
support.
FOREIGN
BRANDS
NEED
TO
ENTER
LOCAL
CONSUMERS’
‘CIRCLE
OF
TRUST’.
Copyright
©
2013
The
Nielsen
Company.
All
rights
reserved.
Source:
Nielsen
Global
Online
Survey
Q3
2012
13
FAST TRACK ONLINE
INCLUSION IN
MEDIA PLANS
Television,
in-‐store
sampling
and
word
of
mouth
are
important
ways
consumers
have
tradiGonally
come
to
know
about
new
products
in
the
developed
world
and
Asia
is
no
different.
However
the
rise
of
digital
media
is
opening
up
new
and
exciGng
ways
to
influence
Asian
consumers
who
are
ahead
of
the
curve.
KEY
SOURCES
OF
INFLUENCE
FOR
NEW
PRODUCT
PURCHASE
(Likely
to
buy
percentage)
71
Friends/
Family
81
73
73
Saw
in
store
59
AcGve
Internet
searching
71
73
70
Received
a
free
sample
52
Professional/
Expert
told
me
69
43
Job/
Work
AP
63
38
ArGcles
on
frequently
visited
websites
US
63
58
60
TV
Ad
Newspaper/
Magazine
45
Brand/
Manufacturer
web
page
45
0
10
Copyright
©
2013
The
Nielsen
Company.
All
rights
reserved.
20
30
40
50
60
59
60
70
80
90
Source:
Nielsen
Global
Online
Survey
Q3
2012
14
Close
to
two
thirds
(63
percent)
of
online
consumers
in
Asia
Pacific
said
website
arGcles
influence
their
new
product
purchasing
decisions,
compared
to
38
percent
in
the
US.
Again,
nearly
60
percent
report
being
influenced
by
brand
websites
against
45
percent
in
the
US.
Smartphone
penetraGon
in
the
region
was
already
37
percent
in
2012
(based
on
Nielsen’s
2012
Mobile
Insights
Survey),
and
is
expected
to
grow
rapidly,
giving
consumers
access
to
new
product
informaGon
‘any
place’
and
‘anyGme’.
Given
Asia’s
need
for
informaGon
support
in
the
brave
new
world
of
emerging
brands
and
categories,
companies
who
fast
track
online
inclusion
into
their
media
plans
will
have
an
edge.
DON’T
NEGLECT
SOCIAL
CHATTER
AND
DIGITAL
PLATFORMS
WHEN
LAUNCHING
YOUR
NEW
PRODUCT.
Copyright
©
2013
The
Nielsen
Company.
All
rights
reserved.
15
BE BOLD WITH YOUR
DISTRIBUTION
STRATEGY
Past
research
within
Nielsen
has
demonstrated
Gme
and
again
the
need
for
sustained
distribuGon
support
for
at
least
two
years
to
ensure
new
launch
success.
For
new
launches
to
be
tried,
they
must
be
widely
available.
Emerging
markets
sGll
have
a
big
share
of
TradiGonal
trade
and
this
is
likely
to
remain
significant
for
the
next
15
years.
While
new
brand
launches
are
easier
to
support
in
Modern
trade
through
point
of
purchase
displays
and
promoGonal
staff
support,
if
the
new
variant
is
a
brand
re-‐launch
or
a
line
extension,
then
wide
reach
is
more
important
and
companies
should
be
more
aggressive
in
TradiGonal
trade.
CHANNEL
PROFILE
FOR
TOP
20
NEW
VARIANTS
(Value
Share
Percentage)
Indo
Indo
Indo
Indo
PH
CSD
Ice
Dish
SH
CSD
PH
Ice
Copyright
©
2013
The
Nielsen
Company.
All
rights
reserved.
PH
Dish
PH
SH
TH
CSD
TH
Ice
TH
Dish
TH
SH
VN
VN
VN
CSD
Dish
SH
Source:
Nielsen
Retail
Audit
2013
16
Manufacturers
are
realising
this
and
our
data
shows
evidence
of
simultaneous
launches
in
Modern
and
TradiGonal
trade
across
the
region
for
most
categories
(except
Ice
Cream).
In
some
instances
new
variant
contribuGon
to
value
sales
is
stronger
in
TradiGonal
trade
(CSD
in
Philippines,
Thailand
and
Vietnam,
Indonesia
dish
detergents
and
shampoo).
STOCK
YOUR
NEW
PRODUCT
ON
SHELVES
AND
IN
STORES
FOR
AT
LEAST
TWO
YEARS.
Copyright
©
2013
The
Nielsen
Company.
All
rights
reserved.
Source:
Nielsen
Retail
Audit,
2013
17
CONCLUSION
InnovaGon
success
in
Asia
requires
delivery
against
several
criGcal
factors.
Having
the
appropriate
strategic
intent
by
understanding
what
works
in
Asia,
finding
the
right
consumer
insights
to
communicate
strongly,
and
acGvaGng
your
proposiGon
will
ensure
a
strong
and
sustainable
innovaGon
eco-‐system
to
break-‐through
in
this
important
growth
region
and
become
a
market
leader.
ABOUT
OUR
AUTHORS
Toby
Puehse
InnovaGon
PracGce
Leader
Southeast
Asia,
North
Asia,
Pacific
Kana
Hashimoto
Senior
Research
Analyst
Nielsen
BASES
Copyright
©
2013
The
Nielsen
Company.
All
rights
reserved.
Sonia
Kapoor
Director
Thought
Leadership
&
Knowledge
Management
18
ABOUT
NIELSEN
Nielsen
Holdings
N.V.
(NYSE:
NLSN)
is
a
global
informaGon
and
measurement
company
with
leading
market
posiGons
in
markeGng
and
consumer
informaGon,
television
and
other
media
measurement,
online
intelligence
and
mobile
measurement.
Nielsen
has
a
presence
in
approximately
100
countries,
with
headquarters
in
New
York,
USA
and
Diemen,
the
Netherlands.
For
more
informaFon,
visit
nielsen.com.
Copyright
©
2013
The
Nielsen
Company.
All
rights
reserved.