Key factors affecting horeca customers loyalty in domestic goods at ho chi minh
Bạn đang xem bản rút gọn của tài liệu. Xem và tải ngay bản đầy đủ của tài liệu tại đây (1.41 MB, 70 trang )
UNIVERSITY OF ECONOMICS HO CHI MINH CITY
International School of Business
------------------------------
NGUYEN THI THANH TRANG
KEY FACTORS AFFECTING HORECA
CUSTOMERS’ LOYALTY IN
DOMESTIC GOODS
AT HO CHI MINH CITY
MASTER OF BUSINESS (Honours)
Ho Chi Minh City – Year 2014
UNIVERSITY OF ECONOMICS HO CHI MINH CITY
International School of Business
------------------------------
NGUYEN THI THANH TRANG
KEY FACTORS AFFECTING HORECA
CUSTOMERS’ LOYALTY IN
DOMESTIC GOODS
AT HO CHI MINH CITY
ID:
MASTER OF BUSINESS (Honours)
SUPERVISOR: PhD. Nguyen Dong Phong
Ho Chi Minh City – Year 2014
ABSTRACT
With potential Horeca (hotel, restaurant, café) market, recently, companies interested in Vietnam
began looking for opportunities to distribute goods to the resorts, restaurants, hotels. According
to Ms. Le Thi Thanh Lam, Deputy General Director of Saigon Food, Vietnam enterprises are
most highly valued by the market segment very large quantity of goods. To bring Vietnamese
products have high quality standards in the consumer market for this is fussy, many years ago,
Vietnamese enterprises start looking for business opportunities from restaurants, hotels from 3
star to 5 star, creating value chain linkages between business systems and Horeca. This study
aims to investigate which factor affecting to Horeca customers’ loyalty in domestic goods. The
result showed that Vietnamese enterprises need to improve how to have the opportunity to enter
into a fertile market and equally difficult stormed the industry hard
Keywords: key factors, Horeca shoppers’ loyalty, domestic goods
Abbreviations Horeca : Hotel, Restaurant, Cafe
1
TABLE OF CONTENTS
ABSTRACT ........................................................................................................................1
TABLE OF CONTENT.....................................................................................................2
CHAPTER 1: INTRODUCTION .....................................................................................5
1.1. RESEARCH BACKGROUND ..............................................................................5
1.2. RESEARCH PROBLEMS .....................................................................................5
1.3. RESEARCH OBJECTS .........................................................................................7
1.4 RESEARCH SCOPE ..............................................................................................8
1.5. RESEARCH STRUCTURE ...................................................................................8
CHAPTER 2: LITERATURE REVIEW ........................................................................9
2.1. B2B CUSTOMERS' LOYALTY ...........................................................................9
2.2. FACTORS AFFECTING HORECA CUSTOMERS' LOYALTY ..................10
2.2.1. PERCEIVED SERVICE QUALITY AND CUSTOMER
SATISFACTION.........................................................................................10
2.2.1. PERCEIVED PRODUCT QUALITY AND CUSTOMER
SATISFACTION.........................................................................................11
2.2.3. PERCEIVED PRICE AND CUSTOMER
SATISFACTION.........................................................................................12
2.2.4. CUSTOMER RELATIONSHIP MANAGEMENT AND CUSTOMER
2
SATISFACTION.........................................................................................13
2.2.5. CUSTOMER SATISFACTION AND CUSTOMER LOYALTY ..........14
2.3. CONTROLLING FACTORS ..............................................................................15
2.4. RESEARCH MODEL AND HYPOTHESES ....................................................16
CHAPTER 3: METHOLOGY .......................................................................................18
3.1. RESEARCH PROGRESS ....................................................................................18
3.2. RESEARCH APPROACH ...................................................................................19
3.3 MEASUAREMENT SCALES .............................................................................20
3.4 QUESTIONARE DESIGN ...................................................................................25
3.5. SAMPLE SELECTION ......................................................................................25
3.6. DATA COLLECTION .........................................................................................26
3.7. DATA ANALYSIS ................................................................................................27
CHAPTER 4: DATA ANALYSIS AND RESULT .......................................................29
4.1. DESCRIPTIVE ANALYSIS ................................................................................29
4.2. MEASUAREMENT ASSESSMENT ..................................................................30
4.2.1 CRONBACH’S ALPHA ................................................................................30
4.2.2 EFA..................................................................................................................32
4.3. EVALUATE THE MEASUREMENT SCALES BY CFA ..............................37
4.3.1. THE CFA RESULT FOR INDEPENDENT VARIABLE .......................37
4.3.2. THE CFA RESULT FOR MODERATOR VARIABLE .........................38
3
4.3.3. THE CFA RESULT FOR DEPENDENT VARIABLE ..............................39
4.3.4. THE SATURATED MODEL .......................................................................40
4.3.5. THE THEORITICAL MODEL ...................................................................40
4.3.6. THE BOOTSTRAP .......................................................................................42
4.4. HYPOTHESIS TESTING ....................................................................................43
CHAPTER 5: DATA ANALYSIS AND RESULT .......................................................45
5.1. CONCLUSIONS ...................................................................................................45
5.2. IMPLICATIONS ..................................................................................................46
5.2. LIMITATION AND FUTURE RESEARCH .....................................................48
REFERENCES .................................................................................................................50
APPENDECIE..................................................................................................................58
4
CHAPTER 1. INTRODUCTION
1.1. Research background
According to “Vietnam National Administration of Tourism Report” (2013), in the recent years,
the international visitors came to Viet Nam increase continually: 5.049.855 turns (2010),
6.014.032 turns (2011) and 6.847.678 turns (2012). Besides, attracting the number of domestic
visitors rapidly 28 million (2010), 30 million (2011) and 32, 5 million (2012). Thus demand
about goods for HoReCa channel is so high. HoReCa is an iconic business term
which primarily refers to a sector of the food service industry, to establishments which prepare
and serve food and beverages. The term is a syllabic abbreviation to the words Hotels
& Restaurant Category but to some it also may mean Hotel/Restaurant/Cafe.
Capturing the trends and potential of this HoReCa segment, many companies both foreign and
domestic try to achieve market share. That means the domestics companies have to face the
toughest challenges when the foreign firms entering Vietnam market. The issues are how the
domestic firms survive and develop in the local market.
1.2. Research Problems
In Viet Nam, there are many high level hotels, resorts, restaurants are in business, and in parallel
international visitors increase shapely, it is easy to understand the demand of HoReCa segment
for goods is so large. This channel always in high demand for many essential products for
operational supply food, rest, entertainment, vendors are required to ensure that products bearing
the luxury, elegance, safety and can provide large quantities. Therefore, most of the 3-5 star
5
luxury hotels, restaurants, cafe, using foreign goods; the capacity of domestic manufacturers did
not meet the strict requirements of this market.
However, research by experts in the field of restaurants, hotels, psychology international tourists
to Vietnam always wants to enjoy the special dishes as well as Vietnamese products to try to find
learn about the unique culture of Vietnam. To meet this tastes, in recent years the restaurants,
luxury hotels in the country have begun to look toward domestic manufacturers to order.
According to a representative of the Caravelle Hotel, this hotel is increasingly focusing on
Vietnamese cuisine and met with a number of vendors such as powder at the Saigon Food for the
exchange of product supply issues for buffet at the hotel.
Ms. Pham Thi Uc My, Managing Director of River Beach Resort 4 star, said investors
restaurants, hotels, resorts, firms providing travel services, resort only to trust and use of foreign
goods to avoid risks in the process of serving customers, but now many Vietnam product has
resonated with quality, reasonable price, more so investors tend search for local suppliers to
cooperate.
Horeca businesses tend not to use the products sold on the mass market to luxury class claims in
the eyes, and unique visitors.
At the same time, investors still hesitated choice because if you use the unqualified products,
increasing quality will cause costs to change when a new product or change providers several
times. That's why even though this leads to long wanted to bring Vietnamese goods to promote
the use of image, style of Vietnamese culture, but the hotel is very picky and does not have many
local partners.
6
Therefore, these companies want to put products into Vietnam this channel should be carefully
studied and the technical standards necessary to make distinctions new products to easily
conquer this difficult customers.
According to “Nielsen Shopper Trends” (2012), Vietnam has been faced with bad situation
economic. It has led to some changes in shoppers’ behaviors that have become more pricesensitive (www.nielsen.com). They change to look at the brand in domestic to save money. It is
necessary to find out the factors to which determine consumer loyalty to attract and retain
customers. It also helps the firms make decisions in order to select the most appropriate
strategies for their goals.
1.3. Research Objectives
The research objectives are:
- To identify factors affecting shopper Horeca customers’ loyalty in domestic goods at Viet Nam.
- To determine the impact of each factor on shopper loyalty
Based on the research object, the main purpose of this thesis is to identify what factors have
impact on Horeca shoppers’ loyalty in domestic goods at Viet Nam and examine how these
factors influence their decision of buying domestic goods in Vietnam.
The research questions are:
estic goods at Viet
Nam?
7
Understanding relationship between main factors affecting customers purchase decision is an
important role for domestic enterprises to satisfy customers’ demand and to have available
strategies in is market segment.
1.4. Research Scope
This study focuses on Horeca customers in Ho Chi Minh City; include 3-5 hotels, restaurants,
and café around big center district at Ho Chi Minh City: district 1,2,3,4,5,7,10, BinhThanh,
PhuNhuan, Tan Binh, Thu Duc.
1.5. Research Structure
Corresponding to this process below structure is proposed for this research:
• Chapter 1: Introduction to introduce research background, research problem, research objective,
research question, research scope as well as structure of the research.
• Chapter 2: Literature review. This chapter reviews theories and selects the research’s factors as
well as formulates the research hypotheses and model.
• Chapter 3: Research methodology. This chapter provides general idea how the research is
designed and implemented.
• Chapter 4: Data analysis, result and finding discussion. This chapter translates data collected
from survey, analyses data as well as discusses the result finding in connection with theory.
• Chapter 5: Conclusion, implication, limitation and future research. This Chapter concludes the
research finding, provides implication, further suggestion as well as research limitation.
8
CHAPTER 2. LITERATURE REVIEW
2.1. B2B (business to business) Customer Loyalty
Customer loyalty is a buyer’s overall attachment or deep commitment to a product, service,
brand, or organization (Oliver 1999). Customer loyalty has a powerful impact on firms’
performance and is considered by many companies an important source of competitive
advantage (Heskett, Sasser, and Schlesinger 1997; Rust, Zeithaml, and Lemon 2000; Woodruff
1997).
With loyal customers, companies can maximize their profits. Loyal customers are willing to (1)
purchase more frequently (price insensitivity), (2) try the firm’s new products or services
(repurchase intention), (3) recommend products and services to others (word-of-mouth), and (4)
give companies suggestions (complaint behavior) (Reichheld&Sasser, 1990).
While much research has focused on customer loyalty in business-to-consumer (B2C) contexts,
customer loyalty is important in business-to-business (B2B) contexts as well (Shun Yin Lam,
Venkatesh Shankar, M. Krishna Erramilli and Bvsan Murthy; 2004). In organizational buyerseller relationships, loyal buyers are more likely to focus on long-term benefits and engage in
cooperative actions beneficial to both partners in a relationship than disloyal buyers, thus
enhancing the competitiveness of both partners and reducing transaction costs (Doney and
Cannon 1997; Ganesan 1994; Morgan and Hunt 1994). Indeed, customer loyalty constitutes an
underlying objective for strategic market planning (Kotler 1997).
9
2.2. Key factor affecting of Horeca Customer Loyalty
2.2.1. Perceived Service Quality and Customer Satisfaction
Service quality is defined as “an overall assessment of service by the customers” (Lewis and
Booms, 1983, cited in Ganguli and Roy, 2010). Researchers and practitioners interest in service
quality is clear, reflected in the fact that poor quality compromises a firm’s ability to effectively
differentiate itself in the marketplace, potentially driving away customers (Lovelock and Wirtz,
2011). Indeed, the quality of a service is sometimes more important for customers than the cost
of acquiring that service (Ranaweera and Neely, 2003). Therefore, to satisfy customers, a service
organization needs to understand how customers evaluate the quality of the service they receive
and the basis on which they become loyal to that organization (Kandampully, 1998). Besides, the
superiority of the service offered by an organization depends on customer perception of service
quality and not on the organization’s perception of the service offered (Lobo, et al., 2007). The
comparison that customers made between these expectations and the perception of the method by
which the service has been delivered is known as the perceived service quality (Lehtinen and
Lehtner, 1982; Lewis and Booms, 1983; Parasuraman et la., 1983, 1985, 1991, 1994; Gronroos,
1984; Zeithaml, 1987; Xu, et al., 2006, cited in Obeidat, et al., 2012).
Perceived service quality is defined as “a global judgment of attitude relating to the superiority
of a service” (Parasuraman et al., 1988, p 16). In simple words Jiang and Wang, (2006,cited in
Ishtiaq, 2012) defined it as the consumer’s evaluation of the service performance received and
how it compared with their expectation. Consequences of perceived service quality can be
identified from customers’ behavioral intentions such as repurchase intentions, word of mouth,
and customer loyalty (Zeithaml, Berry, Parasuraman, 1996). Most researchers suggested that
10
high service quality resulted in high customer satisfaction (Parasuraman, Zeithaml, and Berry,
1985, 1988). Teas (1993) also mentioned that perceived serviced quality was accumulation of
customer satisfaction.Thus, the following hypothesis is proposed:
H1: There is a positive relationship between perceived service quality and Horeca customer’s
satisfaction.
2.2.2. Perceived Product Quality and Customer Satisfaction
According Garvin (1987) proposes eight dimensions of product quality such as: Performance
which is refers to a products primary operating characteristics; Features: These are additional
features which are also known as the bells and whistles of the product; Conformance which is
described as the extent to which a product will operate properly over a specified period of time
under stated conditions of use; Reliability: the probability that will operate properly over a
specified period of time under stated conditions of use; Durability: It is the amount of use a
customer gets out of use of a product before it physically deteriorates or until replacement is
preferable; Serviceability: the speed competency and courtesy of repair; Aesthetics: How a
product appeals to all the five senses of a human; Customer perceived quality: Customers
perception of a products quality based on reputation of the firm.
The recognition of product can be considered as an initial stage for developing customer
satisfaction and creating customer loyalty (Eduardo, Arturo, and Jorge, 2008). If a product fulfils
the customer’s expectations, the customer will be pleased and consider that the product is of
acceptable or even high quality (Jahanshahi, Gashti, Mirdamadi, Nawaser, and Khaksar, 2011).
The customer perception about a product is another important dimension which is under
consideration now days in eyes of marketers. What customer thinks about the quality of a
11
product is an important factor. (Bagram& Khan, 2012). Perceived quality differs from objective
quality. Perceived product quality is a global assessment characterized by a high abstraction level
and refers to a specific consumption setting (Zeithaml, 1988). It is the totality of features and
characteristics that exist in a product which can satisfy a customer need or want. Quality is a
direct influence on customer satisfaction which leads a customer towards loyalty then. Perceived
product quality acts as a mediator between extrinsic cues and perceived customer value (Dodds
et al. , 1991). Improvement in customer perceived quality will increase customer satisfaction,
loyalty, and profitability (E.Gummesson, 1998). In Brucks, Zeithaml, and Naylor’s (2000) study
of the perceived quality construct of consumer’s durable goods, perceived product quality played
a crucial role affecting the purchasing choices. In the satisfaction model proposed by
parasuraman, Zeithaml, and Berry (1994), product quality was of same importance to affect
consumer satisfaction as service quality. This study then proposes the impact of product quality
on customer satisfaction:
H2: There is a positive relationship between product quality and Horeca customer’s satisfaction.
2.2.3. Perceived Price and Customer Satisfaction
Originally, price has been something that seller and buyer negotiated upon purchase. On the
markets where supply and demand met, prices were agreed upon to secure the best deal for both
seller and buyer.Price is the amount of money charged for a product or service, or the sum of the
values that customers exchange for the benefits of having or using the product or service (Kotler
and Armstrong, 2010). Anderson, Fornell and Lehmann (1994) also emphasized price as an
important factor of consumer satisfaction, because whenever consumers evaluate the value of an
acquired service, they usually think of the price (Anderson and Sullivan 1993; Athanassopoulos
12
2000; Fornell 1992; Zeithaml 1988). According Zeithaml (1988) both objective price and
perceived price are important factor for customers to evaluate quality. Zeithaml (1988) also
suggested that objective monetary price was not equal to target price in the customer’s mind. The
definition of price depended on customer’s viewpoint was the price customer perceived, it is the
perceived price. And it is meaningful more than monetary price. When customers find out that
the price of a service or product is suitable, it is reasonable for them continue to re-purchase (Bei
and Chiao (2001). Higher pricing perceived by consumers might negatively influence their
purchase probabilities (Peng and Wang, 2006). Many researchers have pointed out that price
perception influences customer satisfaction and trust (Oliver, 1999; Peng and Wang, 2006;
Cheng et al., 2008; Kim et al., 2008). Price policy is an aspect of consumer behavior is critical to
get the satisfaction level of the consumers and their elevation to the status of consumer loyalty
(Nadanasabai , 2012).. This study proposes the following:
H3: There is a positive relationship between perceived price and Horeca customer’s
satisfaction.
2.2.4. Customer Relationship Management and Customer Satisfaction
Customer relationship management (CRM) is a new concept within businesses that has increased
its importance dramatically over the last few years, and will continue to do so in the future (Azila
and Noor, 2011). CRM is a tool and process that allows an organization to identify, understand
and serve customers to improve customer service, retain valuable customers, and help provide
analytical capabilities (Dimitriades, 2006). CRM is the driving force that enables the
characterization of customer and increases the customer value. In addition, CRM helps
companies to retain customer’s satisfaction and customer’s loyalty. It is not only for managing
13
customers and for monitoring their behavior; it also has the potential to change and improve
customer relationship with the service provider and increase business revenue (Dekimpe,
Steenkamp, Mellens and Abeele, 1997). In addition, managing CRM will increase customer
satisfaction due to the interactions between companies and clients; CRM will help companies to
attract and grow new customers; and CRM will strengthen companies’ competitive advantages.
(Chaturvedi, 2005). CRM refers to all business activities directed towards initiating, maintaining,
and developing successful long term relational exchanges (Heide, 1994; Reinartz and Kumar,
2003); the purpose of CRM is to engage in interaction with customers. CRM strategy, on the
other hand, is built to identify customer’s needs, wants and expectations. Learning the customer
demands and complaints by keeping in contact with the customers and producing solutions
peculiar to the customer are the other steps of customer relationship management. Accuratelydirected customer relationships result in customer satisfaction (Kirmaci, 2012). Therefore, this
study tests the following hypotheses:
H4: There is a positive relationship between customer relationship management and Horeca
customer’s satisfaction.
2.2.5. Customer Satisfaction and Customer Loyalty
Kotler (2000); Hoyer &MacInnis (2001) also define satisfaction as a person’s feelings of
pleasure, excitement, delight or disappointment which results from comparing a products
perceived performance to his or her expectations. According to Hasemark and Albinsson (2004)
cited in Singh (2006:1) “satisfaction is an overall attitude towards a product provider or an
emotional reaction to the difference between what customers expect and what they actually
receive regarding the fulfillment of a need”.
14
Customer satisfaction is considered a key driver of the long-term relationship between suppliers
and buyers (Geyskens, Steenkamp, and Kumar 1999). Many studies have shown that customer
satisfaction affects variables that are indicators of customer loyalty or orientation about a service
than are disloyal customers (Ahluwalia, Unnava, and Burnkrant 1999). Customer satisfaction in
the B2B context is often defined as a positive affective state resulting from the appraisal of all
aspects of a firm’s working relationship with another firm (Geyskens, Steenkamp, and Kumar
1999).
Customer satisfaction leads to brand loyalty (Cronin, Brady, and Hult 200; Cronin and Taylor
1992; Lee 1998; McDougall and Levesque 2000). In a modification of Oliver’s definition
(1997), loyalty is defined as a deeply held commitment to repeat purchases of a preferred product
or service consistently in the future, despite situational influences and marketing efforts having
the potential to cause switching behavior.
To distinguish customer satisfaction and customer loyalty, loyal repeat purchase behavior would
be a better measurement to eliminate any possible confusion. Many related empirical studies
(Cronin, Brady, and Hult 200; Cronin and Taylor 1992; Lee 1998; McDougall and Levesque
2000) reported that satisfied customers demonstrate more loyal behavior. The hypothesis is to
repeat the test of this relationship:
H5: There is a positive relationship between Horeca customer satisfaction and Horeca
customer loyalty.
2.3. Controlling factors
Customers’ inside factors: Organizational Factors (Extrinsic reward systems, Role expectations,
Corporate culture and, intrinsic rewards, Cross-functional purchasing teams, Policies supporting
15
vertical and horizontal dimensions)) & Individual factors (Experience: new buy straight and rebuy, Choice of reward-Role orientation, Valence of reward, Probability perceptions) (Dwyer and
Tanner, 2005).
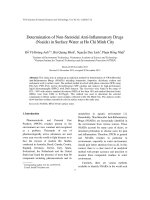
2.4. Research Model and Hypotheses
Based on the above studies, a conceptual model is proposed. Details about a conceptual model
and it hypotheses as follows:
H1: There is a positive relationship between perceived service quality and Horeca customer
satisfaction.
H2: There is a positive relationship between perceived product quality and Horeca customer
satisfaction.
H3: There is a positive relationship between perceived price and Horeca customer satisfaction.
H4: There is a positive relationship between customer relationship management and Horeca
customer satisfaction.
H5: There is a positive relationship between Horeca customer satisfaction and Horeca customer
loyalty.
16
Perceived
Product quality
Perceived Price
policy
Perceived Service
quality
Customer
relationship
management
H1+
+
H2+
+++
+++
=(A
H3+
nch
ore
d
by:
H4+
1.
Stro
ngly
disa
gree
; 2.
Disa
gree
; 3.
Disa
gree
som
ewh
at;
4.
Customer
Satisfaction
Figure 2.1: A Conceptual Model
Neu
tral;
5.
Agr
ee
som
ewh
at;
6.
Agr
ee;
7.
Stro
ngly 17
agre
e)++
+
H5+
+
Horeca
Customers’
Loyalty
Control
factore
Customers’ inside
factors:Organizational
Factor& Individual Factors
CHAPTER 3. METHODOLOGY
3.1. Research Process
This study is conducted as given in the chart below (Figure 3.1)
Figure 3.1: Research Process
18
3.2.Research Approach
This research was descriptive, which drew a picture of the topic and describes
characteristics of a phenomenon or situation in its current state, namely customer loyalty.
Besides, the research sought to indentify relevant attributes of this phenomenon to answer the
question what and how. In descriptive research, correlation, developmental design, observational
studies, and survey research are used. For the research, survey plus observation were the suitable
ways to capture the phenomenon at the moment. The selected approach was based on personal
observation and shopping experiences from perspectives of customers when they do their
grocery.
This research is used for examining the customer behavior, especially in horeca
customers’ loyalty. Singleton (1999) illustrated that different problems have different approaches.
Among of several approaches, we have two main approaches: qualitative research and
quantitative research.
Qualitative approach focuses on finding the insights of the employees through
interview and observation. It helps to produce more in-depth and comprehensive information,
use subjective information and participant observation to describe the context, or natural setting,
of the variables under consideration, as well as the interactions of the different variables in the
context. It seeks a wide understanding of the entire situation.
Quantitative method is used to explain, predict phenomenon with measurable
variables (Leedy&Ormrod 2001:101). Quantitative research also involves data collection that is
typically numeric and the researcher tends to use mathematical models to analyze data. Creswell
(2003:18) states, quantitative research “employ strategies of inquiry such as experimental and
19
surveys, and collect data on predetermined instruments that yield statistical data”. According to
Bryman& Bell (2007) qualitative research emphasizes on words instead of large quantification
and focuses on the individuals‟ interpretations of their social world. This approach also requires
high involvement of participants´ observations from actual experiences (Creswell 1994).
When doing this research, I often base on two questions that I mentioned in chapter 1:
What are the key factors affecting the Horeca customers’ loyalty in domestic goods at Viet Nam?
And How is impact of these factors Horeca customers’ loyalty in domestic goods at Viet Nam?
According to Saunders et al (2000), quantitative takes less time to complete and it is normally
possible to predict accurately the time schedules whereas qualitative research can be much more
prolonged. Most of thesis studies were time constrained. Hence, quantitative approach was the
preferred approach. In quantitative research, survey is a frequently used and universal approach
because it covers a larger respondent population to collect data in highly economical way in
comparison with qualitative. And cccording to Ghauri et al (1995) qualitative methods are not
just differentiated from quantitative in terms of “quantification”, but in reflecting on different
perspectives, such as behavior, events, interactions, relationships among others. Thus, to estimate
the level of customers’ satisfaction, I also find the insights of the customers through interview
and observation in fact to understand deeply about their thought, ideas and etc. Therefore, it can
help me overcome limitation if I combine these two above approaches, so that my research will
more and more effective
3.3. Measurement Scales
Measurement scales were defined from research hypotheses and model. There are six research
concepts in this research which are perceived product quality, perceived service quality,
perceived price quality, customer relationship management, customer satisfaction and
20
customers’loyalty. These measurement scales are developed from many previous
qualifiedresearches which are published in reputed international magazines. Accordingly, the
items and sources of reference for each scale are presented in table below:
No.
1
Variables
Literature review
Measuring items
Perceived
Allaway et al. (2011, 1. The domestic products have good quality
Product
p. 193) and
merchandise
Quality
Parasuraman, A.,
2. The domestic products are very satisfactory
Zeithaml, V. A., &
compared to other competitors
Berry, L. L. (1994).
3. The domestic products offer the assortments of
product
2
Perceived
Allaway et al. (2011, 1. The domestic price charged is reasonable
Price Quality
p. 193) and
2. The pricing policies of domestic products are
Ranaweera& Neely
attractive
(2003) and Cheng et
3.Domestic product supplied is equivalent to its
al (2008) and Peng
price
and Wang (2006)
4. I will continue to stay with domestics products
unless the price is significantly higher of the
products.
3
Perceived
Bass (1974) cited
1. Understanding of my business and product needs
Service
Shun Yin Lam
by the staff
Quality
(2004)
2. Reliability in delivering products (accurately, on
time, etc.)
3. Ease of contacting and ordering products
21
4. Promptness in advising about any problems with
merchandise
4
Customer
Peter
1. The domestic product company’s employees give
Relationship
&Dadson(2013)
customers individual attention
Management
2. The domestic product companies give my
company feedback and information on their products
and services
3. The domestic product company’s employees
regularly meet customer to learn their current and
potential needs for new products or service
development
4. The domestic product companies understand my
company business and give offers matching with my
company’s needs.
5
Customer
Zeithaml et al.
1.In general, my company is very satisfied with the
Satisfaction
(1996) and
services and domestic products offered
Sirdeshmukh et al.
2. Overall, domestic product companies are good
(2002)
companies to do business with.
And Taylor and
3. Overall, the domestic products and service comes
Baker (1994)
up to my company’s expectations.
4. Buying domestic products and service are usually
satisfying experiences
6
Customers’
Zeithaml et al.
1. My company considers domestic products is the
22
Loyalty
(1996) and
first choice
Sirdeshmukh et al.
2. My company will do more business with
(2002)
merchandising domestic products in the future.
3. My company has said positive things about
domestic products
4.. I have encouraged other companies to
merchandize domestic products
3.4. Questionnaire Design
According to Kumar (1996), three resources for primary data collection are
questionnaire, observation and interview. In this research, researchers combined these three
techniques under a form of survey through questionnaires. Since potential respondents were
scattered over a geographic area, the use of questionnaire was likely become most suitable and
economical choice of collecting data. The research only served for purpose of an academic,
popular business phenomenon without any financial fund resources. Thus, questionnaire was
considered as the best way for both academic and financial reasons. Saunders et al (2000)
classify questionnaire as self-administered interview. Interviewer administered questionnaire
consists of telephone questionnaire or structured interview. Self-administered questionnaire may
be online questionnaire, postal questionnaire or delivery and collection questionnaire. The
authors decided to adopt delivery and collection questionnaire. Even though telephone or online
surveys are time-saving, quicker collection and fewer efforts, respondents may not be as
correctly targeted as and information is likely less reliable and administered than traditionally
manual questionnaire.
23