Ebook Cambridge international AS and A level Biology coursebook Part 2
Bạn đang xem bản rút gọn của tài liệu. Xem và tải ngay bản đầy đủ của tài liệu tại đây (48.74 MB, 401 trang )
Cambridge International A Level Biology
286
Chapter 13:
Photosynthesis
Learning outcomes
You should be able to:
■■
■■
■■
describe the absorption of light energy in the
light dependent stage of photosynthesis
explain the transfer of this energy to the light
independent stage of photosynthesis and
its use in the production of complex organic
molecules
describe the role of chloroplast pigments in the
absorption of light energy
■■
■■
■■
discuss how the structure of a chloroplast fits it
for its functions
explain how environmental factors influence the
rate of photosynthesis
describe how C4 plants are adapted for high
rates of carbon fixation at high temperatures
Chapter 13: Photosynthesis
Fuel from algae
Despite millions of hours of research, we still have not
managed to set up a chemical manufacturing system
that can harvest light energy and use it to make
complex chemicals, in the way that plants and some
protoctists do. So, why not just let the cells do it
for us?
Figure 13.1 shows a photobioreactor – a series of
tubes containing the single-celled photosynthetic
organism Chlorella. Provide light, carbon dioxide and
minerals, and the cells photosynthesise. Bioreactors
like this are being used around the world to produce
biomass for animal feed, and chemicals that can
be used as food additives or in the manufacture of
cosmetics. They can also be used to convert energy
from the Sun into ethanol or biodiesel but, so far, the
bioreactors cannot produce biomass cheaply enough
to compete with the use of fossil fuels.
Figure 13.1 A photobioreactor.
An energy transfer process
a
ribosomes
As you have seen at the beginning of Chapter 12, the
starch grain
process of photosynthesis transfers light energy into
chemical potential energy of organic molecules. This
energy can then be released for work in respiration
(Figure 12.2). Almost all the energy transferred to all
the ATP molecules in all living organisms is derived
from light energy used in photosynthesis by autotrophs.
Such photoautotrophs include green plants, the
granum
photosynthetic prokaryotes and both single-celled
and many-celled protoctists (including the green, red
and brown algae). A few autotrophs do not depend on
light energy, but use chemical energy sources. These
b
chemoautotrophs include the nitrifying bacteria that are
so important in the nitrogen cycle. Nitrifying bacteria
obtain their energy from oxidising ammonia (NH3) to
nitrite (NO2–), or nitrite to nitrate (NO3–).
outer membrane
inner membrane
chloroplast
envelope
lipid droplet
stroma
lamella
thylakoid
light
light
thylakoid
membrane
An outline of the process
Photosynthesis is the trapping (fixation) of carbon
dioxide and its subsequent reduction to carbohydrate,
using hydrogen from water. It takes place inside
chloroplasts (Figure 13.2)
photosystem
stroma
primary pigment
reaction centre
accessory pigments
thylakoid
Figure 13.2 a A diagram of a chloroplast. b A photosystem:
a light-harvesting cluster of photosynthetic pigments in a
chloroplast thylakoid membrane. Only a few of the pigment
molecules are shown.
287
Cambridge International A Level Biology
An overall equation for photosynthesis in green
plants is:
n CO2 + n H2O
carbon
dioxide
water
light energy
in the presence
of chlorophyll
(CH2O)n + n O2
carbohydrate oxygen
Hexose sugars and starch are commonly formed, so the
following equation is often used:
6CO2 + 6H2O
carbon
dioxide
288
water
light energy
in the presence
of chlorophyll
C6H12O6 + 6 O2
carbohydrate oxygen
Two sets of reactions are involved. These are the light
dependent reactions, for which light energy is necessary,
and the light independent reactions, for which light
energy is not needed. The light dependent reactions
only take place in the presence of suitable pigments that
absorb certain wavelengths of light (pages 295–296).
Light energy is necessary for the splitting (photolysis)
of water into hydrogen and oxygen; oxygen is a waste
product. Light energy is also needed to provide chemical
energy, in the form of ATP, for the reduction of carbon
dioxide to carbohydrate in the light independent reactions.
The photosynthetic pigments involved fall into two
categories: primary pigments and accessory pigments.
The pigments are arranged in light-harvesting clusters
called photosystems of which there are two types, I and
II. In a photosystem, several hundred accessory pigment
molecules surround a primary pigment molecule, and the
energy of the light absorbed by the different pigments is
passed to the primary pigment (Figure 13.2b). The primary
pigments are two forms of chlorophyll (pages 295–296).
These primary pigments are said to act as reaction centres.
The light dependent reactions
of photosynthesis
The light dependent reactions include the splitting of water
by photolysis to give hydrogen ions (protons) and the
synthesis of ATP in photophosphorylation. The hydrogen
ions combine with a carrier molecule NADP (page 275), to
make reduced NADP. ATP and reduced NADP are passed
from the light dependent to the light independent reactions.
Photophosphorylation of ADP to ATP can be cyclic or
non-cyclic, depending on the pattern of electron flow in
one or both types of photosystem.
Cyclic photophosphorylation
Cyclic photophosphorylation involves only photosystem I.
Light is absorbed by photosystem I and is passed to the
primary pigment. An electron in the chlorophyll molecule
is excited to a higher energy level and is emitted from
the chlorophyll molecule. This is called photoactivation.
Instead of falling back into the photosystem and losing its
energy as thermal energy or as fluorescence, the excited
electron is captured by an electron acceptor and passed
back to a chlorophyll molecule via a chain of electron
carriers. During this process, enough energy is released
to synthesise ATP from ADP and an inorganic phosphate
group (Pi) by the process of chemiosmosis (page 270). The
ATP then passes to the light independent reactions.
Non-cyclic photophosphorylation
Non-cyclic photophosphorylation involves both
photosystems in the so-called ‘Z scheme’ of electron flow
(Figure 13.3). Light is absorbed by both photosystems
and excited electrons are emitted from the primary
pigments of both reaction centres. These electrons are
absorbed by electron acceptors and pass along chains
of electron carriers, leaving the photosystems positively
charged. The primary pigment of photosystem I absorbs
electrons from photosystem II. Its primary pigment
receives replacement electrons from the splitting
(photolysis) of water. As in cyclic photophosphorylation,
ATP is synthesised as the electrons lose energy while
passing along the carrier chain.
Photolysis of water
Photosystem II includes a water-splitting enzyme that
catalyses the breakdown of water:
H2O → 2H+ + 2e− + 12 O2
Oxygen is a waste product of this process. The
hydrogen ions combine with electrons from photosystem
I and the carrier molecule NADP to give reduced NADP.
2H+ + 2e− + NADP → reduced NADP
Reduced NADP passes to the light independent reactions
and is used in the synthesis of carbohydrate.
The photolysis of water can be demonstrated by the
Hill reaction.
The Hill reaction
Redox reactions are oxidation–reduction reactions and
involve the transfer of electrons from an electron donor
(reducing agent) to an electron acceptor (oxidising agent).
Sometimes hydrogen atoms are transferred, so that
dehydrogenation is equivalent to oxidation.
Key
flow of electrons in non-cyclic
photophosphorylation
flow of electrons in cyclicChapter 13: Photosynthesis
photophosphorylation
chains of electron carriers
2e–
ADP + Pi
2e–
NADP + 2H+
ATP
H2O
primary pigment
photosystem I
1
2 O2
Key
2H+
flow of electrons in non-cyclic
photophosphorylation
flow of electrons in cyclic
photophosphorylation
chains of electron carriers
reduced
NADP
light
primary pigment
photosystem II
increasing
energy
level
Figure 13.3 The ‘Z scheme’ of electron flow in photophosphorylation.
light
In 1939, Robert Hill showed that isolated chloroplasts
(dichlorophenolindophenol), can substitute for the
– water
had ‘reducing power’ and liberated oxygen from
plant’s NADP in this system (Figure 13.4). DCPIP becomes
2e
in the presence of an oxidising agent. The ‘reducing
colourless when reduced:
power’ was demonstrated by
using
ADP
+ Pi a redox agent that
chloroplasts in light
NADP + 2H+
oxidised DCPIP
reduced DCPIP
changed colour on reduction.
This technique can be
2e–
ATP
used to investigate the effect of light intensity or of light
(blue) (colourless)
H2O
primary pigment
reduced
1
wavelength on
the rate1 of photosynthesis
of
a
suspension
H2O
photosystem I
2 O2
NADP
O
3+
2
2
of chloroplasts. Hill used Fe ions as his acceptor,
Figure 13.4 shows classroom results of this reaction.
but various redox
agents, such as the blue dye DCPIP
2H+
light
primary pigment
BOX 13.1: Investigating
the Hill reaction
photosystem II
blue
1.8
placed in light
1.6
Colorimeter reading / arbitrary units
increasing can be isolated from a leafy plant, such as
Chloroplasts
energy
lettuce
or spinach, by liquidising the leaves in ice-cold
bufferlevel
and then filteringlight
or centrifuging the resulting
suspension to remove unwanted debris. Working quickly
and using chilled glassware, small tubes of buffered
chloroplast suspension with added DCPIP solution
are placed in different light intensities or in different
wavelengths of light and the blue colour assessed at
intervals.
The rate of loss of blue colour (as measured in a
colorimeter or by matching the tubes against known
concentrations of DCPIP solution) is a measure of the
effect of the factor being investigated (light intensity or
the wavelength of light) on chloroplast activity.
1.4
Key
chloroplasts in light
chloroplasts in dark
for five minutes,
then in light
1.2
1.0
0.8
0.6
0.4
0.2
Figure 13.4 The Hill reaction. Chloroplasts were
extracted from lettuce and placed in buffer solution
with DCPIP. The colorimeter reading is proportional
to the amount of DCPIP remaining unreduced.
colourless
0
2
4
6
8
10
Time / minutes
12
14
16
289
Cambridge International A Level Biology
CO2
(1C)
QUESTIONS
13.1 Examine the two curves shown in Figure 13.4 and
explain:
a the downward trend of the two curves
b the differences between the two curves.
13.2Explain what contribution the discovery of the Hill
reaction made to an understanding of the process of
photosynthesis.
RuBP
ribulose bisphosphate
(5C)
unstable intermediate
(6C)
Calvin cycle
The light independent reactions
of photosynthesis
290
The fixation of carbon dioxide is a light independent
process in which carbon dioxide combines with a fivecarbon sugar, ribulose bisphosphate (RuBP), to give
two molecules of a three-carbon compound, glycerate
3-phosphate (GP). (This compound is also sometimes
known as PGA.)
GP, in the presence of ATP and reduced NADP from the
light dependent stages, is reduced to triose phosphate (TP)
(three-carbon sugar). This is the point at which carbohydrate
is produced in photosynthesis. Most (five-sixths) of the triose
phosphates are used to regenerate RuBP, but the remainder
(one-sixth) are used to produce other molecules needed
by the plant. Some of these triose phosphates condense
to become hexose phosphates which, in turn, are used to
produce starch for storage, sucrose for translocation around
the plant, or cellulose for making cell walls. Others are
converted to glycerol and fatty acids to produce lipids for
cellular membranes or to acetyl coenzyme A for use in
respiration or in the production of amino acids for protein
synthesis.
This cycle of events was worked out by Calvin, Benson
and Bassham between 1946 and 1953, and is usually
called the Calvin cycle (Figure 13.5). The enzyme ribulose
bisphosphate carboxylase (rubisco), which catalyses the
combination of carbon dioxide and RuBP, is the most
common enzyme in the world.
Chloroplast structure
and function
In eukaryotic organisms, the photosynthetic organelle
is the chloroplast. In dicotyledons, chloroplasts can be
seen with a light microscope and appear as biconvex
discs about 3–10 μm in diameter. There may be only a few
chloroplasts in a cell or as many as 100 in some palisade
mesophyll cells.
GP
× 2 glycerate
3-phosphate
reduced
(3C)
NADP
NADP
ADP
ATP
TP
× 2 triose
phosphate (3C)
ATP
ADP + Pi
glucose (6C), amino
acids and lipids
Figure 13.5 The Calvin cycle.
The structure of a chloroplast is shown in Figures
13.2a and 13.6. Each chloroplast is surrounded by an
envelope of two phospholipid membranes. A system of
membranes also runs through the ground substance,
or stroma. The membrane system is the site of the light
dependent reactions of photosynthesis. It consists of a
series of flattened fluid-filled sacs, or thylakoids, which
in places form stacks, called grana, that are joined to
one another by membranes. The membranes of the
grana provide a large surface area, which holds the
pigments, enzymes and electron carriers needed for
the light dependent reactions. The membranes make
it possible for a large number of pigment molecules to
be arranged so that they can absorb as much light as
necessary. The pigment molecules are also arranged in
particular light-harvesting clusters for efficient light
absorption. In each photosystem, the different pigments
are arranged in the thylakoid in funnel-like structures
(Figure 13.2, page 287). Each pigment passes energy
to the next member of the cluster, finally ‘feeding’ it to
the chlorophyll a reaction centre (primary pigment).
The membranes of the grana hold ATP synthase and
are the site of ATP synthesis by chemiosmosis (page 270).
The stroma is the site of the light independent
reactions. It contains the enzymes of the Calvin cycle,
sugars and organic acids. It bathes the membranes
of the grana and so can receive the products of the
light dependent reactions. Also within the stroma are
small (70 S) ribosomes, a loop of DNA, lipid droplets and
Chapter 13: Photosynthesis
Rate of photosynthesis
photosynthesis varies with the light intensity, initially
increasing as the light intensity increases (Figure 13.7).
However, at higher light intensities, this relationship no
longer holds and the rate of photosynthesis reaches
a plateau.
starch grains. The loop of DNA codes for some of the
chloroplast proteins, which are made by the chloroplast’s
ribosomes. However, other chloroplast proteins are coded
for by the DNA in the plant cell nucleus.
QUESTION
13.3 List the features of a chloroplast that aid
photosynthesis.
Factors necessary for
photosynthesis
You can see from the equation on page 288 that certain
factors are necessary for photosynthesis to occur, namely
the presence of a suitable photosynthetic pigment, a supply
of carbon dioxide, water and light energy.
Light intensity
Figure 13.7 The rate of photosynthesis at different light
intensities and constant temperature.
The effect on the rate of photosynthesis of varying
the temperature at constant light intensities can be
seen in Figure 13.8. At high light intensity the rate
of photosynthesis increases as the temperature is
increased over a limited range. At low light intensity,
increasing the temperature has little effect on the rate of
photosynthesis.
Rate of photosynthesis
Figure 13.6 Transmission electron micrograph of a
chloroplast from Potamogeton leaf (× 27 000). See also
Figure 1.29.
high light intensity
Factors affecting the rate of
photosynthesis
The main external factors affecting the rate of
photosynthesis are light intensity and wavelength,
temperature and carbon dioxide concentration.
In the early 1900s, F. F. Blackman investigated the
effects of light intensity and temperature on the rate of
photosynthesis. At constant temperature, the rate of
291
low light intensity
0
5
10
15
Temperature / °C
20
Figure 13.8 The rate of photosynthesis at different
temperatures and constant light intensities.
25
Cambridge International A Level Biology
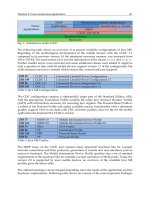
These two experiments illustrate two important points.
Firstly, from other research we know that photochemical
reactions are not generally affected by temperature.
However, these experiments clearly show that temperature
affects the rate of photosynthesis, so there must be two sets
of reactions in the full process of photosynthesis. These
are a light dependent photochemical stage and a light
independent, temperature dependent stage. Secondly,
Blackman’s experiments illustrate the concept of
limiting factors.
Limiting factors
experiment 3
25 °C; 0.4% CO2
Rate of photosynthesis
292
The rate of any process which depends on a series of
reactions is limited by the slowest reaction in the series.
In biochemistry, if a process is affected by more than
one factor, the rate will be limited by the factor which is
nearest its lowest value.
Look at Figure 13.9. At low light intensities, the limiting
factor governing the rate of photosynthesis is the light
intensity; as the intensities increase so does the rate. But
at high light intensity, one or more other factors must be
limiting, such as temperature or carbon dioxide supply.
As you will see in the next section of this chapter, not
all wavelengths of light can be used in photosynthesis. This
means that the wavelengths of light that reach a plant’s
leaves may limit its rate of photosynthesis (Figure 13.16b,
page 295).
experiment 1
25 °C; 0.04% CO2
experiment 2
15 °C; 0.04% CO2
Light intensity
Figure 13.9 The rate of photosynthesis at different
temperatures and different carbon dioxide concentrations.
(0.04% CO2 is about atmospheric concentration.)
QUESTION
13.4 Examine Figure 13.9, which shows the effect of various
factors on the rate of photosynthesis, and explain the
differences between the results of:
a experiments 1 and 2
b experiments 1 and 3.
At constant light intensity and temperature, the rate
of photosynthesis initially increases with an increasing
concentration of carbon dioxide, but again reaches a
plateau at higher concentrations. A graph of the rate of
photosynthesis at different concentrations of carbon
dioxide has the same shape as that for different light
intensities (Figure 13.9). At low concentrations of carbon
dioxide, the supply of carbon dioxide is the rate-limiting
factor. At higher concentrations of carbon dioxide,
other factors are rate-limiting, such as light intensity or
temperature.
The effects of these limiting factors on the rate of
photosynthesis are easily investigated by using an aquatic
plant such as Elodea or Cabomba in a simple apparatus
as shown in Figure 13.10. The number of bubbles of gas
(mostly oxygen) produced in unit time from a cut stem
of the plant can be counted in different conditions.
Alternatively, the gas can be collected and the volume
produced in unit time can be measured. This procedure
depends on the fact that the rate of production of oxygen is
a measure of the rate of photosynthesis.
Growing plants in protected
environments
An understanding of the effect of environmental factors
on the rate of photosynthesis allows their management
when crops are grown in protected environments, such
as glasshouses. The aim is to increase the yield of the
crop concerned.
For example, many hectares of tomato plants are grown
in glasshouses. In the most sophisticated of these, sensors
monitor the light intensity, the humidity of the atmosphere
and the concentration of carbon dioxide around the
plants. The plants grow hydroponically – that is, with their
roots in a nutrient solution whose nutrient content can be
varied at different stages of the plants’ growth. All of these
factors are managed by a computer to maximise the yield
of the crop.
Such glasshouse-grown crops have the added advantage
that insect pests and fungal diseases are more easily
controlled than is possible with field-grown crops, further
improving yield.
Chapter 13: Photosynthesis
BOX 13.2: Investigating the rate of photosynthesis using an aquatic plant
Elodea, or other similar aquatic plants, can be used to
investigate the effect on the rate of photosynthesis of
altering the:
■■
■■
■■
■■
light intensity – by altering the distance, d, of a small
light source from the plants (light intensity is
1
proportional to 2 )
d
wavelength of light – by using different colour filters,
making sure that they each transmit the same light
intensity
concentration of carbon dioxide – by adding different
quantities of sodium hydrogencarbonate (NaHCO3) to
the water surrounding the plant
temperature of the water surrounding the plant
– using a large container, such as a beaker, to help
maintain the chosen temperatures.
The aquatic plant needs to be well illuminated before use
and the chosen stem needs to be cut cleanly just before
putting it into a test tube (Figure 13.10).
The bubbles given off are mostly oxygen, but contain
some nitrogen. To prevent these gases from dissolving in
the water, rather than forming bubbles, the water needs to
be well aerated (by bubbling air through it) before use.
293
Figure 13.10 Investigating the rate of photosynthesis
using an aquatic plant.
C4 plants
In the light independent stage of photosynthesis, you may
remember that carbon dioxide combines with RuBP to
form a six-carbon compound, which immediately splits to
form two three-carbon molecules (page 290). Plants that
do this are called C3 plants.
However, maize and sorghum plants – and most
other tropical grasses – do something different. The first
compound that is produced in the light independent
reaction contains four carbon atoms. They are therefore
called C4 plants.
Avoiding photorespiration
Why do tropical grasses need to do something different
from other plants in the light independent stage of
photosynthesis? The reason is a problem with the enzyme
rubisco. This enzyme catalyses the reaction of carbon
dioxide with RuBP. But, unfortunately, it can also catalyse
the reaction of oxygen with RuBP. When this happens,
less photosynthesis takes place, because some of the
RuBP is being ‘wasted’ and less is available to combine
with carbon dioxide. This unwanted reaction is known
as photorespiration. It happens most readily in high
temperatures and high light intensity – that is, conditions
that are found at low altitudes in tropical parts of
the world.
Tropical grasses such as maize, sorghum and sugar cane
have evolved a method of avoiding photorespiration. They
keep RuBP and rubisco well away from high oxygen
concentrations. The cells that contain RuBP and rubisco
are arranged around the vascular bundles, and are called
bundle sheath cells (Figures 13.11, 13.12 and 13.13). They
have no direct contact with the air inside the leaf.
Carbon dioxide is absorbed by another group of
cells, the mesophyll cells, which are in contact with
air (Figure 13.13). The mesophyll cells contain an enzyme
called PEP carboxylase, which catalyses the combination
of carbon dioxide from the air with a three-carbon
substance called phosphoenolpyruvate, or PEP. The
compound formed from this reaction is oxaloacetate
(Figure 13.14).
Cambridge International A Level Biology
Still inside the mesophyll cells, the oxaloacetate is
converted to malate, and this is passed on to the bundle
sheath cells. Now the carbon dioxide is removed from the
malate molecules and delivered to RuBP by rubisco in the
normal way. The light independent reaction then proceeds
as usual.
Enzymes in C4 plants generally have higher optimum
temperatures than those in C3 plants. This is an adaptation
to growing in hot climates. For example, in one study
it was found that in amaranth, which is a C4 plant, the
optimum temperature for the activity of PEP carboxylase is
around 45 °C. If the temperature drops to 15 °C, the enzyme
loses around 70% of its activity. By contrast, the same
enzyme in peas, which are C3 plants, was found to have an
optimum temperature of around 30 °C and could continue
to work at much lower temperatures than in amaranth.
light
Figure 13.11 Photomicrograph of a section through a leaf of
maize (× 125).
carbon dioxide
photosynthesis in ring
of mesophyll cells
PEP C3 oxaloacetate
light
C4
dependent
reactions
malate C4
pyruvate C3
carbon
dioxide
294
photosynthesis in
bundle sheath cells
Calvin
cycle
sugars
Figure 13.12 Photomicrograph of a section through a leaf of
sugar cane (× 120).
Figure 13.14 C4 photosynthesis.
upper epidermis
mesophyll
lower epidermis
Figure 13.13 Tissues surrounding a vascular bundle of a C4 leaf.
ring of mesophyll cells
This tight ring of specialised mesophyll
cells excludes air from the cells inside
the ring. The cytoplasm fixes carbon
dioxide. The chloroplasts capture light
and carry out the light dependent
reactions but not the Calvin cycle.
bundle sheath cells
The bundle sheath cells carry out the Calvin
cycle but not the light dependent reactions.
No air gets to these cells, and they get
carbon dioxide from the mesophyll cells.
Chapter 13: Photosynthesis
Trapping light energy
Chloroplasts contain several different pigments, and
these different pigments absorb different wavelengths of
light. The photosynthetic pigments of higher plants form
two groups: the chlorophylls (primary pigments) and the
carotenoids (accessory pigments) (Table 13.1).
Group
Pigment
Colour
chlorophylls
chlorophyll a
chlorophyll b
yellow-green
blue-green
carotenoids
β carotene
xanthophyll
orange
yellow
Table 13.1 The colours of the commonly occurring
photosynthetic pigments.
Chlorophylls absorb mainly in the red and blueviolet regions of the light spectrum. They reflect green
light, which is why plants look green. The structure of
chlorophyll a is shown in Figure 13.15. The carotenoids
absorb mainly in the blue-violet region of the spectrum.
CH2
H3C
chlorophyll a
N
CH2
N
carotenoids
400
450
b
500
550
600
Wavelength of light / nm
650
700
295
CH3
400
450
Mg
N
CH3
(CH2)2
C
OC
O
O
CH2
CH3
O
O
CH
C
CH3
(CH2)3
CH
CH3
(CH2)3
CH
CH3
(CH2)3
CH
500
550
600
Wavelength of light / nm
650
700
N
H3C
tail
chlorophyll b
CH3
CH
head
a
Absorbance
13.5 Some of the most productive crop plants in the
world are C4 plants. However, rice grows in tropical
regions and is a C3 plant. Research is taking place
into the possibility of producing genetically modified
rice that uses the C4 pathway in photosynthesis.
Explain how this could increase yields from rice.
An absorption spectrum is a graph of the absorbance of
different wavelengths of light by a pigment (Figure 13.16a).
An action spectrum is a graph of the rate of
photosynthesis at different wavelengths of light
(Figure 13.16b). This shows the effectiveness of the
different wavelengths, which is, of course, related to their
absorption and to their energy content. The shorter the
wavelength, the greater the energy it contains.
Rate of photosynthesis
QUESTION
CH3
CH3
Figure 13.15 Structure of chlorophyll a. You do not need to
learn this molecular structure.
Figure 13.16 a Absorption spectra of chlorophylls a and b,
and carotenoid pigments. b Photosynthetic action spectrum.
QUESTION
13.6 Compare the absorption spectra shown in
Figure 13.16a with the action spectrum shown
in Figure 13.16b.
a Identify and explain any similarities in the
absorption and action spectra.
b Identify and explain any differences between the
absorption and action spectra.
Cambridge International A Level Biology
If you illuminate a solution of chlorophyll a or b
with ultraviolet light, you will see a red fluorescence. (In
the absence of a safe ultraviolet light, you can illuminate
the pigment with a standard fluorescent tube.) The
ultraviolet light is absorbed and electrons are excited
but, in a solution that only contains extracted pigment,
the absorbed energy cannot usefully be passed on to do
work. The electrons return to their unexcited state and
the absorbed energy is transferred to the surroundings
as thermal energy and as light at a longer (less energetic)
wavelength than that which was absorbed, and is seen as
the red fluorescence. In the functioning photosynthetic
system, it is this energy that drives the process
of photosynthesis.
You can easily extract chloroplast pigments from a
leaf to see how many pigments are present, by using paper
chromatography as shown in Figure 13.17.
You can calculate the Rf value for each pigment, using
this equation:
Rf =
296
distance travelled by pigment spot
distance travelled by solvent
carotenoids
chlorophyll a
The solvent rises up the
paper carrying each
pigment at a different
speed. This separates the
pigments, as they move
different distances.
chlorophyll b
A mixture of pigments extracted
from leaves is placed on the
paper at a pencil mark.
solvent
Figure 13.17 Chromatography of pigments in chloroplasts.
These will vary depending on the solvent used, but in
general carotenoids have Rf values close to 1, chlorophyll b
has a much lower Rf value and chlorophyll a has an Rf
value between those of carotenoids and chlorophyll b.
Summary
■■
■■
■■
In photosynthesis, light energy is absorbed by
chlorophyll pigments and converted to chemical energy,
which is used to produce complex organic molecules.
In the light dependent reactions, water is split by
photolysis to give hydrogen ions, electrons and oxygen.
The hydrogen ions and electrons are used to reduce the
carrier molecule, NADP, and the oxygen is given off as a
waste product.
ATP is synthesised in the light dependent reactions
of cyclic and non-cyclic photophosphorylation.
During these reactions, the photosynthetic pigments
of the chloroplast absorb light energy and give out
excited electrons. Energy from the electrons is used
to synthesise ATP. ATP and reduced NADP are the
two main products of the light dependent reactions
of photosynthesis, and they then pass to the light
independent reactions.
In the light independent reactions, carbon dioxide is
trapped by combination with a 5C compound, RuBP,
which acts as an acceptor molecule. This reaction
is catalysed by the enzyme ribulose bisphosphate
carboxylase (rubisco), which is the most common
enzyme in the world. The resulting 6C compound
splits to give two molecules of a 3C compound, GP
(also known as PGA). GP is reduced to carbohydrate,
using ATP and reduced NADP from the light dependent
reactions. This carbohydrate can be converted into
other carbohydrates, amino acids and lipids or used to
regenerate RuBP. This sequence of light independent
events is called the Calvin cycle.
■■
Chloroplasts are adapted for the efficient absorption
of light for the process of photosynthesis. When a
process is affected by more than one factor, the rate of
the process will be limited by the factor closest to its
lowest value. The rate of photosynthesis is subject to
various such limiting factors, including light intensity
and wavelength, carbon dioxide concentration and
temperature.
■■
Some tropical crops are adapted for high rates of
carbon fixation at high temperatures by having a leaf
structure that separates initial carbon fixation from
the light independent stage, and by the high optimum
temperatures of the enzymes concerned.
■■
A graph of the particular wavelengths of light that
are absorbed by a photosynthetic pigment is called
an absorption spectrum. A graph of the rate of
photosynthesis at different wavelengths of light is called
an action spectrum.
■■
The different pigments present in a chloroplast can be
separated by paper chromatography.
Chapter 13: Photosynthesis
End-of-chapter questions
1 What are the products of the light dependent reactions of photosynthesis?
A ATP, RuBP and reduced NAD
B ATP, oxygen and reduced NADP
C GP, oxygen and reduced NAD
D GP, reduced NADP and RuBP
[1]
2 Where in the chloroplast are the products of photophosphorylation used?
A envelope
B granum
C stroma
D thylakoid
[1]
3 In separate experiments, an actively photosynthesising plant was supplied with one of two labelled reactants:
water containing the 18O isotope of oxygen
carbon dioxide containing the 17O isotope of oxygen.
In which products of photosynthesis would these isotopes be found?
A
B
C
D
18O
17O
oxygen produced by chloroplast grana
oxygen produced by the chloroplast stroma
carbohydrate produced by chloroplast grana
carbohydrate produced by the chloroplast stroma
carbohydrate produced by the chloroplast stroma
carbohydrate produced by chloroplast grana
oxygen produced by the chloroplast stroma
oxygen produced by chloroplast grana
297
[1]
4 a Explain how the inner membrane system of a chloroplast makes it well adapted for photosynthesis.
b Copy the table below and insert ticks or crosses to show which structural features are shared by a plant
chloroplast and a typical prokaryotic cell.
✓= structural feature shared; ✗ = structural feature not shared.
Structural feature
[5]
Structural feature shared by chloroplast and
typical prokaryotic cell
circular DNA
DNA combined with structural protein to form
chromosomes
ribosomes about 18 nm in diameter
complex arrangement of internal membranes
peptidoglycan wall
size ranges overlap
[6]
[Total: 11]
5 a When isolated chloroplasts are placed in buffer solution with a blue dye such as DCPIP or methylene blue
and illuminated, the blue colour disappears. Explain this observation.
b Name the compound, normally present in photosynthesis, that is replaced by the blue dye in this investigation.
[4]
[1]
[Total: 5]
Cambridge International A Level Biology
6 Distinguish between:
a cyclic and non-cyclic photophosphorylation
b photophosphorylation and oxidative phosphorylation
c the roles of NAD and NADP in a plant.
[2]
[2]
[2]
[Total: 6]
7 a Draw a simple flow diagram of the Calvin cycle to show the relative positions in the cycle of the
following molecules:
CO2 (1C)
GP/PGA (3C)
triose phosphate (3C)
RuBP (5C).
b Show the point in the cycle at which the enzyme rubisco is active.
8 a Explain what is meant by a limiting factor.
b List four factors that may be rate-limiting in photosynthesis.
c At low light intensities, increasing the temperature has little effect on the rate of photosynthesis.
At high light intensities, increasing the temperature increases the rate of photosynthesis.
Explain these observations.
298
9 a Copy and complete the table to show the differences between mesophyll and bundle sheath cells in
C4 plants. Insert a tick (✓) when an item is present in the cell and a cross (✗) when it is not.
Item
Mesophyll cell
[4]
[1]
[Total: 5]
[1]
[4]
[5]
[Total: 10]
[7]
Bundle sheath cell
PEP carboxylase
rubisco
RuBP
enzymes of Calvin cycle
high concentration of oxygen
light dependent reactions
contact with air spaces
b Explain what is meant by photorespiration.
[2]
[Total: 9]
10 a Distinguish between an absorption spectrum and an action spectrum.
b Pondweed was exposed to each of three different wavelengths of light for the same length of time.
For each wavelength, the number of bubbles produced from the cut ends of the pondweed were counted and
are shown in the table.
Wavelength of light / nm
450
550
650
Explain these results.
[4]
Mean number of bubbles
produced in unit time
22
3
18
[4]
[Total: 8]
299
Chapter 14:
Homeostasis
Learning outcomes
You should be able to:
■■
■■
■■
■■
explain the importance of homeostasis, and
describe how the nervous and endocrine
systems coordinate homeostasis in mammals
describe the structure of the kidneys, and their
roles in excretion and osmoregulation
explain how blood glucose concentration
is regulated
explain what is meant by negative feedback
■■
■■
■■
■■
describe how cell signalling is involved in the
response of liver cells to adrenaline
and glucagon
explain the principles of operation of dip sticks
to test for the presence of glucose in urine
describe the factors that cause stomata to open
and close
describe how abscisic acid causes guard cells to
close stomata
Cambridge International A Level Biology
The black bear’s big sleep
It is metabolically expensive for a mammal to maintain
a constant, warm body temperature in long winters
when it is very cold and food is hard to find. Black
bears feed well during the summer to build up stores
of energy-rich fat (Figure 14.1). In the autumn and
early winter, the bears dig dens for themselves, or
find a ready-made one in somewhere like a cave,
curl up and sleep until the weather improves. Their
metabolism adjusts for this lengthy period of inactivity
when they do not eat, drink, urinate or defecate.
Their stores of fat and some muscle protein provide
energy. The waste product of protein breakdown is
urea, which is filtered from the blood by the kidneys.
The kidneys continue to produce urine, but it is all
reabsorbed by the bladder. The urea cannot be stored;
instead it is recycled by the bear’s gut bacteria. These
break it down to ammonia and carbon dioxide,
which are absorbed into the blood. Carbon dioxide is
breathed out and ammonia combined with glycerol
from the breakdown of fat to make amino acids.
300
To function efficiently, organisms have control systems to
keep internal conditions near constant, a feature known as
homeostasis. This requires information about conditions
inside the body and the surroundings, which are detected
by sensory cells. Some of the physiological factors
controlled in homeostasis in mammals are:
■■
■■
■■
■■
■■
■■
core body temperature
metabolic wastes, particularly carbon dioxide and urea
blood pH
blood glucose concentration
water potential of the blood
the concentrations in the blood of the respiratory gases,
oxygen and carbon dioxide.
First, we will look at the need for mammals to maintain a
stable internal environment, and then consider how they
maintain a constant core body temperature.
Internal environment
The internal environment of an organism refers to all
the conditions inside the body. These are the conditions
in which the cells function. For a cell, its immediate
environment is the tissue fluid that surrounds it.
The amino acids are used to synthesise the enzymes
that are needed in larger quantities for the increased
hydrolysis of fat during the bear’s hibernation.
Figure 14.1 During the summer, black bears build up stores
of fat for survival during the seven months or so when they do
not eat.
Many features of the tissue fluid influence how well the
cell functions. Three features of tissue fluid that influence
cell activities are:
■■
■■
■■
temperature – low temperatures slow down metabolic
reactions; at high temperatures proteins, including
enzymes, are denatured and cannot function
water potential – if the water potential decreases, water
may move out of cells by osmosis, causing metabolic
reactions in the cell to slow or stop; if the water
potential increases, water may enter the cell causing it
to swell and maybe burst
concentration of glucose – glucose is the fuel for
respiration, so lack of it causes respiration to slow or
stop, depriving the cell of an energy source; too much
glucose may cause water to move out of the cell by
osmosis, again disturbing the metabolism of the cell.
In general, homeostatic mechanisms work by controlling
the composition of blood, which therefore controls the
composition of tissue fluid. See page 164 to remind
yourself how this happens. There are control mechanisms
for the different aspects of the blood and tissue fluid. These
include the three physiological factors listed above.
Chapter 14: Homeostasis
Homeostatic control
Most control mechanisms in living organisms use a
negative feedback control loop (Figure 14.2) to maintain
homeostatic balance. This involves a receptor (or sensor)
and an effector. Effectors include muscles and glands.
The receptor detects stimuli that are involved with the
condition (or physiological factor) being regulated. A
stimulus is any change in a factor, such as a change in
blood temperature or the water content of the blood. The
body has receptors which detect external stimuli and other
receptors that detect internal stimuli. These receptors send
information about the changes they detect through the
nervous system to a central control in the brain or spinal
cord. This sensory information is known as the input. The
central control instructs an effector to carry out an action,
which is called the output. These actions are sometimes
called corrective actions as their effect is to correct (or
reverse) the change. Continuous monitoring of the factor
by receptors produces a steady stream of information to
the control centre that makes continuous adjustments
to the output. As a result, the factor fluctuates around a
particular ‘ideal’ value, or set point. This mechanism to
keep changes in the factor within narrow limits is known
as negative feedback. In these systems, an increase in
the factor results in something happening that makes
the factor decrease. Similarly, if there is a decrease in
the factor, then something happens to make it increase.
Homeostatic mechanisms involve negative feedback as it
minimises the difference between the actual value of the
factor and the ideal value or set point. The factor never
Factor rises
above set point.
stays exactly constant, but fluctuates a little above and a
little below the set point.
The homeostatic mechanisms in mammals require
information to be transferred between different parts of
the body. There are two coordination systems in mammals
that do this: the nervous system and the endocrine system.
■■
■■
In the nervous system, information in the form of
electrical impulses is transmitted along nerve cells
(neurones).
The endocrine system uses chemical messengers called
hormones that travel in the blood, in a form of longdistance cell signalling.
QUESTION
14.1 a Describe the immediate environment of a typical
cell within the body of a mammal.
b Explain why it is important that the internal
environment of a mammal is carefully regulated.
c Explain how the following are involved in
maintaining the internal environment of a
mammal: stimuli, receptors, central control,
coordination systems and effectors.
di Explain the meaning of the terms homeostasis
and negative feedback.
iiDistinguish between the input and the output
in a homeostatic control mechanism.
Receptors sense
change in factor.
Effectors act to
increase factor.
Effectors act to
decrease factor.
Effectors receive information
from receptor.
Figure 14.2 A negative feedback control loop.
Factor falls
below set point.
301
Cambridge International A Level Biology
The control of body
temperature
Thermoregulation is the control of body temperature.
This involves both coordination systems – nervous and
endocrine. All mammals generate heat and have ways to
retain it within their bodies. They also have physiological
methods to balance heat gain, retention of body heat
and heat loss so that they can maintain a constant body
temperature. As a result, they are not dependent on
absorbing heat from their surroundings and can be
active at any time of day or night, whatever the external
temperature. Most other animals, with the exception
of birds, rely on external sources of heat and are often
relatively inactive when it is cold.
a
In the heat
302
The heat that mammals generate is released during
respiration (page 272). Much of the heat is produced
by liver cells that have a huge requirement for energy.
The heat they produce is absorbed by the blood flowing
through the liver and distributed around the rest of
the body.
The hypothalamus (Figure 14.3) in the brain is the
central control for body temperature; it is the body’s
thermostat. This region of the brain receives a constant
input of sensory information about the temperature of the
blood and about the temperature of the surroundings. The
hypothalamus has thermoreceptor cells that continually
monitor the temperature of the blood flowing through it.
The temperature it monitors is the core temperature – the
temperature inside the body that remains very close to
the set point, which is 37 °C in humans. This temperature
fluctuates a little, but is kept within very narrow limits by
the hypothalamus.
In the cold
central thermoreceptors in
the hypothalamus and
spinal cord detect increase
in blood temperature
central thermoreceptors in
the hypothalamus and
spinal cord detect decrease
in blood temperature
thermoreceptors in the skin,
detect increase in
temperature of
surroundings
thermoreceptors in the skin,
detect decrease in
temperature of surroundings
b
hypothalamus in
the brain – body’s
thermostat
vasodilation – arterioles
in the skin dilate
vasoconstriction – arterioles
in the skin contract
sweat glands secrete
sweat
shivering – skeletal
muscles contract
thyroid gland
increases secretion
of thyroxine into
the blood
hair erector muscles
contract to raise hairs and
increase depth of fur
adrenal glands secrete
adrenaline
increased heat
production by the
liver
Figure 14.3 a A summary diagram to show the central role of the hypothalamus in thermoregulation when it is hot and when it is
cold. The hypothalamus communicates with other regions of the body by using nerves (solid lines) and hormones (dashed lines).
b The position of the hypothalamus, shown in red, in the brain.
Chapter 14: Homeostasis
The hypothalamus receives information about
temperature from other sources as well. The skin contains
receptors that monitor changes in skin temperature.
The skin temperature is the first to change if there is a
change in the temperature of the surroundings. These skin
receptors give an ‘early warning’ about a possible change
in core temperature. If the core temperature decreases,
or if the temperature receptors in the skin detect a
decrease in the temperature of the surroundings, the
hypothalamus sends impulses that activate the following
physiological responses.
■■
■■
■■
■■
■■
Vasoconstriction – muscles in the walls of arterioles
that supply blood to capillaries near the skin surface
contract. This narrows the lumens of the arterioles and
reduces the supply of blood to the capillaries so that
less heat is lost from the blood.
Shivering – the involuntary contraction of skeletal
muscles generates heat which is absorbed by the blood
and carried around the rest of the body.
Raising body hairs – muscles at the base of hairs in the
skin contract to increase the depth of fur so trapping
air close to the skin. Air is a poor conductor of heat
and therefore a good insulator. This is not much use in
humans, but is highly effective for most mammals.
Decreasing the production of sweat – this reduces the
loss of heat by evaporation from the skin surface.
Increasing the secretion of adrenaline – this hormone
from the adrenal gland increases the rate of heat
production in the liver.
The hypothalamus also stimulates higher centres in the
brain to bring about some behavioural responses. Some
animals respond by curling up to reduce the surface area
exposed to the air and by huddling together. We respond
by finding a source of warmth and putting on
warm clothing.
When an increase in environmental temperature is
detected by skin receptors or the central thermoreceptors,
the hypothalamus increases the loss of heat from the body
and reduces heat production.
■■
■■
■■
Vasodilation – the muscles in the arterioles in the
skin relax, allowing more blood to flow through the
capillaries so that heat is lost to the surroundings.
Lowering body hairs – muscles attached to the hairs
relax so they lie flat, reducing the depth of fur and the
layer of insulation.
Increasing sweat production – sweat glands increase
the production of sweat which evaporates on the
surface of the skin so removing heat from the body.
The behavioural responses of animals to heat include
resting or lying down with the limbs spread out to
increase the body surface exposed to the air. We respond
by wearing loose fitting clothing, turning on fans or air
conditioning and taking cold drinks.
When the environmental temperature decreases
gradually, as it does with the approach of winter in
temperate climates, the hypothalamus releases a hormone
which activates the anterior pituitary gland (page 312)
to release thyroid stimulating hormone (TSH). TSH
stimulates the thyroid gland to secrete the hormone
thyroxine into the blood. Thyroxine increases metabolic
rate, which increases heat production especially in the
liver. When temperatures start to increase again, the
hypothalamus responds by reducing the release of TSH by
the anterior pituitary gland so less thyroxine is released
from the thyroid gland.
There are two other examples of the role of
negative feedback in homeostasis later in this chapter:
osmoregulation and blood glucose control. Sometimes
control mechanisms do not respond in the way described
so far. If a person breathes air that has very high carbon
dioxide content, this produces a high concentration of
carbon dioxide in the blood. This is sensed by carbon
dioxide receptors, which cause the breathing rate to
increase. So the person breathes faster, taking in even
more carbon dioxide, which stimulates the receptors even
more, so the person breathes faster and faster. This is an
example of a positive feedback. You can see that positive
feedback cannot play any role in keeping conditions in
the body constant! However, this method of control is
involved in several biological processes including the
transmission of nerve impulses (page 335)
QUESTION
14.2 Use Figure 14.2 on page 301 to make a flow diagram
to show the negative feedback loop that keeps
temperature constant in a mammal. Your diagram
should include the names of the receptors and
effectors, and the actions that the effectors take.
303
Cambridge International A Level Biology
Excretion
Many of the metabolic reactions occurring within the
body produce unwanted substances. Some of these are
toxic (poisonous). The removal of these unwanted products
of metabolism is known as excretion.
Many excretory products are formed in humans, but
two are made in much greater quantities than others.
These are carbon dioxide and urea. Carbon dioxide
is produced continuously by cells that are respiring
aerobically. The waste carbon dioxide is transported
from the respiring cells to the lungs, in the bloodstream
(page 170). Gas exchange occurs within the lungs, and
carbon dioxide diffuses from the blood into the alveoli; it is
then excreted in the air we breathe out.
Urea is produced in the liver. It is produced from
excess amino acids and is transported from the liver to the
kidneys, in solution in blood plasma. The kidneys remove
urea from the blood and excrete it, dissolved in water, as
urine. Here, we will look more fully at the production and
excretion of urea.
Deamination
304
If more protein is eaten than is needed, the excess cannot
be stored in the body. It would be wasteful, however,
simply to get rid of all the excess, because the amino acids
provide useful energy. To make use of this energy, the liver
removes the amino groups in a process known
as deamination.
Figure 14.4a shows how deamination takes place. In
the liver cells, the amino group (−NH2) of an amino acid
is removed, together with an extra hydrogen atom. These
combine to produce ammonia (NH3). The keto acid that
remains may enter the Krebs cycle and be respired, or it
may be converted to glucose, or converted to glycogen or
fat for storage.
a
R
NH2
C
R
COOH
H
amino acid
–2H + H2O
C
O
NH3
b
2NH3 + CO2
CO(NH2)2 + H2O
urea
Figure 14.4 a Deamination and b urea formation.
Ammonia is a very soluble and highly toxic compound.
In many aquatic animals, such as fish that live in fresh
water, ammonia diffuses from the blood and dissolves
in the water around the animal. However, in terrestrial
animals, such as humans, ammonia would rapidly build
up in the blood and cause immense damage. Damage is
prevented by converting ammonia immediately to urea,
which is less soluble and less toxic. Several reactions,
known as the urea cycle, are involved in combining
ammonia and carbon dioxide to form urea. These are
simplified as shown in Figure 14.4b. An adult human
produces around 25–30 g of urea per day.
Urea is the main nitrogenous excretory product
of humans. We also produce small quantities of other
nitrogenous excretory products, mainly creatinine and uric
acid. A substance called creatine is made in the liver, from
certain amino acids. Much of this creatine is used in the
muscles, in the form of creatine phosphate, where it acts as
an energy store (Chapter 15). However, some is converted
to creatinine and excreted. Uric acid is made from the
breakdown of purines from nucleotides, not from
amino acids.
Urea diffuses from liver cells into the blood plasma.
All of the urea made each day must be excreted, or
its concentration in the blood would build up and
become dangerous. As the blood passes through the
kidneys, the urea is filtered out and excreted. To explain
how this happens, we must first look at the structure of
a kidney.
QUESTION
14.3 a Name the nitrogenous waste substances excreted
by mammals.
b Explain why it is important that carbon dioxide
and nitrogenous wastes are excreted and not
allowed to accumulate in the body.
keto acid (respired
COOH or converted to
glucose or fat)
ammonia
Chapter 14: Homeostasis
The structure of the kidney
Figure 14.5 shows the position of the kidneys in the body,
together with their associated structures. Each kidney
receives blood from a renal artery, and returns blood via
a renal vein. A narrow tube, called the ureter, carries
urine from the kidney to the bladder. From the bladder a
single tube, the urethra, carries urine to the outside of
the body.
A longitudinal section through a kidney (Figure 14.6)
shows that it has three main areas. The whole kidney is
covered by a fairly tough capsule, beneath which lies the
cortex. The central area is made up of the medulla. Where
the ureter joins, there is an area called the pelvis.
A section through a kidney, seen through a
microscope (Figure 14.7), shows it to be made up of
capsule
cortex
vena cava
aorta
medulla
renal artery
branch of
renal vein
renal vein
kidney
branch of
renal artery
ureter
bladder
pelvis
urethra
ureter
Figure 14.5 Position of the kidneys and associated structures
in the human body.
Figure 14.6 A kidney cut in half vertically.
305
b
a
outer epithelium glomerular capillary
containing red
of Bowman’s
blood cells, and
capsule
podocyte cells
distal
convoluted
tubule
microvilli
proximal
convoluted
tubule
collecting thin section thick section capillary
of the loop of the loop
duct
of Henle
of Henle
c
distal convoluted
tubule
Figure 14.7 a Photomicrograph of a section through the cortex of the kidney showing a glomerulus and Bowman’s capsule
surrounded by proximal and distal convoluted tubules (× 150); b photomicrograph of a section through the medulla of a kidney
(× 300); c interpretive drawings.
ureter
Cambridge International A Level Biology
thousands of tiny tubes, called nephrons, and many
blood vessels. Figure 14.8a shows the position of a single
nephron, and Figure 14.8b shows its structure. One
end of the tube forms a cup-shaped structure called a
Bowman’s capsule, which surrounds a tight network
of capillaries called a glomerulus. The glomeruli and
capsules of all the nephrons are in the cortex of the kidney.
From the capsule, the tube runs towards the centre of the
kidney, first forming a twisted region called the proximal
convoluted tubule, and then a long hairpin loop in the
medulla, the loop of Henle. The tubule then runs back
upwards into the cortex, where it forms another twisted
region called the distal convoluted tubule, before finally
joining a collecting duct that leads down through the
medulla and into the pelvis of the kidney.
Blood vessels are closely associated with the nephrons
(Figure 14.9). Each glomerulus is supplied with blood by
a branch of the renal artery called an afferent arteriole.
The capillaries of the glomerulus rejoin to form an efferent
arteriole. The efferent arteriole leads off to form a network
of capillaries running closely alongside the rest of the
nephron. Blood from these capillaries flows into a branch
of the renal vein.
c
efferent
arteriole
glomerulus
afferent
arteriole
from
renal
artery
to
renal
vein
Figure 14.9 The blood supply associated with a nephron.
306
a
Bowman’s
capsule
b
proximal convoluted
tubule
distal
convoluted
tubule
loop of
Henle
collecting
duct
Bowman’s
capsule
pelvis
distal
convoluted
tubule
efferent
arteriole
afferent
arteriole
cortex
medulla
proximal
convoluted
tubule
from renal
artery
cortex
glomerulus
descending
limb of loop
of Henle
ascending
limb of loop
of Henle
ureter
medulla
collecting
duct
pelvis
Figure 14.8 a Section through the kidney to show the position of a nephron; b a nephron.
c
efferent
arteriole
glomerulus
Chapter 14: Homeostasis
The kidney makes urine in a two-stage process.
The first stage, ultrafiltration, involves filtering small
molecules, including urea, out of the blood and into
the Bowman’s capsule. From the Bowman’s capsule the
molecules flow along the nephron towards the ureter. The
second stage, selective reabsorption, involves taking back
any useful molecules from the fluid in the nephron as it
flows along.
Ultrafiltration
Figure 14.10 shows a section through part of a glomerulus
and Bowman’s capsule. The blood in the glomerular
capillaries is separated from the lumen of the Bowman’s
capsule by two cell layers and a basement membrane.
The first cell layer is the lining, or endothelium, of the
capillary. Like the endothelium of most capillaries, this
has gaps in it, but there are far more gaps than in other
capillaries: each endothelial cell has thousands of tiny
holes in it. Next comes the basement membrane, which
is made up of a network of collagen and glycoproteins.
The second cell layer is formed from epithelial cells,
which make up the inner lining of the Bowman’s
capsule. These cells have many tiny finger-like projections
with gaps in between them, and are called podocytes
(Figure 14.11).
efferent
arteriole
afferent
arteriole
basement
membrane
Bowman’s capsule
epithelium
parts of
podocyte cell
Figure 14.11 A false-colour scanning electron micrograph of
podocytes (× 3900). The podocytes are the blue-green cells with
their extensions wrapped around the blood capillary, which is
purple.
pressure gradient
solute concentration gradient
glomerular
filtrate
red blood cell
blood plasma
circular hole in
basement
capillary endothelium membrane
podocyte cell of
capsule wall
glomerular filtrate in
lumen of capsule
Figure 14.10 Detail of the endothelium of a glomerular capillary and Bowman’s capsule. The arrows show how the net effect of
higher pressure in the capillary and lower solute concentration in the Bowman’s capsule is that fluid moves out of the capillary
and into the lumen of the capsule. The basement membrane acts as a molecular filter.
307
Cambridge International A Level Biology
The holes in the capillary endothelium and the gaps
between the podocytes are quite large, and make it easy for
substances dissolved in the blood plasma to get through
from the blood into the capsule. However, the basement
membrane stops large protein molecules from getting
through. Any protein molecule with a relative molecular
mass of around 69 000 or more cannot pass through the
basement membrane, and so cannot escape from the
glomerular capillaries. This basement membrane therefore
acts as a filter. Blood cells, both red and white, are also
too large to pass through this barrier, and so remain in
the blood. Table 14.1 shows the relative concentrations of
substances in the blood and in the glomerular filtrate. You
will see that glomerular filtrate is identical to blood plasma
except that there are almost no plasma proteins in it.
Substance
water
proteins
308
Concentration
in blood
plasma / g dm−3
900
Concentration
in glomerular
filtrate / g dm3
900
80.0
0.05
amino acids
0.5
0.5
glucose
1.0
1.0
urea
0.3
0.3
uric acid
0.04
0.04
creatinine
0.01
0.01
inorganic ions
(mainly Na+, K+
and Cl−)
7.2
7.2
Table 14.1 Concentrations of substances in the blood and in
the glomerular filtrate.
Factors affecting glomerular filtration rate
The rate at which the fluid filters from the blood in
the glomerular capillaries into the Bowman’s capsule
is called the glomerular filtration rate. In a human,
for all the glomeruli in both kidneys, the rate is about
125 cm3 min−1.
What makes the fluid filter through so quickly? This is
determined by the differences in water potential between
the plasma in glomerular capillaries and the filtrate in the
Bowman’s capsule. You will remember that water moves
from a region of higher water potential to a region of
lower water potential, down a water potential gradient
(page 83). Water potential is lowered by the presence of
solutes, and raised by high pressures.
Inside the capillaries in the glomerulus, the blood
pressure is relatively high, because the diameter of the
afferent arteriole is wider than that of the efferent arteriole,
causing a head of pressure inside the glomerulus. This
tends to raise the water potential of the blood plasma
above the water potential of the contents of the Bowman’s
capsule (Figure 14.9).
However, the concentration of solutes in the blood
plasma in the capillaries is higher than the concentration
of solutes in the filtrate in the Bowman’s capsule. This
is because, while most of the contents of the blood
plasma filter through the basement membrane and into
the capsule, the plasma protein molecules are too big to
get through, and so stay in the blood. This difference in
solute concentration tends to make the water potential in
the blood capillaries lower than that of the filtrate in the
Bowman’s capsule.
Overall, though, the effect of differences in pressure
outweighs the effect of the differences in solute
concentration. Overall, the water potential of the blood
plasma in the glomerulus is higher than the water potential
of the filtrate in the capsule. So water continues to move
down the water potential gradient from the blood into
the capsule.
Reabsorption in the proximal
convoluted tubule
Many of the substances in the glomerular filtrate need to
be kept in the body, so they are reabsorbed into the blood
as the fluid passes along the nephron. As only certain
substances are reabsorbed, the process is called selective
reabsorption.
Most of the reabsorption takes place in the proximal
convoluted tubule. The lining of this part of the nephron
is made of a single layer of cuboidal epithelial cells.
These cells are adapted for their function of reabsorption
by having:
■■
■■
■■
■■
microvilli to increase the surface area of the inner
surface facing the lumen
tight junctions that hold adjacent cells together so that
fluid cannot pass between the cells (all substances that
are reabsorbed must go through the cells)
many mitochondria to provide energy for sodium–
potassium (Na+ –K+) pump proteins in the outer
membranes of the cells
co-transporter proteins in the membrane facing
the lumen.
Chapter 14: Homeostasis
Blood capillaries are very close to the outer surface of the
tubule. The blood in these capillaries has come directly
from the glomerulus, so it has much less plasma in it than
usual and has lost much of its water and many of the ions
and other small solutes.
The basal membranes of the cells lining the proximal
convoluted tubule are those nearest the blood capillaries.
Sodium–potassium pumps in these membranes move
sodium ions out of the cells (Figure 14.12). The sodium
ions are carried away in the blood. This lowers the
concentration of sodium ions inside the cell, so that
they passively diffuse into it, down their concentration
gradient, from the fluid in the lumen of the tubule.
However, sodium ions do not diffuse freely through
the membrane: they can only enter through special
co-transporter proteins in the membrane. There are several
different kinds of co-transporter protein, each of which
transports something else, such as a glucose molecule or an
amino acid, at the same time as the sodium ion.
The passive movement of sodium ions into the cell
down their concentration gradient provides the energy
to move glucose molecules, even against a concentration
gradient. This movement of glucose, and of other solutes, is
an example of indirect or secondary active transport, since
the energy (as ATP) is used in the pumping of sodium
Key
active
passive
blood
plasma
endothelium
of capillary
ions, not in moving these solutes. Once inside the cell,
glucose diffuses down its concentration gradient, through
a transport protein in the basal membrane, into the blood.
All of the glucose in the glomerular filtrate is
transported out of the proximal convoluted tubule and
into the blood. Normally, no glucose is left in the filtrate,
so no glucose is present in urine. Similarly, amino acids,
vitamins, and many sodium and chloride ions (Cl−) are
reabsorbed in the proximal convoluted tubule.
The removal of these solutes from the filtrate greatly
increases its water potential. The movement of solutes
into the cells and then into the blood decreases the
water potential there, so a water potential gradient exists
between filtrate and blood. Water moves down this
gradient through the cells and into the blood. The water
and reabsorbed solutes are carried away, back into the
circulation.
Surprisingly, quite a lot of urea is reabsorbed too.
Urea is a small molecule which passes easily through cell
membranes. Its concentration in the filtrate is considerably
higher than that in the capillaries, so it diffuses passively
through the cells of the proximal convoluted tubule and
into the blood. About half of the urea in the filtrate is
reabsorbed in this way.
basement
membrance
proximal convoluted
tubule cell
proximal
tubule lumen
mitochondria
nucleus
Na+
ADP +
Pi
ATP
K+
glucose
and amino acids
1 Na+–K+ pumps in the basal
membrane of proximal convoluted tubule
cells use ATP made by the mitochondria.
These pumps decrease the concentration of
sodium ions in the cytoplasm. The basal
membrane is folded to give a large surface
area for many of these carrier proteins.
2 Very close nearby, the blood
3
plasma rapidly removes absorbed
Na+, Cl–, glucose and amino
acids. This helps further uptake
from the lumen of the tubule.
Figure 14.12 Reabsorption in the proximal convoluted tubule.
Na+
glucose
and
amino
acids
Microvilli increase surface area, helping
uptake of solutes. Na+ moves passively
into the cell down its concentration
gradient. It moves in using protein
co-transporter molecules in the membrane,
which bring in glucose and amino acids
at the same time.
309
Cambridge International A Level Biology
The other two nitrogenous excretory products, uric
acid and creatinine, are not reabsorbed. Indeed, creatinine
is actively secreted by the cells of the proximal convoluted
tubule into its lumen.
The reabsorption of so much water and solutes from
the filtrate in the proximal convoluted tubule greatly
reduces the volume of liquid remaining. In an adult
human, around 125 cm3 of fluid enter the proximal tubules
every minute, but only about 64% of this passes on to the
next region of each nephron, the loop of Henle.
QUESTIONS
310
14.4 a Where has the blood in the capillaries surrounding
the proximal convoluted tubule come from?
b What solutes will this blood contain that are not
present in the glomerular filtrate?
c How might this help in the reabsorption of water
from the proximal convoluted tubule?
d State the name of the process by which water is
reabsorbed.
14.5 a Calculate the volume of filtrate that enters the
loops of Henle from the proximal convoluted
tubules each minute.
b Although almost half of the urea in the glomerular
filtrate is reabsorbed from the proximal convoluted
tubule, the concentration of urea in the fluid
in the nephron actually increases as it passes
along the proximal convoluted tubule. Explain why
this is so.
c Explain how each of these features of the cells
in the proximal convoluted tubules adapts them
for the reabsorption of solutes:
imicrovilli
ii many mitochondria
iii folded basal membranes.
Reabsorption in the loop of
Henle and collecting duct
About one-third of our nephrons have long loops of
Henle. These dip down into the medulla. The function
of these long loops is to create a very high concentration
of sodium and chloride ions in the tissue fluid in the
medulla. As you will see, this enables a lot of water to be
reabsorbed from the fluid in the collecting duct, as it flows
through the medulla. This allows the production of very
concentrated urine, which means that water is conserved
in the body, rather than lost in urine, helping to prevent
dehydration.
Figure 14.13a shows the loop of Henle. The hairpin
loop runs deep into the medulla of the kidney,
before turning back towards the cortex again. The
first part of the loop is the descending limb, and the
second part is the ascending limb. These differ in their
permeabilities to water. The descending limb is permeable
to water, whereas the ascending limb is not.
To explain how the loop of Henle works, it is best to
start by describing what happens in the ascending limb.
The cells that line this region of the loop actively transport
sodium and chloride ions out of the fluid in the loop, into
the tissue fluid. This decreases the water potential in the
tissue fluid and increases the water potential of the fluid
inside the ascending limb.
The cells lining the descending limb are permeable
to water and also to sodium and chloride ions. As
the fluid flows down this loop, water from the filtrate
moves down a water potential gradient into the tissue
fluid by osmosis. At the same time, sodium and chloride
ions diffuse into the loop, down their concentration
gradient. So, by the time the fluid has reached the very
bottom of the hairpin, it contains much less water and
many more sodium and chloride ions than it did when
it entered from the proximal convoluted tubule. The
fluid becomes more concentrated towards the bottom
of the loop. The longer the loop, the more concentrated
the fluid can become. The concentration in human kidneys
can be as much as four times the concentration of
blood plasma.
This concentrated fluid flows up the ascending limb. As
the fluid inside the loop is so concentrated, it is relatively
easy for sodium and chloride ions to leave it and pass
into the tissue fluid, even though the concentration in
the tissue fluid is also very great. Thus, especially high
concentrations of sodium and chloride ions can be built up
in the tissue fluid between the two limbs near the bottom
of the loop. As the fluid continues up the ascending limb,
losing sodium and chloride ions all the time, it becomes
gradually less concentrated. However, it is still relatively
easy for sodium ions and chloride ions to be actively
removed, because these higher parts of the ascending
loop are next to less concentrated regions of tissue fluid.
All the way up, the concentration of sodium and chloride
ions inside the tubule is never very different from the
concentration in the tissue fluid, so it is never too difficult
to pump sodium and chloride ions out of the tubule into
the tissue fluid.