Method in biological oxidative stress
Bạn đang xem bản rút gọn của tài liệu. Xem và tải ngay bản đầy đủ của tài liệu tại đây (1.45 MB, 212 trang )
Methods in Biological Oxidative Stress
METHODS IN PHARMACOLOGY AND TOXICOLOGY
Mannfred A. Hollinger, PhD SERIES EDITOR
Methods in Biological Oxidative Stress
edited by Kenneth Hensley and Robert A. Floyd, 2003
Apoptosis Methods in Pharmacology and Toxicology: Approaches to
Measurement and Quantification
edited by Myrtle A. Davis, 2002
Ion Channel Localization: Methods and Protocols
edited by Anatoli N. Lopatin and Colin G. Nichols, 2001
METHODS IN PHARMACOLOGY AND TOXICOLOGY
Methods in Biological
Oxidative Stress
Edited by
Kenneth Hensley
Robert A. Floyd
Free Radical Biology and Aging Research Program
Oklahoma Medical Research Foundation
Oklahoma City, OK
Humana Press
Totowa, New Jersey
© 2003 Humana Press Inc.
999 Riverview Drive, Suite 208
Totowa, NJ 07512
www.humanapress.com
All rights reserved. No part of this book may be reproduced, stored in a retrieval system, or transmitted
in any form or by any means, electronic, mechanical, photocopying, microfilming, recording, or otherwise without written permission from the Publisher.
The content and opinions expressed in this book are the sole work of the authors and editors, who have
warranted due diligence in the creation and issuance of their work. The publisher, editors, and authors
are not responsible for errors or omissions or for any consequences arising from the information or
opinions presented in this book and make no warranty, express or implied, with respect to its contents.
Cover design by Patricia F. Cleary.
For additional copies, pricing for bulk purchases, and/or information about other Humana titles, contact
Humana at the above address or at any of the following numbers: Tel.: 973-256-1699; Fax: 973-2568341; E-mail: or visit our website:
This publication is printed on acid-free paper. ∞
ANSI Z39.48-1984 (American National Standards Institute) Permanence of Paper for Printed Library
Materials.
Photocopy Authorization Policy:
Authorization to photocopy items for internal or personal use, or the internal or personal use of specific
clients, is granted by Humana Press Inc., provided that the base fee of US $20.00 per copy is paid directly
to the Copyright Clearance Center at 222 Rosewood Drive, Danvers, MA 01923. For those organizations
that have been granted a photocopy license from the CCC, a separate system of payment has been
arranged and is acceptable to Humana Press Inc. The fee code for users of the Transactional Reporting
Service is: [0-89603-815-7/03 $20.00].
Printed in the United States of America. 10 9 8 7 6 5 4 3 2 1
Library of Congress Cataloging-in-Publication Data
Methods in biological oxidative stress / edited by Kenneth Hensley, Robert A. Floyd.
p. cm.
Includes bibliographical references and index.
ISBN 0-89603-815-7 (alk. paper); E-ISBN 1-59259-424-7
1 . Active oxygen in the body--Laboratory manuals. 2. Oxidation, Physiological--Laboratory
manuals. 3. Stress (Physiology)--Laboratory manuals. I. Hensley, Kenneth. II. Floyd, Robert A.,
1940RB170 .M48 2003
616.07--dc21
2002033397
Foreword
Oxidative damage appears to play a central role in the development of
a wide range of tissue pathology, including neurodegenerative disease, drug
side-effects, xenobiotic toxicity, carcinogenesis, and the aging process,
to name just a few.
Because of the centrality of oxidative processes to normal and abnormal
tissue function, it has become imperative to develop appropriate analytical
techniques to facilitate the quantitation of significant reactants. Without
advances in methodology, corresponding advances in our knowledge of
underlying biochemical events will be necessarily limited.
Drs. Hensley and Floyd have done an outstanding job of assembling the
work of world-class experts into Methods in Biological Oxidative Stress.
The contributors have presented concise, yet thorough, descriptions of the
state-of-the-art methods that any investigator working in the field needs to
access.
Mannfred A. Hollinger
v
Preface
Free radicals and reactive oxidizing agents were once ignored as
biochemical entities not worth close scrutiny, but are now recognized as
causes or contributing factors in dozens, if not hundreds, of disease states. In
addition, free radical metabolisms of xenobiotics have become increasingly
important to pharmacologists. Accordingly, the need has arisen to accurately
quantify reactive oxygen species and their byproducts.
Methods in Biological Oxidative Stress is practical in scope, providing
the details of up-to-date techniques for measuring oxidative stress and
detecting oxidizing agents both in vitro and in vivo. The contributors are
recognized experts in the field of oxidative stress who have developed novel
strategies for studying biological oxidations.
The chapters of Methods in Biological Oxidative Stress cover widely used
standard laboratory techniques, often developed by the authors, as well as
HPLC–electrochemical measurement of protein oxidation products, particularly
nitrotyrosine and dityrosine, and HPLC–electrochemical detection of DNA
oxidation products. Additionally, recently developed techniques are
presented to measure lipid oxidation and nitration products such as 5-NO2γ-tocopherol and isoprostanes, using HPLC-electrochemical/photodiode
array methods and mass spectrometry as well as electron paramagnetic
resonance (EPR) techniques.
In scope, presentation, and authority therefore, Methods in Biological
Oxidative Stress was designed to be an invaluable manual for clinical
laboratories and teaching institutions now conducting routine measurements
of biological oxidants and biological oxidative stress or implementing new
programs in this vital area of research. As a reference work, this collection
of techniques and methods will prove useful for many years to come.
Kenneth Hensley
Robert A. Floyd
vii
Contents
Foreword ............................................................................................. v
Preface .............................................................................................. vii
Contributors ................................................................................... xiii
PART I LIPIDS
1 Measurement of Fat-Soluble Vitamins and Antioxidants
by HPLC With Electrochemical Array Detection
Paul H. Gamache, Paul A. Ullucci, Joe A. Archangelo,
and Ian N. Acworth ...................................................................... 3
2 Analysis of Aldehydic Markers of Lipid Peroxidation in
Biological Tissues by HPLC With Fluorescence Detection
Mark A. Lovell and William R. Markesbery ............................. 17
3 Measurement of Isofurans by Gas Chromatography–
Mass Spectrometry/Negative Ion Chemical Ionization
Joshua P. Fessel and L. Jackson Roberts, II ............................... 23
4 Analysis of F2-Isoprostanes by Gas Chromatography–Mass
Spectrometry/Negative Ion Chemical Ionization
L. Jackson Roberts, II and Jason D. Morrow............................. 33
5 Measurement of F4-Neuroprostanes by Gas Chromatography–
Mass Spectrometry/Negative Ion Chemical Ionization
Nathalie Bernoud-Hubac and L. Jackson Roberts, II .............. 41
6 Immunoassays for Lipid Peroxidation End Products:
One-Hour ELISA for Protein-Bound Acrolein and HNE
Kimihiko Satoh and Koji Uchida ................................................ 49
7 Fluorometric and Colorimetric Assessment of Thiobarbituric
Acid-Reactive Lipid Aldehydes in Biological Matrices
Kelly S. Williamson, Kenneth Hensley, and Robert A. Floyd .... 57
8 HPLC With Electrochemical and Photodiode Array
Detection Analysis of Tocopherol Oxidation
and Nitration Products in Human Plasma
Kelly S. Williamson, Kenneth Hensley, and Robert A. Floyd .... 67
ix
x
Contents
PART II DNA, PROTEIN, AND AMINO ACIDS
9 Electron Paramagnetic Resonance Spin-Labeling Analysis
of Synaptosomal Membrane Protein Oxidation
D. Allan Butterfield ........................................................................ 79
10 Gas Chromatography–Mass Spectrometric Analysis
of Free 3-Chlorotyrosine, 3-Bromotyrosine, Ortho-Tyrosine,
and 3-Nitrotyrosine in Biological Fluids
Joseph P. Gaut, Jaeman Byun, and Jay W. Heinecke ............... 87
11 Isotope Dilution Gas Chromatography–Mass Spectrometric
Analysis of Tyrosine Oxidation Products in Proteins
and Tissues
Jay W. Heinecke ............................................................................... 93
12 Single-Cell Gel Electrophoresis or Comet Assay of Intestinal
Epithelial Cells Using Manual Scoring and Ridit Analysis
Mark M. Huycke ............................................................................ 101
13 Detection of Aldehydic DNA Lesions Using Aldehyde
Reactive Probe
Jun Nakamura and James A. Swenberg .................................... 109
14 Analysis of Neuroketal Protein Adducts by Liquid
Chromatography–Electrospray Ionization/Tandem
Mass Spectrometry
Nathalie Bernoud-Hubac, Sean S. Davies, Olivier Boutaud,
and L. Jackson Roberts, II......................................................... 117
15 Measurement of Isoketal Protein Adducts by Liquid
Chromatography–Electrospray Ionization/Tandem Mass
Spectrometry
Sean S. Davies, Cynthia J. Brame, Olivier Boutaud,
Nathalie Bernoud-Hubac, and L. Jackson Roberts, II ....... 127
16 Bioassay of 2Ј-Deoxyguanosine/8-Hydroxy-2ЈDeoxyguanosine by HPLC With Electrochemical/
Photodiode Array Detection
Kelly S. Williamson, Kenneth Hensley, Quentin N. Pye,
Scott Ferrell, and Robert A. Floyd ......................................... 137
17 HPLC With Electrochemical Detection Analysis
of 3-Nitrotyrosine in Human Plasma
Kelly S. Williamson, Kenneth Hensley, and Robert A. Floyd ... 151
Contents
xi
PART III REACTIVE OXYGEN SPECIES AND REACTIVE NITROGEN SPECIES
18 Protein Carbonyl Levels—An Assessment
of Protein Oxidation
Alessandra Castegna, Jennifer Drake, Chava Pocernich,
and D. Allan Butterfield .......................................................... 161
19 Fluorogenic Analysis of H2O2 in Biological Materials
Kenneth Hensley, Kelly S. Williamson, and Robert A. Floyd ... 169
20 Detection of Reactive Oxygen Species by Flow Cytometry
Alexander Christov, Ladan Hamdheydari,
and Paula Grammas ............................................................... 175
21 Nitrite Determination by Colorimetric and Fluorometric
Greiss Diazotization Assays:
Simple, Reliable, High-Throughput Indices
of Reactive Nitrogen Species in Cell Culture Systems
Kenneth Hensley, Shenyun Mou, and Quentin N. Pye ........... 185
22 Protein Carbonyl Determination Using Biotin Hydrazide
Kenneth Hensley and Kelly S. Williamson .............................. 195
23 Real-Time, In Vivo Measurement of Nitric Oxide
Using Electron Paramagnetic Resonance Spectroscopic
Analysis of Biliary Flow
Kenneth Hensley, Yashige Kotake, Danny R. Moore,
Hong Sang, and Lester A. Reinke ........................................... 201
Index ................................................................................................ 207
xii
Contributors
Contributors
IAN N. ACWORTH • ESA Inc., Chelmsford, MA
JOE A. ARCHANGELO • ESA Inc., Chelmsford, MA
NATHALIE BERNOUD-HUBAC • Departments of Pharmacology
and Medicine, Vanderbilt University, Nashville, TN
OLIVIER BOUTAUD • Departments of Pharmacology and Medicine,
Vanderbilt University, Nashville, TN
CYNTHIA J. BRAME • Departments of Pharmacology and Medicine,
Vanderbilt University, Nashville, TN
D. ALLAN BUTTERFIELD • Sanders-Brown Center on Aging,
Center of Membrane Sciences, Department of Chemistry,
University of Kentucky, Lexington, KY
JAEMAN BYUN • Department of Medicine, Washington University School
of Medicine, St. Louis, MO
ALESSANDRA CASTEGNA • Sanders-Brown Center on Aging, Center
of Membrane Sciences, Department of Chemistry, University
of Kentucky, Lexington, KY
ALEXANDER CHRISTOV • Department of Pathology, University
of Oklahoma Health Sciences Center; Oklahoma Center
for Neuroscience, Oklahoma City, OK
SEAN S. DAVIES • Departments of Pharmacology and Medicine,
Vanderbilt University, Nashville, TN
JENNIFER DRAKE • Sanders-Brown Center on Aging, Center
of Membrane Sciences, Department of Chemistry, University
of Kentucky, Lexington, KY
SCOTT FERRELL • Free Radical Biology and Aging Program, Oklahoma
Medical Research Foundation, Oklahoma City, OK
JOSHUA P. FESSEL • Departments of Pharmacology and Medicine,
Vanderbilt University, Nashville, TN
ROBERT A. FLOYD • Free Radical Biology and Aging Program, Oklahoma
Medical Research Foundation, Oklahoma City, OK
PAUL H. GAMACHE • ESA Inc., Chelmsford, MA
JOSEPH P. GAUT • Department of Medicine, Washington University
School of Medicine, St. Louis, MO
xiii
xiv
Contributors
PAULA GRAMMAS • Department of Pathology, University of Oklahoma
Health Sciences Center; Oklahoma Center for Neuroscience,
Oklahoma City, OK
LADAN HAMDHEYDARI • Department of Pathology, University
of Oklahoma Health Sciences Center; Oklahoma Center
for Neuroscience, Oklahoma City, OK
JAY W. HEINECKE • Department of Medicine, Washington University
School of Medicine, St. Louis, MO
KENNETH HENSLEY • Free Radical Biology and Aging Program,
Oklahoma Medical Research Foundation, Oklahoma City, OK
MARK M. HUYCKE • The Muchmore Laboratories for Infectious Diseases
Research; Research Service, Department of Veterans Affairs Medical
Center; Department of Medicine, University
of Oklahoma Health Sciences Center, Oklahoma City, OK
YASHIGE KOTAKE • Free Radical Biology and Aging Program, Oklahoma
Medical Research Foundation, Oklahoma City, OK
MARK A. LOVELL • Sanders-Brown Center on Aging, Department
of Chemistry, University of Kentucky, Lexington, KY
WILLIAM R. MARKESBERY • Sanders-Brown Center on Aging,
Departments of Pathology and Neurology, University
of Kentucky, Lexington, KY
DANNY R. MOORE • Department of Pharmacology and Toxicology,
College of Pharmacy, University of Oklahoma, Oklahoma City, OK
JASON D. MORROW • Departments of Medicine and Pharmacology,
Vanderbilt University, Nashville, TN
SHENYUN MOU • Free Radical Biology and Aging Research Program,
Oklahoma Medical Research Foundation, Oklahoma City, OK
JUN NAKAMURA • Department of Environmental Sciences and
Engineering, University of North Carolina, Chapel Hill, NC
CHAVA POCERNICH • Sanders-Brown Center on Aging, Center
of Membrane Sciences, Department of Chemistry, University
of Kentucky, Lexington, KY
QUENTIN N. PYE • Free Radical Biology and Aging Program, Oklahoma
Medical Research Foundation, Oklahoma City, OK
LESTER A. REINKE • Department of Pharmacology and Toxicology,
College of Pharmacy, University of Oklahoma, Oklahoma City, OK
L. JACKSON ROBERTS, II • Departments of Pharmacology and Medicine,
Vanderbilt University, Nashville, TN
HONG SANG • Free Radical Biology and Aging Program, Oklahoma
Medical Research Foundation, Oklahoma City, OK
Contributors
xv
KIMIHIKO SATOH • Department of Organic Function, Hirosaki University
School of Health Sciences, Hirosaki, Japan
JAMES A. SWENBERG • Department of Environmental Sciences
and Engineering, University of North Carolina, Chapel Hill, NC
KOJI UCHIDA • Laboratory of Food and Biodynamics, Graduate School
of Bioagricultural Sciences, Nagoya University, Nagoya, Japan
PAUL A. ULLUCCI • ESA Inc., Chelmsford, MA
KELLY S. WILLIAMSON • Free Radical Biology and Aging Program,
Oklahoma Medical Research Foundation, Oklahoma City, OK
FSVAs Measured by HPLC–ECD
1
I
Lipids
FSVAs Measured by HPLC–ECD
3
1
Measurement of Fat-Soluble Vitamins
and Antioxidants by HPLC
With Electrochemical Array Detection
Paul H. Gamache, Paul A. Ullucci, Joe A. Archangelo,
and Ian N. Acworth
1. INTRODUCTION
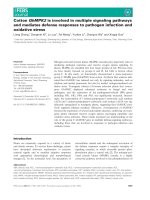
Fat-soluble vitamins and antioxidants (FSVAs) are a structurally diverse
group of compounds (Fig. 1) that play important roles in a wide spectrum of
biochemical and physiological processes, e.g., photoreception (vitamin A,
retinol); plasma calcium homeostasis (vitamin D2, ergocalciferol; vitamin
D3, cholecalciferol); and blood clotting (vitamin K1, phylloquinone). Of
considerable interest is the involvement of some FSVAs in oxidative
metabolism and the prevention of damage by reactive oxygen species (ROS)
(1,2). For example, _-tocopherol (vitamin E) is the primary antioxidant species
in the membrane. Here it intercepts lipid peroxyl radicals, thereby inhibiting
lipid peroxidation, a self-perpetuating chain reaction, and preventing catastrophic membrane damage. _-Tocopherol is thought to be regenerated from
the resulting _-tocopheryl radical by reaction with reduced coenzyme Q10
(CoQ10) (the ubiquinone/ubiquinol system) also located within the membrane, or with cytosolic ascorbic acid (or glutathione) at the cytoplasm-membrane interface (1,2). Another form of vitamin E, a-tocopherol, readily reacts
with reactive nitrogen species (RNS) such as peroxynitrite to form 5-nitroa-tocopherol, a marker of RNS production (3).
Tissue levels of FSVAs can be measured following HPLC separation by
a variety of detectors either alone (e.g., ultraviolet [UV], photodiode array
[PDA], fluorescence) or in combination (absorbance-fluorescence, absorbance-electrochemical, electrochemical-fluorescence) (4,5). ElectrochemiFrom: Methods in Pharmacology and Toxicology: Methods in Biological Oxidative Stress
Edited by: K. Hensley and R. A. Floyd © Humana Press Inc., Totowa, NJ
3
4
Gamache et al.
4
FSVAs Measured by HPLC–ECD
5
cal detection (ECD) is typically chosen for its enhanced selectivity and sensitivity, especially when trying to measure low levels of analytes (e.g., K1,
CoQ10) in low volume-low level samples (e.g., fasting or neonatal plasma).
Single- and dual-channel ECDs are typically used at settings that are suitable for only a few analytes at the expense of others’ whereas multi-component analyses are limited by the poor compatibility of thin-layer
amperometric electrodes with gradient elution chromatography (6).
An alternate electrochemical approach uses a serial array of highly efficient (coulometric) flow-through graphite working electrodes maintained at
different but constant potentials, each optimal for a given analyte or class of
analytes (the CoulArray® - ESA Inc.) (7,8). When combined with gradient
HPLC, a three-dimensional chromatogram is generated that identifies an
analyte by both retention time and electrochemical (hydrodynamic
voltammetric) behavior. The latter, like a photodiode array spectrum, can be
used to verify analyte authenticity or to identify co-eluting or misnamed
analytes. This approach is finding great use in the field of oxidative metabolism for the measurement of water- and fat-soluble antioxidants, DNA
adducts, and protein oxidation products (2,3,9–11).
Presented here are three methods using HPLC-coulometric array detection:
1. Method 1: A global method capable of measuring vitamins A, and E as well as
CoQ10, retinoids and carotenoids in plasma and serum.
2. Method 2: A second global method that also includes vitamins D2 and D3 for
the analysis of milk sample.
3. Method 3: A method for the measurement of carotenoid isomers in plasma
and serum.
2. MATERIALS
1. The analytical system for Methods 1 and 2 consisted of a model 5600
CoulArray 8-channel system with two model 582 pumps, a high pressure gradient mixer, a PEEK® pulse dampener, a model 540 autosampler, a CoulArray
thermostatic chamber and a serial array of eight coulometric electrodes (all
from ESA, Inc.) The apparatus for Method 3 was the same as the other methods, but used a single pump.
2. Standards for Methods 1 and 2 were obtained from Sigma Chemical Co. (St.
Louis, MO). Stock standards were made by dissolving approx 10 mg of each
compound in 10 mL of ethanol (EtOH) with the exception of the carotenoids
and Q10. For these more lipophilic compounds, ~1.0 mg were dissolved in 5.0
mL of hexane followed by dilution with 15 mL EtOH. Stock solutions were
Fig. 1. The chemical structures of some fat-soluble vitamins and antioxidants.
6
Gamache et al.
then assayed spectrophotometrically and assigned a concentration value prior
to the addition of 10 mg/L butylated hydroxyanisole (BHA) as a preservative.
Stock solutions were stored at –20°C for up to six mo. Dilutions were made
weekly in EtOH containing 10 mg/L BHA and stored protected from light at
–20°C. Standards for Method 3 were prepared by dissolving ~1 mg/10 mL
chloroform followed by dilution in ethanol. Concentration determination, protection, storage, and dilution are the same as for the other methods.
3. The mobile phases and columns were:
a. Method 1. Phase A: methanol, 0.2 M ammonium acetate, pH 4.4 (90:10 v/v).
Phase B: methanol, propan-1-ol, 1 M ammonium acetate, pH 4.4 (78:20:2
v/v/v). MD 150 C18 (150 ϫ 3 mm; 3 μm particle) (ESA, Inc.).
b. Method 2. Phase A: acetonitrile, water (containing 20 mM sodium perchlorate and 5 mM perchloric acid) (90:10 v/v). Phase B: acetonitrile, propan1-ol (containing 20 mM sodium perchlorate and 10 mM perchloric acid)
(65:35 v/v). Betasil Basic C18 (250 ϫ 4.6 mm; 5 μm) (Keystone).
c. Method 3. Methanol: methyl-tert-butyl ether, 1.0 M ammonium acetate,
pH 4.4 (63:35:2 v/v/v). Carotenoid C30 (250 ϫ 4.5 mm; 5 μm) (ESA, Inc.).
3. METHODS
1. Gradient profiles, flow rate, temperature, and applied potentials:
a. Method 1. Gradient profile, 10 min linear gradient from 0–80% B. A 10-min
linear gradient from 80–100% B. 7 min isocratic 100% B before returning
to initial conditions for 5 min for a total run time of 32 min. The flow rate
was 0.8 mL/min and the temperature – +37°C. The applied potentials were
+200, +400, +500, +700, +800, –1000, –1000, and +500 mV (vs palladium
reference).
b. Method 2. Gradient profile, 20 min linear gradient from 10–100%B followed by a 5 min hold at 100% B before returning to initial conditions for
5 min. The total run time was 30 min. The flow rate was 1.5 mL/min and
the temperature was 32°C. The applied potentials were –700 mV, +100,
+250, +400, +550, +800 and +850mV.
c. Method 3. The assay was isocratic with a flow rate of 1.0 mL/min. The
temperature was 28°C and the applied potentials were +100, +160, +220,
+280, +340, +400, +460, and +520 mV.
2. Sample preparation.
a. Method 1. Reference sera were obtained from the National Institute of Standards and Technology (NIST, Gaithersburg, MD). A 0.2 mL volume of
serum (or plasma) or standard mixture was vortexed (1 min) with 0.2 mL
diluent and 10 μL of 10 μg/mL retinyl acetate as internal standard; 1.0 mL
of hexane was added and the resulting mixture was vortexed (10 min) and
centrifuged (4000g, 10 min). Supernatant (0.8 mL) was withdrawn and the
sample was re-extracted, as above, with an additional 1.0mL of hexane.
Combined extracts were evaporated under nitrogen, the residue was dissolved in 0.2mL diluent.
FSVAs Measured by HPLC–ECD
7
b. Method 2. Milk samples (unsaponified): A 1.0 mL volume, augmented
with 10 μL of 1.0 μg/mL D2 (internal standard), was thoroughly mixed
with 3.0 mL diluent and 0.1 g magnesium sulfate. The resulting mixture
was extracted two times with 4.0 mL hexane. Combined hexane extracts
were evaporated under a stream of nitrogen and residue was dissolved in
1.0 mL of diluent. The solution was centrifuged as in Method 1. Milk
samples (saponified): a 1.0 mL volume of milk was mixed with 1.75 mL
85% aqueous EtOH containing 75 mg/mL potassium hydroxide and 0.25
mg/mL ascorbic acid. The sample was then placed in a heated water bath
for 45 min at 95°C. Saponified samples were then extracted as for
unsaponified milk samples.
c. Method 3. A 0.5 mL volume of serum or standard was mixed with 0.5 mL
ethanol/10 mg/L BHA. After mixing for 1 min, 1.5 mL of hexane was added
and after mixing for an additional 10 min was centrifuged (4,000g, 10 min).
Approx 1.0 mL of supernatant was withdrawn and the remaining sample
extracted with an additional 1.5 mL of hexane. Combined hexane extracts
were evaporated to dryness under a stream of nitrogen. Finally, the residue
was dissolved in 0.25 mL of mobile phase.
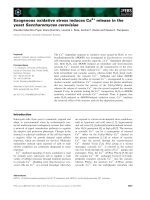
4. RESULTS AND DISCUSSION
The global method (Method 1) combines the resolution of gradient HPLC
with coulometric array detection to separate and identify FSVAs in under 30
min [Fig. 2A, 2B; extracted standards and a typical NIST (National Institute
Science and Technology) control human serum, respectively]. The RNS
marker, 5-nitro-a-tocopherol, eluted at 31 min (data not shown) (see ref. 3).
The tocopherols were the most easily oxidized and were measured on channel 1 (200 mV) of the array. The carotenoids responded on channel 2 (400
mV) while the retinoids were the highest oxidizing compounds and reacted
mainly on channel 4 (700 mV). Vitamin K1 (not shown) and CoQ10 only
responded after their reduction at –1000 mV on channel 6 followed by facile
oxidation at +200 mV on channel 7.
The assay had a sensitivity in the low picogram range (e.g., retinol [alltrans], _-tocopherol, and CoQ10 were 3.8, 5.1, and 7.5 pg on column,
respectively) and was linear from 0–10 μg/mL. Ratio accuracies, indicators
of analyte authenticity, were >0.850 (6,7). The levels of analytes determined
by this method correlated well with NIST published values (Table 1).
The chromatography and electrochemical array conditions used in
Method 2 were optimized for a wide range of FSVAs, including vitamins
D2 and D3 (Fig. 3). The first electrode in the array was set to –700 mV to
reduce vitamin K1 and CoQ10, these were then measured oxidatively on
sensors 2 and 3, respectively.
Fig. 2. Gradient HPLC–coulometric array chromatograms of (A) extracted standards and (B) NIST control plasma sample.
Signal from the reduction channels (6 and 7) is not included.
8
Gamache et al.
8
FSVAs Measured by HPLC–ECD
9
9
10
aNote:
ESA
262
606
96
214
582
118
12,730
112
2200
NIST
11,222 ± 3900
606
11,107 ± 3000
11,183 ± 3400
11,599 ± 3400
11,118 ± 2100
11,900 ± 1090
11,115 ± 6400
1,2340 ± 2400
NIST
Example 2
11,300 ± 3200
816
11,210 ± 3300
11,228 ± 4400
11,690 ± 7100
11,114 ± 3700
18,560 ± 1830
11,177 ± 9500
1,1120 ± 1300
For Q10, only three labs reported data. Data from refs. (14–16).
trans-`-Carotene
Coenzyme Q10*
Lutein
trans Lycopene
trans-Retinol
Retinyl Palmitate
_-Tocopherol
b-Tocopherol
a-Tocopherol
Vitamin/Antioxidant
Example 1
346
816
194
228
742
110
20,140
70
1010
ESA
Table 1
Fat-Soluble Vitamin Performance Data in μg/L (from NIST Round Robin XLVII)
11,208 ± 2700
550
11,100 ± 1800
11,169 ± 1900
11,558 ± 5500
11,121 ± 2900
11,150 ± 1000
11,170 ± 8600
1,2180 ± 3200
NIST
Example 3
216
484
91
179
547
95
11,810
63
2040
ESA
10
Gamache et al.
Fig. 3. Gradient HPLC–coulometric array chromatogram of a standard mixture (A) and an unsaponified
fortified low-fat milk sample (B).
FSVAs Measured by HPLC–ECD
11
11
12
Gamache et al.
12
Fig. 4. Isocratic HPLC–coulometric array chromatogram of a low-level human serum sample. We are grateful to Drs. S.
Schwartz, M. Ferruzzi, and M. Nguyen (Dept. Food Science and Technology, Ohio State University) for their collaboration
in this study.
FSVAs Measured by HPLC–ECD
13
13