Analysis of acoustic emission data for accurate damage assessment for structural health monitoring applications
Bạn đang xem bản rút gọn của tài liệu. Xem và tải ngay bản đầy đủ của tài liệu tại đây (4.1 MB, 200 trang )
ANALYSIS OF ACOUSTIC EMISSION DATA
FOR ACCURATE DAMAGE ASSESSMENT
FOR STRUCTURAL HEALTH MONITORING
APPLICATIONS
Manindra Kaphle
M. Sc., B.E. (First Class Hons.)
Submitted in fulfilment of the requirements for the degree of
Doctor of Philosophy
School of Chemistry, Physics and Mechanical Engineering
Science and Engineering Faculty
Queensland University of Technology
2012
i
Keywords
Acoustic emission
Structural health monitoring
Crack growth
Sensors
Stress waves
Source localization
Short time Fourier transform
Source differentiation
Cross-correlation
Magnitude squared coherence
Damage quantification
Improved b-value analysis
Analysis of acoustic emission data for accurate damage assessment for structural health monitoring applicationsi
ii
Abstract
Structural health monitoring (SHM) refers to the procedure used to assess the
condition of structures so that their performance can be monitored and any damage
can be detected early. Early detection of damage and appropriate retrofitting will aid
in preventing failure of the structure and save money spent on maintenance or
replacement and ensure the structure operates safely and efficiently during its whole
intended life. Though visual inspection and other techniques such as vibration based
ones are available for SHM of structures such as bridges, the use of acoustic emission
(AE) technique is an attractive option and is increasing in use. AE waves are high
frequency stress waves generated by rapid release of energy from localised sources
within a material, such as crack initiation and growth. AE technique involves
recording these waves by means of sensors attached on the surface and then analysing
the signals to extract information about the nature of the source. High sensitivity to
crack growth, ability to locate source, passive nature (no need to supply energy from
outside, but energy from damage source itself is utilised) and possibility to perform
real time monitoring (detecting crack as it occurs or grows) are some of the attractive
features of AE technique.
In spite of these advantages, challenges still exist in using AE technique for
monitoring applications, especially in the area of analysis of recorded AE data, as
large volumes of data are usually generated during monitoring. The need for effective
data analysis can be linked with three main aims of monitoring: (a) accurately
locating the source of damage; (b) identifying and discriminating signals from
different sources of acoustic emission and (c) quantifying the level of damage of AE
source for severity assessment.
In AE technique, the location of the emission source is usually calculated using
the times of arrival and velocities of the AE signals recorded by a number of sensors.
But complications arise as AE waves can travel in a structure in a number of different
modes that have different velocities and frequencies. Hence, to accurately locate a
source it is necessary to identify the modes recorded by the sensors. This study has
proposed and tested the use of time-frequency analysis tools such as short time
iiAnalysis of acoustic emission data for accurate damage assessment for structural health monitoring applications
iii
Fourier transform to identify the modes and the use of the velocities of these modes
to achieve very accurate results. Further, this study has explored the possibility of
reducing the number of sensors needed for data capture by using the velocities of
modes captured by a single sensor for source localization.
A major problem in practical use of AE technique is the presence of sources of
AE other than crack related, such as rubbing and impacts between different
components of a structure. These spurious AE signals often mask the signals from
the crack activity; hence discrimination of signals to identify the sources is very
important. This work developed a model that uses different signal processing tools
such as cross-correlation, magnitude squared coherence and energy distribution in
different frequency bands as well as modal analysis (comparing amplitudes of
identified modes) for accurately differentiating signals from different simulated AE
sources.
Quantification tools to assess the severity of the damage sources are highly
desirable in practical applications. Though different damage quantification methods
have been proposed in AE technique, not all have achieved universal approval or
have been approved as suitable for all situations. The b-value analysis, which
involves the study of distribution of amplitudes of AE signals, and its modified form
(known as improved b-value analysis), was investigated for suitability for damage
quantification purposes in ductile materials such as steel. This was found to give
encouraging results for analysis of data from laboratory, thereby extending the
possibility of its use for real life structures.
By addressing these primary issues, it is believed that this thesis has helped
improve the effectiveness of AE technique for structural health monitoring of civil
infrastructures such as bridges.
Analysis of acoustic emission data for accurate damage assessment for structural health monitoring applicationsiii
iv
Table of Contents
Keywords ................................................................................................................................................. i
Abstract ...................................................................................................................................................ii
Table of Contents ................................................................................................................................... iv
List of Figures .......................................................................................................................................vii
List of Tables ........................................................................................................................................xii
List of Abbreviations............................................................................................................................xiii
Statement of Original Authorship......................................................................................................... xiv
Acknowledgments ................................................................................................................................. xv
CHAPTER 1: INTRODUCTION ....................................................................................................... 1
1.1
Background .................................................................................................................................. 1
1.2
Objectives of the research ............................................................................................................ 3
1.3
Scope of the research ................................................................................................................... 5
1.4
Originality and Significance of the research ................................................................................ 6
1.5
Thesis outline ............................................................................................................................... 9
CHAPTER 2: BACKGROUND AND LITERATURE REVIEW .................................................. 11
2.1
Structural Health Monitoring ..................................................................................................... 11
2.1.1 Introduction .................................................................................................................... 11
2.1.2 Methods for structural health monitoring ....................................................................... 12
2.2
Acoustic emission technique ...................................................................................................... 15
2.3
Brief history of the use of AE technology .................................................................................. 19
2.4
AE data analysis approaches ...................................................................................................... 20
2.5
AE wave modes ......................................................................................................................... 24
2.6
Instrumentation for AE monitoring ............................................................................................ 26
2.7
Signal processing tools .............................................................................................................. 31
2.8
AE generation during metal deformation ................................................................................... 31
2.9
Areas of Applications of AE technique ...................................................................................... 34
2.9.1 General Areas of application .......................................................................................... 34
ivAnalysis of acoustic emission data for accurate damage assessment for structural health monitoring applications
v
2.9.2 Application for SHM of bridges .....................................................................................35
2.10
Challenges in using acoustic emission technique .......................................................................36
2.10.1 Source localization..........................................................................................................36
2.10.2 Noise removal and source differentiation .......................................................................40
2.10.3 Damage quantification for severity assessment...............................................................43
2.11
Summary ....................................................................................................................................52
CHAPTER 3: ACCURATE LOCALIZATION OF AE SOURCES .............................................. 55
3.1
Plan of study and proposed model .............................................................................................55
3.2
Experimentation .........................................................................................................................56
3.3
Results and discussion................................................................................................................60
3.3.1 Source location results ....................................................................................................60
3.3.2 Modes identification .......................................................................................................63
3.3.3 Frequency analysis ..........................................................................................................66
3.3.4 Investigation of Lamb modes ..........................................................................................69
3.3.5 Use of extensional mode for source location calculations ..............................................71
3.3.6 Source distance by single sensor method ........................................................................73
3.4
Concluding remarks ...................................................................................................................75
CHAPTER 4: SOURCE IDENTIFICATION AND DISCRIMINATION .................................... 79
4.1
Plan of study and proposed model .............................................................................................79
4.2
Experimentation .........................................................................................................................81
4.2.1 Uniqueness analysis for two sources of AE signals ........................................................81
4.2.2 Study of the distance of propagation and sensor characteristics on signal
waveforms.......................................................................................................................83
4.2.3 Modal analysis of in-plane and out-of-plane AE signals ................................................84
4.2.4 Energy distribution in frequency bands for Differentiation of three common types
of AE signals...................................................................................................................85
4.3
Results and discussion................................................................................................................88
4.3.1 Uniqueness analysis for two sources of AE signals ........................................................88
4.3.2 Study of the influence of distance of propagation and sensor characteristics on
signal waveforms ..........................................................................................................101
4.3.3 Modal analysis of in-plane and out-of-plane AE signals ..............................................103
4.3.4 Energy distribution in frequency bands for differentiation of three common types
of AE signals.................................................................................................................107
4.4
Concluding remarks .................................................................................................................111
CHAPTER 5: DAMAGE QUANTIFICATION FOR SEVERITY ASSESSMENT ................... 113
Analysis of acoustic emission data for accurate damage assessment for structural health monitoring applicationsv
vi
5.1
Plan of study and model used................................................................................................... 113
5.2
Experimentation ....................................................................................................................... 114
5.3
Results and discussion ............................................................................................................. 117
5.3.1 Physical and scanning microscopic observations.......................................................... 117
5.3.2 Analysis of load and AE signal parameters .................................................................. 121
5.3.3 b and Ib value analysis .................................................................................................. 125
5.3.4 Comparison with other methods ................................................................................... 131
5.4
Concluding remarks ................................................................................................................. 133
CHAPTER 6: APPLICATION IN SCALE BRIDGE MODEL ................................................... 135
6.1
Introduction.............................................................................................................................. 135
6.2
Results...................................................................................................................................... 137
6.3
Discussions and Conclusion ..................................................................................................... 143
CHAPTER 7: CONCLUSIONS ...................................................................................................... 145
7.1
Conclusions .............................................................................................................................. 145
7.2
Recommendations for future research ...................................................................................... 147
BIBLIOGRAPHY ............................................................................................................................. 149
APPENDICES ................................................................................................................................... 159
Appendix A: Wave equations .................................................................................................. 159
Appendix B: Signal processing tools ....................................................................................... 160
Appendix C: Summary of selected studies on the use of AE technique for SHM of
bridge structures ........................................................................................................... 165
Appendix D: Important Matlab Codes ..................................................................................... 174
viAnalysis of acoustic emission data for accurate damage assessment for structural health monitoring applications
vii
List of Figures
Figure 1-1 Story bridge – an iconic bridge in Brisbane [7] .....................................................................3
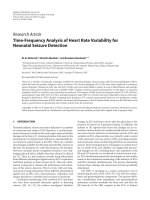
Figure 1-2 Data analysis approach ..........................................................................................................6
Figure 2-1 Acoustic Emission technique ...............................................................................................16
Figure 2-2 Parameters of AE signals [29] .............................................................................................20
Figure 2-3 Energy as measure area under rectified signal envelope [32] ..............................................21
Figure 2-4 Continuous and burst AE signals [36] .................................................................................23
Figure 2-5 (a) Longitudinal and (b) transverse waves [28] ...................................................................25
Figure 2-6 Surface waves [28] ..............................................................................................................25
Figure 2-7 Early arriving symmetric (extensional) mode and later asymmetric (flexural) modes
[38] .......................................................................................................................................26
Figure 2-8 Symmetric and Asymmetric Lamb waves [28] ....................................................................26
Figure 2-9 AE measurement chain [24] .................................................................................................27
Figure 2-10 Different types of sensors [40] ...........................................................................................28
Figure 2-11 AE sensor of the piezoelectric element [41] ......................................................................28
Figure 2-12 Responses of (a) resonant sensor, (b) broadband sensor [40] ............................................30
Figure 2-13 (a) Stress-strain diagram of a typical ductile material; (b) determination of yield
strength by the offset method [51] ........................................................................................32
Figure 2-14 Stress-strain curve in brittle material [52] ..........................................................................32
Figure 2-15 Stress versus strain along with AE energy [54] .................................................................33
Figure 2-16 Stress versus strain along with AE RMS for AISI type 304 stainless steel (a)
annealed and (b) cold worked 10% [55] ...............................................................................34
Figure 2-17 A pressure vessel under test using AE sensors [56] ...........................................................35
Figure 2-18 Linear source location........................................................................................................37
Figure 2-19 Two dimensional source location [60] ...............................................................................38
Figure 2-20 Use of guard sensors ..........................................................................................................41
Figure 2-21 AE classification in terms of intensity (vertical axis) and activity (horizontal axis)
[80] .......................................................................................................................................44
Analysis of acoustic emission data for accurate damage assessment for structural health monitoring applications
vii
viii
Figure 2-22 Typical relationships among the crack safety index, crack growth rate, count rate
and K for bridge steels [θ9] ............................................................................................... 45
Figure 2-23 Assessment chart proposed by NDIS [81] ......................................................................... 46
Figure 2-24 Severity- historic index chart for analysis of concrete bridges [42] ................................... 47
Figure 2-25 Typical intensity chart for metal piping system [85] ......................................................... 48
Figure 2-26 Loading curves of a reinforced concrete beam with corresponding Ib- values [89] .......... 51
Figure 2-27 Changes in Ib-value against uniaxial compressive stress (0–100% failure stress) at
various stages of loading of granite [90] .............................................................................. 52
Figure 3-1 Temporal characteristics of an ASTM E976 standard pencil lead-break source [91].......... 56
Figure 3-2 Experimental specimen for source location experiment ...................................................... 57
Figure 3-3 -disp PAC (Physical Acoustics Corporation) system with four channels PAC .................. 57
Figure 3-4 (a) Preamplifier providing a choice of amplification of 20 dB, 40 dB or 60 dB, (b)
R1η Sensor [92] ................................................................................................................. 58
Figure 3-5 Locations of the sensors (at positions (0,0), (1.2,0) and (0.θ,1.8) m denoted by ‘x’)
and pencil lead break emission sources on the plate (denoted by ‘o’) .................................. 59
Figure 3-6 Pencil lead break apparatus ................................................................................................. 59
Figure 3-7 Source location using (a) longitudinal, (b) transverse wave velocities ................................ 62
Figure 3-8 Initial portions of signals recorded by (a) sensor S1, (b) sensor S2 and (c) sensor S3
for pencil lead break AE source at position (0.3, 0.9) m ...................................................... 65
Figure 3-9 Fourier transforms of the signals recorded by (a) S1, (b) S2 and (c) S3 for source
location at position (0.3, 0.9) m (initial 1000 s length used) .............................................. 67
Figure 3-10 STFT plot (in logarithmic scale) of the signals recorded by (a) S1, (b) S2, (c) S3
for source location at position (0.3, 0.9) m .......................................................................... 68
Figure 3-11 Wavelet plot [94] of the signal recorded by S3 for source location at position (0.3,
0.9) m (Linear scale) ............................................................................................................ 69
Figure 3-12 Dispersion curves for steel plate of thickness 3 mm [94] .................................................. 70
Figure 3-13 Source location using arrival times and velocities of the extensional modes ..................... 72
Figure 3-14 Waveform showing early triggering of threshold .............................................................. 73
Figure 4-1 Experimental set-up for simulation of two sources .............................................................. 82
Figure 4-2 Setup: same sensor to record similar signals at three distances in a rectangular beam
(X- location of AE source, circles – sensor positions) ......................................................... 83
viii
Analysis of acoustic emission data for accurate damage assessment for structural health monitoring
applications
ix
Figure 4-3 Setup: Four sensors to record similar signals in a steel plate (X- location of AE
source, circles – sensor position) ..........................................................................................84
Figure 4-4 (a) Simulation of in-plane (denoted by ‘x’) and out-of plane (denoted by ‘*’)
sources, (b) Dimensions of the C beam ................................................................................85
Figure 4-5 Instron Tensile testing machine used for three point bending ..............................................86
Figure 4-6 Diagrammatic representation of ball drop experiment .........................................................87
Figure 4-7 (a) Diagrammatic representation of experiment setup to simulate signals from
rubbing, (b) Lab jack with adjustable height used adjust height ...........................................88
Figure 4-8 PLB signal (upper) along with its STFT representation (below), ........................................92
Figure 4-9 BD signal (upper) along with its STFT representation (below) ...........................................92
Figure 4-10 Distribution of energy against frequencies for PLB signals ...............................................93
Figure 4-11 Distribution of energy against frequencies for BD signals.................................................93
Figure 4-12. (a) Maximum cross-correlation coefficients, (b) Average magnitude squared
coherence values between the template PLB and rest of the signals ....................................95
Figure 4-13 (a) Maximum cross-correlation coefficients, (b) Average magnitude squared
coherence values between the template BD and rest of the signals ......................................96
Figure 4-14 (a) Cross-correlation between two PLB signals (b) Cross-correlation of PLB and
BD signals ............................................................................................................................97
Figure 4-15 MSC values versus frequencies for (a) two PLB signals and (b) one PLB and one
BD signal ..............................................................................................................................98
Figure 4-16 Distribution of energy against frequencies for PLB signals recorded by sensor S2 ...........99
Figure 4-17 Distribution of energy against frequencies for BD signals recorded by sensor S2 ..........100
Figure 4-18 Average values of energy against frequencies for PLB signals recorded by sensors
S1 and S2............................................................................................................................100
Figure 4-19 Average values of energy against frequencies for BD signals recorded by sensors
S1 and S2............................................................................................................................101
Figure 4-20 Variation of energy with frequency for PLBs in steel beam at three locations using
the same sensor ...................................................................................................................102
Figure 4-21 Variation of energy with frequency for PLBs in steel plate for four equidistant
sensors ................................................................................................................................ 102
Figure 4-22 In-plane and out-of-plane PLB signals along with time-frequency representation ..........105
Figure 4-23 Dispersion curve for plate of thickness 2 mm, S0 – symmetric/extensional mode
and A0 – antisymmetric/flexural mode [94] .......................................................................106
Analysis of acoustic emission data for accurate damage assessment for structural health monitoring applicationsix
x
Figure 4-24 (a) Load and cumulative hits, (b) absolute energy versus time ........................................ 108
Figure 4-25 (a) Typical crack signal and its STFT analysis, (b) typical impact signal along with
its STFT analysis, (c) typical rubbing signal along with its STFT analysis ........................ 110
Figure 4-26 Energy distribution in different frequency bands for three different signal types ............ 110
Figure 5-1 Experimental set up for three point bending tests .............................................................. 116
Figure 5-2 FEI Quanta 200 Scanning Electron Microscope () ................ 116
Figure 5-3 Discotom-6 cut-off machine .............................................................................................. 117
Figure 5-4 Specimens after the completion of loading (3, 2, 1 mm/min from the top) ....................... 118
Figure 5-5 Different stages of damage (2 mm/min case) at selected times of 0, 200, 410, 500,
615 and 720s (clockwise from top left, crack seen at 410s marked) .................................. 118
Figure 5-6 Specimen after the loading is stopped at the peak (Loading case IV) ............................... 119
Figure 5-7 Observations of fracture surfaces with scanning electron microscope for three
specimens ........................................................................................................................... 120
Figure 5-8 Variation of force, amplitude and absolute energy with time (1 mm/min) ........................ 122
Figure 5-9 Variation of force, amplitude and absolute energy with time (2 mm/min) ........................ 122
Figure 5-10 Variation of force, amplitude and absolute energy with time (3 mm/min) ...................... 123
Figure 5-11 Variation of force, amplitude and absolute energy with time (2 mm/min, stopped at
peak load) ........................................................................................................................... 123
Figure 5-12 Variation of force, amplitude and absolute energy with time (2 mm/min, unnotched
specimen) ........................................................................................................................... 124
Figure 5-13 Frequency (linear, dashed line) and cumulative frequency (logarithmic, solid line)
of AE hits against amplitude .............................................................................................. 125
Figure 5-14 Cumulative frequency of AE hits with amplitude (for first 100 set of events of 1
mm/min loading case) ........................................................................................................ 127
Figure 5-15 Improved b-value calculation for five loading conditions ............................................... 129
Figure 5-16 Variation of the time of occurrence of lowest Ib value with the loading rate .................. 130
Figure 5-17 Comparison of the results from Ib value analysis with history and severity analysis
for (a) 1 mm/min, (b) 2 mm/min, and (c) 3 mm/min loaded specimens ............................. 132
Figure 6-1 Scale bridge model with three sensors attached (S1, S2, S3) ............................................ 135
Figure 6-2 Locations of AE source (X 1,2,3,4- PLBs, O-Impact) and nomenclature of some
components of the scale model bridge ............................................................................... 136
Figure 6-3 Gusset plate (location of source 1) along with bolted connections .................................... 137
xAnalysis of acoustic emission data for accurate damage assessment for structural health monitoring applications
xi
Figure 6-4 PLB signals recorded by three sensors S2, S3 and S1, along with times of arrival
(red dashed line indicates threshold) ..................................................................................139
Figure 6-5 FFT of PLB signal in Figure 6-4a ......................................................................................139
Figure 6-6 (a) Sample impact signal, and (b) its FFT ..........................................................................142
Figure B-1 Some common wavelets [48] ............................................................................................161
Figure B-2 Shifting and scaling operations ( ................162
Figure B-3 Comparison of signal processing techniques [44] .............................................................162
Figure B-4 (a) Filtering process for DWT, (b) Multilevel wavelet decomposition [44] .....................164
Figure B-5 Wavelet packet analysis [44] ............................................................................................164
Analysis of acoustic emission data for accurate damage assessment for structural health monitoring applicationsxi
xii
List of Tables
Table 2-1 Common SHM methods........................................................................................................ 13
Table 2-2 Materials in which AE has been measured and source ......................................................... 17
Table 2-3 Characteristics of acoustic emission technique compared with other inspection
methods [25] ........................................................................................................................ 19
Table 2-4 Acoustic emission parameters and their information about the source event [33] ................ 22
Table 2-5 Relationships among the crack safety index, crack growth rate, count rate and K for
bridge steels explained [69].................................................................................................. 45
Table 3-1 Specifications of R1η sensor............................................................................................... 58
Table 3-2: Calculation of distance between source and sensor using velocities of modes
recorded by single sensor ..................................................................................................... 74
Table 4-1: Parameters of signals recorded by S1 .................................................................................. 89
Table 4-2: Parameters of signals recorded by S2 .................................................................................. 90
Table 5-1 Summary of all experimental setup ..................................................................................... 114
Table 6-1 Dimensions of some members of the scale bridge model ................................................... 137
Table 6-2 Times of arrival of the signals at the sensors (in seconds, SN- recording sensor
number, no times given when recorded by single sensor) .................................................. 140
xii
Analysis of acoustic emission data for accurate damage assessment for structural health monitoring
applications
xiii
List of Abbreviations
SHM –
Structural Health Monitoring
NDT –
Non-Destructive Testing
NDE –
Non-Destructive Evaluation
AE
–
STFT –
Acoustic Emission
Short Time Fourier Transform
WT
–
Wavelet Transform
PLB
–
Pencil Lead Break
TOA –
Time of Arrival
Analysis of acoustic emission data for accurate damage assessment for structural health monitoring applications
xiii
xiv
Statement of Original Authorship
The work contained in this thesis has not been previously submitted to meet
requirements for an award at this or any other higher education institution. To the
best of my knowledge and belief, the thesis contains no material previously published
or written by another person except where due reference is made.
Signature:
_________________________
Date:
_________________________
xiv
Analysis of acoustic emission data for accurate damage assessment for structural health monitoring
applications
xv
Acknowledgments
First of all, I would like to thank my principal supervisor Prof. Andy Tan and
my associate supervisors Prof. David Thambiratnam and Assoc. Prof. Tommy Chan
for their help, advice, guidance and encouragement throughout the candidature.
I would also like to extend thanks to all the lab technicians for help in setting
up experiments and all friends, especially the members of structural health
monitoring and condition monitoring groups, for times spent together and making
research/work enjoyable.
I would also like to acknowledge the support in the research from CRC
Infrastructure and Engineering Asset management (CIEAM) and Australian Research
Council grants.
Finally, thanks to my parents, rest of my family, my wife and my son, who all
helped make this thesis possible through their constant support and encouragement.
Analysis of acoustic emission data for accurate damage assessment for structural health monitoring applications
xv
Chapter 1: Introduction
This chapter begins by outlining the background of the research (Section 1.1),
followed by the objectives and the scope of the research (Sections 1.2 and 1.3
respectively). Section 1.4 details the original contribution of this work. Finally,
Section 1.5 presents an outline of the remaining chapters of the thesis.
1.1
BACKGROUND
Structural health monitoring (SHM) refers to the procedure used to assess the
condition of structures so that their performance can be monitored and any damage
can be detected early. Early detection of damage and appropriate retrofitting will aid
in preventing failure of the structure and save money spent on maintenance or
replacement and ensure the structure operates safely and efficiently during its whole
intended life. Hence, a need exists for a reliable technique capable of assessing
structural health of engineering structures and giving early indication of underlying
damage. Various SHM methods are applied in the fields of mechanical, civil and
aerospace engineering.
As civil infrastructures get older, monitoring their structural integrity and
devising and improving monitoring methods are both gaining priority for owners,
engineers and researchers. Bridges constitute one class of aging infrastructure that
requires effective SHM tools, especially due to their economic significance (high
building costs) as well as their direct effects on public safety and well being. Many
bridges in use today were built decades ago and are now subjected to increased loads
or changes in load patterns than originally designed for. These loads and deterioration
with age can cause localized distress and may even result in bridge failure if not
corrected in due time. Large amounts of money are spent on building and
maintenance of bridges all around the world. In Australia, there are about 33500
bridges with a replacement value of about 16.4 billion dollars and annual
maintenance expenditure of about 100 million dollars [1]. In USA, out of a total
597,377 bridges, 164,971, that is, around 27.6 percent were identified as being either
structurally deficient or functionally obsolete [2].
Chapter 1: Introduction
1
Bridge failures, though rare, can cause huge financial losses as well as loss of
lives. A recent example is the I-35W highway bridge (of steel truss arch bridge type)
collapse in Minnesota, USA in August 2007, which resulted in 13 deaths and injuries
to hundreds of people. A flaw in the design which involved the use of a metal plate
that was too thin to serve as a junction of several girders was found responsible for
the crash [3]. Though the bridge was only about 40 years old, the increase in weight
due to concrete structures and construction materials on the deck created added strain
to the weak spot, eventually leading it to failure [3].
Story bridge, an iconic bridge in Brisbane, (shown in Figure 1-1) is a steel truss
cantilevered bridge constructed between 1935 and 1940 and consists of 12,000 tons
of structural steel, 1,650 tons of reinforcing steel and 1,500,000 rivets [4]. For
maintenance, the bridge is currently repainted every 7 years using 17,500 litres of
paint and there is approximately 105,000 square metres of painted steel surfaces [4].
Recently, it has been reported that stress fractures are emerging along the West Gate
Bridge in Melbourne and that continued maintenance would be needed to monitor
and repair those cracks, with maintenance costs projected to be $150 million dollars
over the next 15 years [5, 6].
The facts and figures above prove the importance of early damage detection
and timely planning of appropriate retrofitting/maintenance in continual safe
performance of bridges and in achieving potential economic benefits. Visual
inspection by trained inspectors has been the traditional means of bridge monitoring.
But visual inspection alone cannot detect all damage, for example, cracks in hard to
reach areas, cracks just starting to initiate or cracks hidden by layers of paint may go
undetected by visual inspection alone. Hence, better and more reliable techniques are
often required for better crack detection, especially at the earliest stage.
Acoustic emission (AE) technique is one SHM tool that enables early crack
detection. It is based on the phenomenon whereby high frequency ultrasonic waves
are generated from rapid release of energy inside a material, for example, from
initiating and growing cracks. These waves can be recorded by means of appropriate
sensors and the recorded signals can then be analysed to extract valuable information
about the nature of the source of emission. High sensitivity to crack growth, ability to
monitor hard to reach areas and ability to perform real time monitoring are some of
2
Chapter 1: Introduction
the features that make AE technique an attractive tool for SHM of big civil
infrastructures. However, the use of AE technique for monitoring civil infrastructures
is fairly new and several challenges still exist; especially regarding the need for
analysis of large volume of data generated during the monitoring process.
Figure 1-1 Story bridge – an iconic bridge in Brisbane [7]
1.2
OBJECTIVES OF THE RESEARCH
The primary goals of any SHM tool are threefold: locate the damage,
understand the nature of damage and quantify the damage. The main aim of this
research is to address these three goals in the context of AE technique by focussing
on effective analysis of recorded data, which is a big challenge in AE technique. The
area of application is targeted mainly towards civil infrastructures such as bridges,
though the tools and techniques used are equally applicable in monitoring of other
engineering structures.
The main objectives of this research can further be expressed as follows:
(1) Accurate source localization
Ability to accurately locate the source of emission as long as the signals reach
the sensors is one of the advantages of AE technique. But complications arise as AE
waves can travel in different forms (modes) that have different velocities. Further
mode conversions, signal reflections, superposition and attenuation can lead the
sensors to record different modes. To accurately determine the location of the AE
Chapter 1: Introduction
3
source, proper identification of wave modes is necessary, as velocities and times of
arrival of the modes at the sensors are the two important parameters needed to
calculate the location. This study will develop a model to identify the wave modes by
means of signal processing tools such as short time Fourier transform and use their
velocities for source location calculations. Further, by identifying different modes
recorded by a single sensor and using their velocities, source location in one
dimension can be calculated using a single sensor rather than two needed in general
method. The possibility of reducing the number of sensors needed for data capture is
desirable and will be explored in this study.
(2) Source differentiation
Another major problem behind successful use of AE technique is the presence
of sources of emission other than crack growth, such as rubbing of components or
impacts from outside sources. These spurious noise signals often mask the signals
from crack activity; hence discrimination of genuine signals from spurious noises is
very important to achieve good monitoring results. This work will develop models
that use different signal processing tools for differentiating signals from different AE
sources. Furthermore, in theory, it is stated that in-plane (crack type) and out-of-plane
(impact type) sources emit AE waves with different wave modes. By simulating such
sources and then identifying and comparing amplitudes of the wave modes recorded,
this study will aim to explore modal analysis as source differentiation approach.
(3) Severity assessment
During data analysis, it is desirable to have quantification tools to assess the
severity of the damage sources, so that appropriate action can be taken as soon as
possible. Though different damage quantification methods have been proposed in AE
technique, not all have been deemed suitable for use in all situations. Further, the use
of amplitudes of AE signals alone has been found unsuitable for such purposes.
Hence, b-value analysis, which involves the study of distribution of amplitudes of
signals, and its modified form (known as improved b-value or Ib value analysis), will
be investigated for suitability for damage quantification purposes. So far, these
methods have been used mainly for brittle materials such as concrete and rocks;
therefore, this study will investigate the application for ductile materials such as steel.
4
Chapter 1: Introduction
By treating all three vital issues together, it is believed that this study has
solved the problem of effective data analysis in AE technique to a certain extent,
thereby increasing its applicability as a SHM tool.
1.3
SCOPE OF THE RESEARCH
Although AE technique has been in use for over 50 years or so, effective
analysis of data is still a major challenge. Hence, the major scope of this research is
focus on the development of tools for analysis of recorded AE data to achieve
accurate source identification, effective signal discrimination and reliable severity
assessment. This can be expected to increase the effectiveness of acoustic emission
technique as a structural health monitoring tool.
The study will mainly focus on analysis of acoustic emission waves travelling
through steel structures, as steel is very common construction material. In addition to
crack initiation and growth, two common sources of AE in big engineering
infrastructures are impacts of and rubbing between two components. Laboratory
experiments will be carried out to simulate these common sources of AE. Most
experiments are carried out in thin plates and beams, which are used extensively in
engineering structures. Though no real life testing could be carried out due to time
constraints and other practical reasons, it is believed that tests carried out in
laboratory closely mimic the real-life scenarios.
The scope of the research and data analysis algorithm proposed can be
summarised in Figure 1-2. For data analysis, two major approaches are taken – study
of signal parameters and study of recorded waveforms. Use of time, frequency and
simultaneous time-frequency domain information are used for waveform based
analysis. Then, source location calculations are based on identifying particular wave
modes and using information on their times of arrival. Similarly, tools such as crosscorrelation, coherence, energy distribution in different frequency bands and
comparison of amplitudes of different modes are used for source discrimination.
Analysis of signal amplitudes using b-value analysis is used for severity assessment.
Detailed discussions on different aspects of the model will be presented in later
sections and chapters.
Chapter 1: Introduction
5
Figure 1-2 Data analysis approach
1.4
ORIGINALITY AND SIGNIFICANCE OF THE RESEARCH
Major significant contribution of this research can be summarized as follows:
One of the original contributions of this work includes the development of a
model that: (a) uses short time Fourier transform (STFT) analysis to study
energy distribution of signals in different frequency bands and apply this
information to identify different wave modes, signal reflections and possible
noises; (b) uses the velocities of identified modes for more accurate source
location calculations, and (c) explores that the identification of modes further
6
Chapter 1: Introduction
improves source localization by reducing the number of sensors needed for data
capture.
Another contribution of this study is the development of a model to achieve
source discrimination using the following tools: (a) Coherence and crosscorrelation functions in judging similarity or uniqueness of two waveforms; (b)
identification and comparison of the amplitudes of AE wave modes to
distinguish in-plane (crack like) and out-of-plane (impact type) source signals;
(c) energy distribution in different frequency bands using short time Fourier
transform to distinguish AE signals from crack, impact and rubbing, which are
the three main sources of AE in structures such as bridges.
By applying improved b-value (Ib value) analysis for data obtained from threepoint bending tests of steel specimens, this study found that the lowest Ib value
can predict the onset of plasticity in ductile materials and thus provides an early
warning and act as a way to assess the level of severity during testing.
To summarize, the major innovation of this project is the development of data
analysis methods that intelligently combine several signal processing tools to enable
the study of AE wave features and parameters from the recorded data in order to
address all three important issues of locating the damage source, discriminating
different sources of emission and assessing the severity of damage. As explained
earlier, combining these three vital aspects needed for an effective SHM system, it is
believed that this thesis has helped make AE technique more applicable for use in
monitoring of engineering infrastructures.
Publications of research outcomes
The outcomes of this research have resulted in the following publications:
Journal articles
1. Kaphle, M, Tan ACC, Thambiratnam, DP and Chan, THT (2012), Effective
discrimination of acoustic emission source signals for structural health
monitoring, in Advances in Structural Engineering, 15(5): 707-716.
Chapter 1: Introduction
7