2010 applied survey data analysis
Bạn đang xem bản rút gọn của tài liệu. Xem và tải ngay bản đầy đủ của tài liệu tại đây (3.7 MB, 463 trang )
Applied Survey
Data Analysis
© 2010 by Taylor and Francis Group, LLC
Chapman & Hall/CRC
Statistics in the Social and Behavioral Sciences Series
Series Editors
A. Colin Cameron
University of California, Davis, USA
J. Scott Long
Indiana University, USA
Andrew Gelman
Columbia University, USA
Sophia Rabe-Hesketh
University of California, Berkeley, USA
Anders Skrondal
Norwegian Institute of Public Health, Norway
Aims and scope
Large and complex datasets are becoming prevalent in the social and behavioral
sciences and statistical methods are crucial for the analysis and interpretation of such
data. This series aims to capture new developments in statistical methodology with
particular relevance to applications in the social and behavioral sciences. It seeks to
promote appropriate use of statistical, econometric and psychometric methods in
these applied sciences by publishing a broad range of reference works, textbooks and
handbooks.
The scope of the series is wide, including applications of statistical methodology in
sociology, psychology, economics, education, marketing research, political science,
criminology, public policy, demography, survey methodology and official statistics. The
titles included in the series are designed to appeal to applied statisticians, as well as
students, researchers and practitioners from the above disciplines. The inclusion of real
examples and case studies is therefore essential.
Published Titles
Analysis of Multivariate Social Science Data, Second Edition
David J. Bartholomew, Fiona Steele, Irini Moustaki, and Jane I. Galbraith
Applied Survey Data Analysis
Steven G. Heeringa, Brady T. West, and Patricia A. Berglund
Bayesian Methods: A Social and Behavioral Sciences Approach, Second Edition
Jeff Gill
Foundations of Factor Analysis, Second Edition
Stanley A. Mulaik
Linear Causal Modeling with Structural Equations
Stanley A. Mulaik
Multiple Correspondence Analysis and Related Methods
Michael Greenacre and Jorg Blasius
Multivariable Modeling and Multivariate Analysis for the Behavioral Sciences
Brian S. Everitt
Statistical Test Theory for the Behavioral Sciences
Dato N. M. de Gruijter and Leo J. Th. van der Kamp
© 2010 by Taylor and Francis Group, LLC
Chapman & Hall/CRC
Statistics in the Social and Behavioral Sciences Series
Applied Survey
Data Analysis
Steven G. Heeringa
Brady T. West
Patricia A. Berglund
© 2010 by Taylor and Francis Group, LLC
Chapman & Hall/CRC
Taylor & Francis Group
6000 Broken Sound Parkway NW, Suite 300
Boca Raton, FL 33487-2742
© 2010 by Taylor and Francis Group, LLC
Chapman & Hall/CRC is an imprint of Taylor & Francis Group, an Informa business
No claim to original U.S. Government works
Printed in the United States of America on acid-free paper
10 9 8 7 6 5 4 3 2 1
International Standard Book Number: 978-1-4200-8066-7 (Hardback)
This book contains information obtained from authentic and highly regarded sources. Reasonable efforts
have been made to publish reliable data and information, but the author and publisher cannot assume
responsibility for the validity of all materials or the consequences of their use. The authors and publishers
have attempted to trace the copyright holders of all material reproduced in this publication and apologize to
copyright holders if permission to publish in this form has not been obtained. If any copyright material has
not been acknowledged please write and let us know so we may rectify in any future reprint.
Except as permitted under U.S. Copyright Law, no part of this book may be reprinted, reproduced, transmitted, or utilized in any form by any electronic, mechanical, or other means, now known or hereafter invented,
including photocopying, microfilming, and recording, or in any information storage or retrieval system,
without written permission from the publishers.
For permission to photocopy or use material electronically from this work, please access www.copyright.
com ( or contact the Copyright Clearance Center, Inc. (CCC), 222 Rosewood
Drive, Danvers, MA 01923, 978-750-8400. CCC is a not-for-profit organization that provides licenses and
registration for a variety of users. For organizations that have been granted a photocopy license by the CCC,
a separate system of payment has been arranged.
Trademark Notice: Product or corporate names may be trademarks or registered trademarks, and are used
only for identification and explanation without intent to infringe.
Library of Congress Cataloging‑in‑Publication Data
Heeringa, Steven, 1953Applied survey data analysis / Steven G. Heeringa, Brady West, and Patricia A.
Berglund.
p. cm.
Includes bibliographical references and index.
ISBN 978-1-4200-8066-7 (alk. paper)
1. Social sciences--Statistics. 2. Social surveys--Statistical methods. I. West, Brady T.
II. Berglund, Patricia A. III. Title.
HA29.H428 2010
001.4’22--dc22
Visit the Taylor & Francis Web site at
and the CRC Press Web site at
© 2010 by Taylor and Francis Group, LLC
2009051730
Contents
Preface......................................................................................................................xv
1. Applied Survey Data Analysis: Overview.................................................1
1.1 Introduction............................................................................................1
1.2 A Brief History of Applied Survey Data Analysis............................3
1.2.1 Key Theoretical Developments...............................................3
1.2.2 Key Software Developments...................................................5
1.3 Example Data Sets and Exercises........................................................6
1.3.1 The National Comorbidity Survey Replication
(NCS-R).......................................................................................6
1.3.2 The Health and Retirement Study (HRS)—2006..................7
1.3.3 The National Health and Nutrition Examination
Survey (NHANES)—2005, 2006..............................................7
1.3.4 Steps in Applied Survey Data Analysis................................8
1.3.4.1 Step 1: Definition of the Problem and
Statement of the Objectives......................................8
1.3.4.2 Step 2: Understanding the Sample Design............9
1.3.4.3 Step 3: Understanding Design Variables,
Underlying Constructs, and Missing Data.......... 10
1.3.4.4 Step 4: Analyzing the Data.................................... 11
1.3.4.5 Step 5: Interpreting and Evaluating the
Results of the Analysis........................................... 11
1.3.4.6 Step 6: Reporting of Estimates and
Inferences from the Survey Data.......................... 12
2. Getting to Know the Complex Sample Design....................................... 13
2.1 Introduction.......................................................................................... 13
2.1.1 Technical Documentation and Supplemental
Literature Review................................................................... 13
2.2 Classification of Sample Designs....................................................... 14
2.2.1 Sampling Plans........................................................................ 15
2.2.2 Inference from Survey Data.................................................. 16
2.3 Target Populations and Survey Populations.................................... 16
2.4 Simple Random Sampling: A Simple Model for
Design-Based Inference...................................................................... 18
2.4.1 Relevance of SRS to Complex Sample Survey Data
Analysis.................................................................................... 18
2.4.2 SRS Fundamentals: A Framework for Design-Based
Inference................................................................................... 19
2.4.3 An Example of Design-Based Inference under SRS.......... 21
v
© 2010 by Taylor and Francis Group, LLC
vi
Contents
2.5
2.6
2.7
2.8
2.9
Complex Sample Design Effects........................................................ 23
2.5.1 Design Effect Ratio................................................................. 23
2.5.2 Generalized Design Effects and Effective Sample
Sizes.......................................................................................... 25
Complex Samples: Clustering and Stratification............................. 27
2.6.1 Clustered Sampling Plans..................................................... 28
2.6.2 Stratification............................................................................. 31
2.6.3 Joint Effects of Sample Stratification and Clustering.........34
Weighting in Analysis of Survey Data.............................................. 35
2.7.1 Introduction to Weighted Analysis of Survey Data........... 35
2.7.2 Weighting for Probabilities of Selection.............................. 37
2.7.3 Nonresponse Adjustment Weights...................................... 39
2.7.3.1 Weighting Class Approach.................................... 40
2.7.3.2 Propensity Cell Adjustment Approach................ 40
2.7.4 Poststratification Weight Factors..........................................42
2.7.5 Design Effects Due to Weighted Analysis..........................44
Multistage Area Probability Sample Designs.................................. 46
2.8.1 Primary Stage Sampling........................................................ 47
2.8.2 Secondary Stage Sampling.................................................... 48
2.8.3 Third and Fourth Stage Sampling of Housing Units
and Eligible Respondents...................................................... 49
Special Types of Sampling Plans Encountered in Surveys............ 50
3. Foundations and Techniques for Design-Based Estimation and
Inference.......................................................................................................... 53
3.1 Introduction.......................................................................................... 53
3.2 Finite Populations and Superpopulation Models...........................54
3.3 Confidence Intervals for Population Parameters............................ 56
3.4 Weighted Estimation of Population Parameters............................. 56
3.5 Probability Distributions and Design-Based Inference................. 60
3.5.1 Sampling Distributions of Survey Estimates...................... 60
3.5.2 Degrees of Freedom for t under Complex Sample
Designs.....................................................................................63
3.6 Variance Estimation.............................................................................65
3.6.1 Simplifying Assumptions Employed in Complex
Sample Variance Estimation.................................................. 66
3.6.2 The Taylor Series Linearization Method............................. 68
3.6.2.1 TSL Step 1................................................................. 69
3.6.2.2 TSL Step 2................................................................. 70
3.6.2.3 TSL Step 3................................................................. 71
3.6.2.4 TSL Step 4................................................................. 71
3.6.2.5 TSL Step 5................................................................. 73
3.6.3 Replication Methods for Variance Estimation.................... 74
3.6.3.1 Jackknife Repeated Replication............................. 75
© 2010 by Taylor and Francis Group, LLC
vii
Contents
3.7
3.8
3.6.3.2 Balanced Repeated Replication............................. 78
3.6.3.3 The Bootstrap........................................................... 82
3.6.4 An Example Comparing the Results from the TSL,
JRR, and BRR Methods.......................................................... 82
Hypothesis Testing in Survey Data Analysis..................................83
Total Survey Error and Its Impact on Survey Estimation and
Inference................................................................................................85
3.8.1 Variable Errors......................................................................... 86
3.8.2 Biases in Survey Data............................................................. 87
4. Preparation for Complex Sample Survey Data Analysis...................... 91
4.1 Introduction.......................................................................................... 91
4.2 Analysis Weights: Review by the Data User.................................... 92
4.2.1 Identification of the Correct Weight Variables for the
Analysis.................................................................................... 93
4.2.2 Determining the Distribution and Scaling of the
Weight Variables..................................................................... 94
4.2.3 Weighting Applications: Sensitivity of Survey
Estimates to the Weights........................................................ 96
4.3 Understanding and Checking the Sampling Error
Calculation Model................................................................................ 98
4.3.1 Stratum and Cluster Codes in Complex Sample
Survey Data Sets..................................................................... 99
4.3.2 Building the NCS-R Sampling Error Calculation
Model...................................................................................... 100
4.3.3 Combining Strata, Randomly Grouping PSUs, and
Collapsing Strata................................................................... 103
4.3.4 Checking the Sampling Error Calculation Model for
the Survey Data Set.............................................................. 105
4.4 Addressing Item Missing Data in Analysis Variables.................. 108
4.4.1 Potential Bias Due to Ignoring Missing Data................... 108
4.4.2 Exploring Rates and Patterns of Missing Data Prior
to Analysis............................................................................. 109
4.5 Preparing to Analyze Data for Sample Subpopulations.............. 110
4.5.1 Subpopulation Distributions across Sample Design
Units........................................................................................ 111
4.5.2 The Unconditional Approach for Subclass Analysis....... 114
4.5.3 Preparation for Subclass Analyses..................................... 114
4.6 A Final Checklist for Data Users..................................................... 115
5. Descriptive Analysis for Continuous Variables................................... 117
5.1 Introduction........................................................................................ 117
5.2 Special Considerations in Descriptive Analysis of Complex
Sample Survey Data........................................................................... 118
5.2.1 Weighted Estimation............................................................ 118
© 2010 by Taylor and Francis Group, LLC
viii
Contents
5.3
5.4
5.5
5.6
5.7
5.2.2 Design Effects for Descriptive Statistics............................ 119
5.2.3 Matching the Method to the Variable Type...................... 119
Simple Statistics for Univariate Continuous Distributions.......... 120
5.3.1 Graphical Tools for Descriptive Analysis of Survey
Data......................................................................................... 120
5.3.2 Estimation of Population Totals.......................................... 123
5.3.3 Means of Continuous, Binary, or Interval Scale Data...... 128
5.3.4 Standard Deviations of Continuous Variables................. 130
5.3.5 Estimation of Percentiles and Medians of Population
Distributions.......................................................................... 131
Bivariate Relationships between Two Continuous Variables...... 134
5.4.1 X–Y Scatterplots..................................................................... 134
5.4.2 Product Moment Correlation Statistic (r).......................... 135
5.4.3 Ratios of Two Continuous Variables.................................. 136
Descriptive Statistics for Subpopulations....................................... 137
Linear Functions of Descriptive Estimates and Differences
of Means.............................................................................................. 139
5.6.1 Differences of Means for Two Subpopulations................ 141
5.6.2 Comparing Means over Time............................................. 143
Exercises.............................................................................................. 144
6. Categorical Data Analysis......................................................................... 149
6.1 Introduction........................................................................................ 149
6.2 A Framework for Analysis of Categorical Survey Data............... 150
6.2.1 Incorporating the Complex Design and
Pseudo-Maximum Likelihood............................................ 150
6.2.2 Proportions and Percentages.............................................. 150
6.2.3 Cross-Tabulations, Contingency Tables, and
Weighted Frequencies.......................................................... 151
6.3 Univariate Analysis of Categorical Data........................................ 152
6.3.1 Estimation of Proportions for Binary Variables............... 152
6.3.2 Estimation of Category Proportions for Multinomial
Variables................................................................................. 156
6.3.3 Testing Hypotheses Concerning a Vector of
Population Proportions........................................................ 158
6.3.4 Graphical Display for a Single Categorical Variable........ 159
6.4 Bivariate Analysis of Categorical Data........................................... 160
6.4.1 Response and Factor Variables........................................... 160
6.4.2 Estimation of Total, Row, and Column Proportions
for Two-Way Tables............................................................... 162
6.4.3 Estimating and Testing Differences in
Subpopulation Proportions................................................. 163
6.4.4 Chi-Square Tests of Independence of Rows and
Columns................................................................................. 164
6.4.5 Odds Ratios and Relative Risks.......................................... 170
© 2010 by Taylor and Francis Group, LLC
ix
Contents
6.4.6
6.5
6.6
Simple Logistic Regression to Estimate the Odds
Ratio........................................................................................ 171
6.4.7 Bivariate Graphical Analysis............................................... 173
Analysis of Multivariate Categorical Data..................................... 174
6.5.1 The Cochran–Mantel–Haenszel Test................................. 174
6.5.2 Log-Linear Models for Contingency Tables...................... 176
Exercises.............................................................................................. 177
7. Linear Regression Models......................................................................... 179
7.1 Introduction........................................................................................ 179
7.2 The Linear Regression Model.......................................................... 180
7.2.1 The Standard Linear Regression Model............................ 182
7.2.2 Survey Treatment of the Regression Model...................... 183
7.3 Four Steps in Linear Regression Analysis...................................... 185
7.3.1 Step 1: Specifying and Refining the Model....................... 186
7.3.2 Step 2: Estimation of Model Parameters............................ 187
7.3.2.1 Estimation for the Standard Linear
Regression Model.................................................. 187
7.3.2.2 Linear Regression Estimation for Complex
Sample Survey Data.............................................. 188
7.3.3 Step 3: Model Evaluation..................................................... 193
7.3.3.1 Explained Variance and Goodness of Fit........... 193
7.3.3.2 Residual Diagnostics............................................. 194
7.3.3.3 Model Specification and Homogeneity of
Variance.................................................................. 194
7.3.3.4 Normality of the Residual Errors........................ 195
7.3.3.5 Outliers and Influence Statistics......................... 196
7.3.4 Step 4: Inference.................................................................... 196
7.3.4.1 Inference Concerning Model Parameters.......... 199
7.3.4.2 Prediction Intervals............................................... 202
7.4 Some Practical Considerations and Tools....................................... 204
7.4.1 Distribution of the Dependent Variable............................ 204
7.4.2 Parameterization and Scaling for Independent
Variables................................................................................. 205
7.4.3 Standardization of the Dependent and Independent
Variables................................................................................. 208
7.4.4 Specification and Interpretation of Interactions and
Nonlinear Relationships...................................................... 208
7.4.5 Model-Building Strategies................................................... 210
7.5 Application: Modeling Diastolic Blood Pressure with the
NHANES Data................................................................................... 211
7.5.1 Exploring the Bivariate Relationships............................... 212
7.5.2 Naïve Analysis: Ignoring Sample Design Features......... 215
7.5.3 Weighted Regression Analysis........................................... 216
© 2010 by Taylor and Francis Group, LLC
x
Contents
7.5.4
7.6
Appropriate Analysis: Incorporating All Sample
Design Features..................................................................... 218
Exercises.............................................................................................. 224
8. Logistic Regression and Generalized Linear Models for Binary
Survey Variables.......................................................................................... 229
8.1 Introduction........................................................................................ 229
8.2 Generalized Linear Models for Binary Survey Responses.......... 230
8.2.1 The Logistic Regression Model........................................... 231
8.2.2 The Probit Regression Model.............................................. 234
8.2.3 The Complementary Log–Log Model................................234
8.3 Building the Logistic Regression Model: Stage 1, Model
Specification........................................................................................ 235
8.4 Building the Logistic Regression Model: Stage 2, Estimation
of Model Parameters and Standard Errors..................................... 236
8.5 Building the Logistic Regression Model: Stage 3, Evaluation
of the Fitted Model............................................................................. 239
8.5.1 Wald Tests of Model Parameters........................................ 239
8.5.2 Goodness of Fit and Logistic Regression
Diagnostics............................................................................. 243
8.6 Building the Logistic Regression Model: Stage 4,
Interpretation and Inference............................................................ 245
8.7 Analysis Application......................................................................... 251
8.7.1 Stage 1: Model Specification................................................ 252
8.7.2 Stage 2: Model Estimation................................................... 253
8.7.3 Stage 3: Model Evaluation.................................................... 255
8.7.4 Stage 4: Model Interpretation/Inference........................... 256
8.8 Comparing the Logistic, Probit, and Complementary
Log–Log GLMs for Binary Dependent Variables.......................... 259
8.9 Exercises.............................................................................................. 262
9. Generalized Linear Models for Multinomial, Ordinal, and
Count Variables............................................................................................ 265
9.1 Introduction........................................................................................ 265
9.2 Analyzing Survey Data Using Multinomial Logit
Regression Models............................................................................. 265
9.2.1 The Multinomial Logit Regression Model........................ 265
9.2.2 Multinomial Logit Regression Model: Specification
Stage........................................................................................ 267
9.2.3 Multinomial Logit Regression Model: Estimation
Stage........................................................................................ 268
9.2.4 Multinomial Logit Regression Model: Evaluation
Stage........................................................................................ 268
© 2010 by Taylor and Francis Group, LLC
xi
Contents
9.2.5
9.3
9.4
9.5
Multinomial Logit Regression Model: Interpretation
Stage........................................................................................ 270
9.2.6 Example: Fitting a Multinomial Logit Regression
Model to Complex Sample Survey Data............................ 271
Logistic Regression Models for Ordinal Survey Data.................. 277
9.3.1 Cumulative Logit Regression Model................................. 278
9.3.2 Cumulative Logit Regression Model: Specification
Stage........................................................................................ 279
9.3.3 Cumulative Logit Regression Model: Estimation
Stage........................................................................................ 279
9.3.4 Cumulative Logit Regression Model: Evaluation
Stage........................................................................................280
9.3.5 Cumulative Logit Regression Model: Interpretation
Stage........................................................................................ 281
9.3.6 Example: Fitting a Cumulative Logit Regression
Model to Complex Sample Survey Data............................ 282
Regression Models for Count Outcomes........................................ 286
9.4.1 Survey Count Variables and Regression Modeling
Alternatives............................................................................ 286
9.4.2 Generalized Linear Models for Count Variables............. 288
9.4.2.1 The Poisson Regression Model............................ 288
9.4.2.2 The Negative Binomial Regression Model........ 289
9.4.2.3 Two-Part Models: Zero-Inflated Poisson
and Negative Binomial Regression Models...... 290
9.4.3 Regression Models for Count Data: Specification
Stage........................................................................................ 291
9.4.4 Regression Models for Count Data: Estimation
Stage........................................................................................ 292
9.4.5 Regression Models for Count Data: Evaluation
Stage........................................................................................ 292
9.4.6 Regression Models for Count Data: Interpretation
Stage........................................................................................ 293
9.4.7 Example: Fitting Poisson and Negative Binomial
Regression Models to Complex Sample Survey Data...... 294
Exercises.............................................................................................. 298
10. Survival Analysis of Event History Survey Data................................. 303
10.1 Introduction........................................................................................ 303
10.2 Basic Theory of Survival Analysis................................................... 303
10.2.1 Survey Measurement of Event History Data.................... 303
10.2.2 Data for Event History Models...........................................305
10.2.3 Important Notation and Definitions..................................306
10.2.4 Models for Survival Analysis.............................................. 307
© 2010 by Taylor and Francis Group, LLC
xii
Contents
10.3 (Nonparametric) Kaplan–Meier Estimation of the Survivor
Function...............................................................................................308
10.3.1 K–M Model Specification and Estimation.........................309
10.3.2 K–M Estimator—Evaluation and Interpretation.............. 310
10.3.3 K–M Survival Analysis Example........................................ 311
10.4 Cox Proportional Hazards Model................................................... 315
10.4.1 Cox Proportional Hazards Model: Specification.............. 315
10.4.2 Cox Proportional Hazards Model: Estimation Stage...... 316
10.4.3 Cox Proportional Hazards Model: Evaluation and
Diagnostics............................................................................. 317
10.4.4 Cox Proportional Hazards Model: Interpretation and
Presentation of Results......................................................... 319
10.4.5 Example: Fitting a Cox Proportional Hazards Model
to Complex Sample Survey Data........................................ 319
10.5 Discrete Time Survival Models........................................................ 322
10.5.1 The Discrete Time Logistic Model..................................... 323
10.5.2 Data Preparation for Discrete Time Survival
Models.................................................................................... 324
10.5.3 Discrete Time Models: Estimation Stage........................... 327
10.5.4 Discrete Time Models: Evaluation and
Interpretation......................................................................... 328
10.5.5 Fitting a Discrete Time Model to Complex Sample
Survey Data........................................................................... 329
10.6 Exercises.............................................................................................. 333
11. Multiple Imputation: Methods and Applications for Survey
Analysts......................................................................................................... 335
11.1 Introduction........................................................................................ 335
11.2 Important Missing Data Concepts.................................................. 336
11.2.1 Sources and Patterns of Item-Missing Data in
Surveys................................................................................... 336
11.2.2 Item-Missing Data Mechanisms......................................... 338
11.2.3 Implications of Item-Missing Data for Survey Data
Analysis.................................................................................. 341
11.2.4 Review of Strategies to Address Item-Missing Data
in Surveys...............................................................................342
11.3 An Introduction to Imputation and the Multiple Imputation
Method................................................................................................345
11.3.1 A Brief History of Imputation Procedures........................345
11.3.2 Why the Multiple Imputation Method?.............................346
11.3.3 Overview of Multiple Imputation and MI Phases...........348
11.4 Models for Multiply Imputing Missing Data................................. 350
11.4.1 Choosing the Variables to Include in the Imputation
Model...................................................................................... 350
© 2010 by Taylor and Francis Group, LLC
xiii
Contents
11.5
11.6
11.7
11.8
11.4.2 Distributional Assumptions for the Imputation
Model...................................................................................... 352
Creating the Imputations.................................................................. 353
11.5.1 Transforming the Imputation Problem to Monotonic
Missing Data.......................................................................... 353
11.5.2 Specifying an Explicit Multivariate Model and
Applying Exact Bayesian Posterior Simulation
Methods.................................................................................. 354
11.5.3 Sequential Regression or “Chained Regressions”...........354
Estimation and Inference for Multiply Imputed Data.................. 355
11.6.1 Estimators for Population Parameters and
Associated Variance Estimators......................................... 356
11.6.2 Model Evaluation and Inference........................................ 357
Applications to Survey Data............................................................. 359
11.7.1 Problem Definition............................................................... 359
11.7.2 The Imputation Model for the NHANES Blood
Pressure Example.................................................................. 360
11.7.3 Imputation of the Item-Missing Data................................. 361
11.7.4 Multiple Imputation Estimation and Inference................ 363
11.7.4.1 Multiple Imputation Analysis 1: Estimation
of Mean Diastolic Blood Pressure.......................364
11.7.4.2 Multiple Imputation Analysis 2: Estimation
of the Linear Regression Model for Diastolic
Blood Pressure....................................................... 365
Exercises.............................................................................................. 368
12. Advanced Topics in the Analysis of Survey Data................................. 371
12.1 Introduction........................................................................................ 371
12.2 Bayesian Analysis of Complex Sample Survey Data.................... 372
12.3 Generalized Linear Mixed Models (GLMMs) in Survey Data
Analysis............................................................................................... 375
12.3.1 Overview of Generalized Linear Mixed Models............. 375
12.3.2 Generalized Linear Mixed Models and Complex
Sample Survey Data............................................................. 379
12.3.3 GLMM Approaches to Analyzing Longitudinal
Survey Data........................................................................... 382
12.3.4 Example: Longitudinal Analysis of the HRS Data.......... 389
12.3.5 Directions for Future Research........................................... 395
12.4 Fitting Structural Equation Models to Complex Sample
Survey Data......................................................................................... 395
12.5 Small Area Estimation and Complex Sample Survey Data......... 396
12.6 Nonparametric Methods for Complex Sample Survey Data....... 397
Appendix A: Software Overview.................................................................... 399
A.1 Introduction........................................................................................ 399
© 2010 by Taylor and Francis Group, LLC
xiv
Contents
A.2
A.3
A.4
A.5
A.6
A.7
A.1.1 Historical Perspective...........................................................400
A.1.2 Software for Sampling Error Estimation........................... 401
Overview of Stata® Version 10+....................................................... 407
Overview of SAS® Version 9.2.......................................................... 410
A.3.1 The SAS SURVEY Procedures............................................. 411
Overview of SUDAAN® Version 9.0................................................ 414
A.4.1 The SUDAAN Procedures................................................... 415
Overview of SPSS®. ........................................................................... 421
A.5.1 The SPSS Complex Samples Commands...........................422
Overview of Additional Software................................................... 427
A.6.1 WesVar®.................................................................................. 427
A.6.2 IVEware (Imputation and Variance Estimation
Software)................................................................................428
A.6.3 Mplus...................................................................................... 429
A.6.4 The R survey Package.......................................................... 429
Summary.............................................................................................430
References............................................................................................................ 431
Index......................................................................................................................443
© 2010 by Taylor and Francis Group, LLC
Preface
This book is written as a guide to the applied statistical analysis and interpretation of survey data. The motivation for this text lies in years of teaching
graduate courses in applied methods for survey data analysis and extensive
consultation with social and physical scientists, educators, medical researchers, and public health professionals on best methods for approaching specific analysis questions using survey data. The general outline for this text
is based on the syllabus for a course titled “Analysis of Complex Sample
Survey Data” that we have taught for over 10 years in the Joint Program in
Survey Methodology (JPSM) based at the University of Maryland (College
Park) and in the University of Michigan’s Program in Survey Methodology
(MPSM) and Summer Institute in Survey Research Techniques.
Readers may initially find the topical outline and content choices a bit
unorthodox, but our instructional experience has shown it to be effective for
teaching this complex subject to students and professionals who have a minimum of a two-semester graduate level course in applied statistics. The practical, everyday relevance of the chosen topics and the emphasis each receives
in this text has also been informed by over 60 years of combined experience
in consulting on survey data analysis with research colleagues and students
under the auspices of the Survey Methodology Program of the Institute for
Social Research (ISR) and the University of Michigan Center for Statistical
Consultation and Research (CSCAR). For example, the emphasis placed on
topics as varied as weighted estimation of population quantities, sampling
error calculation models, coding of indicator variables in regression models,
and interpretation of results from generalized linear models derives directly
from our long-term observation of how often naïve users make critical mistakes in these areas.
This text, like our courses that it will serve, is designed to provide an intermediate-level statistical overview of the analysis of complex sample survey
data—emphasizing methods and worked examples while reinforcing the
principles and theory that underly those methods. The intended audience
includes graduate students, survey practitioners, and research scientists from
the wide array of disciplines that use survey data in their work. Students and
practitioners in the statistical sciences should also find that this text provides
a useful framework for integrating their further, more in-depth studies of
the theory and methods for survey data analysis.
Balancing theory and application in any text is no simple matter. The distinguished statistician D. R. Cox begins the outline of his view of applied
statistical work by stating, “Any simple recommendation along the lines in
applications one should do so and so is virtually bound to be wrong in some or,
indeed, possibly many contexts. On the other hand, descent into yawning
xv
© 2010 by Taylor and Francis Group, LLC
xvi
Preface
Theory Box P.1â•… An Example Theory Box
Theory boxes are used in this volume to develop or explain a fundamental theoretical concept underlying statistical methods. The content
of these “gray-shaded” boxes is intended to stand alone, supplementing
the interested reader’s knowledge, but not necessary for understanding
the general discussion of applied statistical approaches to the analysis
of survey data.
vacuous generalities is all too possible” (Cox, 2007). Since the ingredients
of each applied survey data analysis problem vary—the aims, the sampling
design, the available survey variables—there is no single set of recipes that
each analyst can simply follow without additional thought and evaluation
on his or her part. On the other hand, a text on applied methods should
not leave survey analysts alone, fending for themselves, with only abstract
theoretical explanations to guide their way through an applied statistical
analysis of survey data.
On balance, the discussion in this book will tilt toward proven recipes where theory and practice have demonstrated the value of a specific
approach. In cases where theoretical guidance is less clear, we identify the
uncertainty but still aim to provide advice and recommendations based on
experience and current thinking on best practices.
The chapters of this book are organized to be read in sequence, each
chapter building on material covered in the preceding chapters. Chapter 1
provides important context for the remaining chapters, briefly reviewing historical developments and laying out a step-by-step process for approaching
a survey analysis problem. Chapters 2 through 4 will introduce the reader
to the fundamental features of complex sample designs and demonstrate
how design characteristics such as stratification, clustering, and weighting
are easily incorporated into the statistical methods and software for survey
estimation and inference. Treatment of statistical methods for survey data
analysis begins in Chapters 5 and 6 with coverage of univariate (i.e., singlevariable) descriptive and simple bivariate (i.e., two-variable) analyses of continuous and categorical variables. Chapter 7 presents the linear regression
model for continuous dependent variables. Generalized linear regression
modeling methods for survey data are treated in Chapters 8 and 9. Chapter
10 pertains to methods for event-history analysis of survey data, including
models such as the Cox proportional hazards model and discrete time models. Chapter 11 introduces methods for handling missing data problems in
survey data sets. Finally, the coverage of statistical methods for survey data
analysis concludes in Chapter 12 with a discussion of new developments in
the area of survey applications of advanced statistical techniques, such as
multilevel analysis.
© 2010 by Taylor and Francis Group, LLC
Preface
xvii
To avoid repetition in the coverage of more general topics such as the recommended steps in a regression analysis or testing hypotheses concerning
regression parameters, topics will be introduced as they become relevant
to the specific discussion. For example, the iterative series of steps that we
recommend analysts follow in regression modeling of survey data is introduced in Chapter 7 (linear regression models for continuous outcomes), but
the series applies equally to model specification, estimation, evaluation, and
inference for generalized linear regression models (Chapters 8 and 9). By the
same token, specific details of the appropriate procedures for each step (e.g.,
regression model diagnostics) are covered in the chapter on a specific technique. Readers who use this book primarily as a reference volume will find
cross-references to earlier chapters useful in locating important background
for discussion of specific analysis topics.
There are many quality software choices out there for survey data analysts.
We selected Stata® for all book examples due to its ease of use and flexibility
for survey data analysis, but examples have been replicated to the greatest
extent possible using the SAS®, SPSS®, IVEware, SUDAAN®, R, WesVar®, and
Mplus software packages on the book Web site ( />src/smp/asda/). Appendix A reviews software procedures that are currently
available for the analysis of complex sample survey data in these other major
software systems.
Examples based on the analysis of major survey data sets are routinely used
in this book to demonstrate statistical methods and software applications. To
ensure diversity in sample design and substantive content, example exercises and illustrations are drawn from three major U.S. survey data sets: the
2005–2006 National Health and Nutrition Examination Survey (NHANES);
the 2006 Health and Retirement Study (HRS); and the National Comorbidity
Survey-Replication (NCS-R). A description of each of these survey data sets
is provided in Section 1.3. A series of practical exercises based on these three
data sets are included at the end of each chapter on an analysis topic to provide readers and students with examples enabling practice with using statistical software for applied survey data analysis.
Clear and consistent use of statistical notation is important. Table P.1 provides a summary of the general notational conventions used in this book.
Special notation and symbol representation will be defined as needed for
discussion of specific topics.
The materials and examples presented in the chapters of this book (which
we refer to in subsequent chapters as ASDA) are supplemented through a
companion Web site ( This Web
site provides survey analysts and instructors with additional resources in
the following areas: links to new publications and an updated bibliography
for the survey analysis topics covered in Chapters 5–12; links to sites for
example survey data sets; replication of the command setups and output
for the analysis examples in the SAS, SUDAAN, R, SPSS, and Mplus software systems; answers to frequently asked questions (FAQs); short technical
© 2010 by Taylor and Francis Group, LLC
xviii
Preface
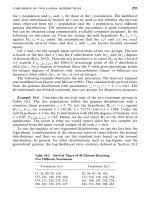
Table P.1
Notational Conventions for Applied Survey Data Analysis
Notation
Properties
α
Standard usage
Standard usage
Subscript
Subscript
i
j, k, l
Subscript
Subscripts
N, n
M, m
h
y, x
Yi , Xi
yi , xi
y, x, Y, X
βj ,γ j
Explanation of Usage
Indices and Limits
Population size, sample size
Subpopulation size, subpopulation sample size
Stratum index (e.g., yh )
Cluster or primary stage unit (PSU) index (e.g.,
yhα )
Element (respondent) index (e.g., yhαi)
Used to index vector or matrix elements (e.g., βj)
Survey Variables and Variable Values
Roman, lowercase,
Survey variables (e.g., systolic blood pressure,
italicized, end of alphabet
mmHg; weight, kg)
Roman, uppercase, end of
True population values of y, x for individual i,
alphabet, subscript
with i = 1,…, N comprising the population
Roman, lowercase, end of
Sample survey observation for individual i (e.g.,
alphabet, subscript
yi = 124.5 mmHg, xi = 80.2 kg)
As above, bold
Vectors (or matrices) of variables or variable
values (e.g., y ={y1, y2,…, yn})
Model Parameters and Estimates
Greek, lowercase
Regression model parameters, subscripts
βˆ j , γˆ j
Greek, lowercase, “^” hat
Estimates of regression model parameters
β , γ , βˆ , γˆ
As above, bold
Bj , bj , B,b
Roman, otherwise as above
Vectors (or matrices) of parameters or estimates
(e.g., β = {β 0 , β1 ,..., β p })
As above but used to distinguish finite
population regression coefficients from
probability model parameters and estimates
Y , P , σ 2y , Sy2 ,
y , p , sy2
Standard usage
Σ , Σˆ
Standard usage
R 2 , r ,ψ
Standard usage
ρy
Greek, lowercase
Variance–covariance matrix; sample estimate of
variance–covariance matrix
Multiple-coefficient of determination (R-squared),
Pearson product moment correlation, odds ratio
Intraclass correlation for variable y
Standard usage
Probability distributions
2
Z, t , χ , F
© 2010 by Taylor and Francis Group, LLC
Statistics and Estimates
Population mean, proportion and variance;
sample estimates as used in Cochran (1977)
Preface
yh
xix
reports related to special topics in applied survey data analysis; and reviews
of statistical software system updates and any resulting changes to the software commands or output for the analysis examples.
In closing, we must certainly acknowledge the many individuals who contributed directly or indirectly in the production of this book. Gail Arnold
provided invaluable technical and organizational assistance throughout the
production and review of the manuscript. Rod Perkins provided exceptional
support in the final stages of manuscript review and preparation. Deborah
Kloska and Lingling Zhang generously gave of their time and statistical expertise to systematically review each chapter as it was prepared. Joe
Kazemi and two anonymous reviewers offered helpful comments on earlier
versions of the introductory chapters, and SunWoong Kim and Azam Khan
also reviewed the more technical material in our chapters for accuracy. We
owe a debt to our many students in the JPSM and MPSM programs who over
the years have studied with us—we only hope that you learned as much from
us as we did from working with you. As lifelong students ourselves, we owe
a debt to our mentors and colleagues who over the years have instilled in us
a passion for statistical teaching and consultation: Leslie Kish, Irene Hess,
Graham Kalton, Morton Brown, Edward Rothman, and Rod Little. Finally,
we wish to thank the support staff at Chapman Hall/CRC Press, especially
Rob Calver and Sarah Morris, for their continued guidance.
Steven G. Heeringa
Brady T. West
Patricia A. Berglund
Ann Arbor, Michigan
© 2010 by Taylor and Francis Group, LLC
1
Applied Survey Data Analysis: Overview
1.1╇ Introduction
Modern society has adopted the survey method as a principal tool for looking at itself—“a telescope on society” in the words of House et al. (2004).
The most common application takes the form of the periodic media surveys
that measure population attitudes and beliefs on current social and political issues:
Recent international reports have said with near certainty that human
activities are the main cause of global warming since 1950. The poll
found that 84 percent of Americans see human activity as at least contributing to warming. (New York Times, April 27, 2007).
One step removed from the media limelight is the use of the survey method
in the realms of marketing and consumer research to measure the preferences, needs, expectations, and experiences of consumers and to translate
these to indices and other statistics that may influence financial markets or
determine quality, reliability, or volume ratings for products as diverse as
automobiles, hotel services, or TV programming:
CBS won the overall title with an 8.8 rating/14 share in primetime, ABC
finished second at 7.7/12…. (, January 11, 2008)
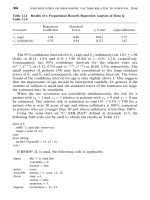
The Index of Consumer Sentiment (see Figure 1.1) fell to 88.4 in the
March 2007 survey from 91.3 in February and 96.9 in January, but it was
nearly identical with the 88.9 recorded last March. (Reuters, University
of Michigan, April 2007)
Also outside the view of most of society is the use of large-scale scientific
surveys to measure labor force participation, earnings and expenditures,
health and health care, commodity stocks and flows, and many other topics. These larger and longer-term programs of survey research are critically important to social scientists, health professionals, policy makers, and
administrators and thus indirectly to society itself.
1
© 2010 by Taylor and Francis Group, LLC
2
Applied Survey Data Analysis
Source: Survey of Consumer Attitudes
Index of Consumer Sentiment
100
50
y0
1
Ja
n
02
Ju
ly
02
Ja
n
03
Ju
ly
03
Ja
n
04
Ju
ly
04
Ja
n
05
Ju
ly
05
Ja
n
06
Ju
ly
06
Ja
n
07
Ju
ly
07
0
01
Ju
l
Ja
n
y0
Ju
l
Ja
n
00
0
Month/Year
Figure€1.1
Index of Consumer Sentiment, January 2000–July 2007.
Real median household income in the United States rose between 2005
and 2006, for the second consecutive year. Household income increased 0.7
percent, from $47,845 to $48,201. (DeNavas-Walt, Proctor, and Smith, 2007)
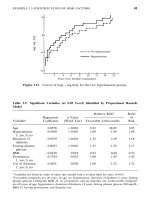
In a series of logistic models that included age and one additional variable (i.e., education, gender, race, or APOE genotype), older age was consistently associated with increased risk of dementia (p < 0.0001). In these
trivariate models, more years of education was associated with lower
risk of dementia (p < 0.0001). There was no significant difference in
dementia risk between males and females (p = 0.26). African Americans
were at greater risk for dementia (p = 0.008). As expected, the presence of
one (Odds Ratio = 2.1; 95% C.I. = 1.45 – 3.07) or two (O.R. = 7.1; 95% C.I. =
2.92 – 17.07) APOE e4 alleles was significantly associated with increased
risk of dementia. (Plassman et al., 2007)
The focus of this book will be on analysis of complex sample survey data
typically seen in large-scale scientific surveys, but the general approach to
survey data analysis and specific statistical methods described here should
apply to all forms of survey data.
To set the historical context for contemporary methodology, Section
1.2 briefly reviews the history of developments in theory and methods
for applied survey data analysis. Section 1.3 provides some needed background on the data sets that will be used for the analysis examples in
Chapters 2–12. This short overview chapter concludes in Section 1.4 with
© 2010 by Taylor and Francis Group, LLC
Applied Survey Data Analysis: Overview
3
a general review of the sequence of steps required in any applied analysis
of survey data.
1.2╇ A Brief History of Applied Survey Data Analysis
Today’s survey data analysts approach a problem armed with substantial
background in statistical survey theory, a literature filled with empirical
results and high-quality software tools for the task at hand. However, before
turning to the best methods currently available for the analysis of survey
data, it is useful to look back at how we arrived at where we are today. The
brief history described here is certainly a selected interpretation, chosen to
emphasize the evolution of probability sampling design and related statistical analysis techniques that are most directly relevant to the material in this
book. Readers interested in a comprehensive review of the history and development of survey research in the United States should see Converse (1987).
Bulmer (2001) provides a more international perspective on the history of
survey research in the social sciences. For the more statistically inclined,
Skinner, Holt, and Smith (1989) provide an excellent review of the development of methods for descriptive and analytical treatment of survey data. A
comprehensive history of the impacts of sampling theory on survey practice
can be found in O’Muircheartaigh and Wong (1981).
1.2.1╇ Key Theoretical Developments
The science of survey sampling, survey data collection methodology, and the
analysis of survey data date back a little more than 100 years. By the end of
the 19th century, an open and international debate established the representative sampling method as a statistically acceptable basis for the collection of
observational data on populations (Kaier, 1895). Over the next 30 years, work
by Bowley (1906), Fisher (1925), and other statisticians developed the role of
randomization in sample selection and large-sample methods for estimation
and statistical inference for simple random sample (SRS) designs.
The early work on the representative method and inference for simple random and stratified random samples culminated in a landmark paper by Jerzy
Neyman (1934), which outlined a cohesive framework for estimation and
inference based on estimated confidence intervals for population quantities
that would be derived from the probability distribution for selected samples
over repeated sampling. Following the publication of Neyman’s paper, there
was a major proliferation of new work on survey sample designs, estimation
of population statistics, and variance estimation required to develop confidence intervals for sample-based inference, or what in more recent times
has been labeled design-based inference (Cochran, 1977; Deming, 1950;
© 2010 by Taylor and Francis Group, LLC
4
Applied Survey Data Analysis
Hansen, Hurwitz, and Madow, 1953; Kish, 1965; Sukatme, 1954; Yates, 1949).
House et al. (2004) credit J. Steven Stock (U.S. Department of Agriculture)
and Lester Frankel (U.S. Bureau of the Census) with the first applications of
area probability sampling methods for household survey data collections.
Even today, the primary techniques for sample design, population estimation, and inference developed by these pioneers and published during the
period 1945–1975 remain the basis for almost all descriptive analysis of survey data.
The developments of the World War II years firmly established the probability sample survey as a tool for describing population characteristics,
beliefs, and attitudes. Based on Neyman’s (1934) theory of inference, survey
sampling pioneers in the United States, Britain, and India developed optimal
methods for sample design, estimators of survey population characteristics,
and confidence intervals for population statistics. As early as the late 1940s,
social scientists led by sociologist Paul Lazarsfeld of Columbia University
began to move beyond using survey data to simply describe populations to
using these data to explore relationships among the measured variables (see
Kendall and Lazarsfeld, 1950; Klein and Morgan, 1951). Skinner et al. (1989)
and others before them labeled these two distinct uses of survey data as
descriptive and analytical. Hyman (1955) used the term explanatory to describe
scientific surveys whose primary purpose was the analytical investigation of
relationships among variables.
During the period 1950–1990, analytical treatments of survey data expanded
as new developments in statistical theory and methods were introduced,
empirically tested, and refined. Important classes of methods that were introduced during this period included log-linear models and related methods
for contingency tables, generalized linear models (e.g., logistic regression),
survival analysis models, general linear mixed models (e.g., hierarchical linear models), structural equation models, and latent variable models. Many
of these new statistical techniques applied the method of maximum likelihood to estimate model parameters and standard errors of the estimates,
assuming that the survey observations were independent observations from
a known probability distribution (e.g., binomial, multinomial, Poisson, product multinomial, normal). As discussed in Chapter 2, data collected under
most contemporary survey designs do not conform to the key assumptions
of these methods.
As Skinner et al. (1989) point out, survey statisticians were aware that
straightforward applications of these new methods to complex sample
survey data could result in underestimates of variances and therefore
could result in biased estimates of confidence intervals and test statistics.
However, except in limited situations of relatively simple designs, exact
determination of the size and nature of the bias (or a potential correction)
were difficult to express analytically. Early investigations of such “design
effects” were primarily empirical studies, comparing design-adjusted
variances for estimates with the variances that would be obtained if the
© 2010 by Taylor and Francis Group, LLC