KINH TẾ VI MÔ Chapter 6 market structure
Bạn đang xem bản rút gọn của tài liệu. Xem và tải ngay bản đầy đủ của tài liệu tại đây (77.1 KB, 14 trang )
CHAPTER 6
MARKET STRUCTURE
Content
Perfect competition
Monopoly
Monopolistic competition
Oligopoly
MARKET STRUCTURE
1. Market
- Where all activities in economy are price-led
MARKET STRUCTURE
MARKET
STRUCTURE
PERFECT
COMPETITION
IMPERFECT
COMPETITION
MONOPOLISTIC
COMPETITION
MONOPOLY
OLIGPOLY
MARKET STRUCTURE
Types of market
Number of suppliers
Products
Entry barrier
Market power
Non-price
competition
Perfect
competition
Monopolistic
competition
Oligopoly
Monopoly
Unlimited
Several
Few
One
Identical
Different
Identical/
Different
Unique
High
Very
high
Strong
Very
strong
None
Low
None
Weak
None
Little
Much
None
I. PERFECT COMPETITION
1.
-
Definition
A type of market where there are unlimited
suppliers and their products are identical
- Examples: Agricultural products ....
PERFECT COMPETITION
2. Characteristics
-
Suppliers are price-taker
No entry barrier
No market power
Symmetric information
No non-price competition (no advertisement)
Not necessary to choose supplier
PERFECT COMPETITION
3. Demand and marginal
revenue curves
-
-
-
Demand curve: parallel
with horizontal axis
Marginal curve: coinciding
with demand curve
P
P =MR = AR
P*
→ MR = P = AR
Q
PERFECT COMPETITION
4. Maximizing profit
ΠMAX: MR=MC
P
MC
In perfect competition: MR = P
⇒
ΠMAX in perfect competition:
P=MR
P*
P=MC
Q*
PERFECT COMPETITION
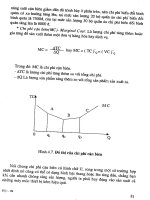
5. Break-even, shut down point
Π = TR – TC = Q (P - ATC)
P> ATCmin → Π > 0 → profit
P= ATCmin → Π = 0 → break-even point
P< ATCmin → Π < 0 → loss
AVCmin< P < ATCmin → continue producing
P < AVCmin → shut down
Q
PERFECT COMPETITION
5. Break-even, shut
down point
P
P> ATCmin
TR = P*AQ*O
TC = OCBQ*
→ Π = P*ABC
MC
ATC
Πmax
A
P*
P=MR
C
B
O
Q*
Q
PERFECT COMPETITION
5. Break-even, shut
down point
P
MC
P= ATCmin
TR = P*AQ*O
TC = P*AQ*O
⇒ Π = 0
⇒ Q*: break-even point
A
ATC
P=MR
P*
O
Q*
Q
PERFECT COMPETITION
5. Break-even, shut
down point
P< ATCmin
P
MC
ATC
-Π
B
C
TR = P*AQ*O
TC = OCBQ*
→ - Π = P*ABC
P=MR
P*
A
O
Q*
Q
PERFECT COMPETITION
5. Break-even, shut
down point
AVCmin < P < ATCmin
P
MC
ATC
B
C
TR = P*AQ*O
TC = OCBQ*
* Continue: Lose - Π = P*ABC
* Stop: Lose FC = BCEF
⇒ FC > - Π
⇒ Continue producing
P*
AVC
A
P=MR
E
F
Q*
Q
PERFECT COMPETITION
5. Break-even, shut down
point
P < AVCmin
TR = P*AQ*O
TC = OCBQ*
* Continue: Lose - Π = P*ABC
* Stop: Lose FC = BCEF
FC < - Π
→ Stop producing
(shut down point)
P
MC
B
ATC
C
AVC
F
E
P*
A
P=MR
O
Q*
Q
PERFECT COMPETITION
6. Supply curve
P
MC
- Coinciding with MC,
but from AVCmin
P=MR
P*
AVC
Q*
Q
PERFECT COMPETITION
7. Producer’s surplus
(PS)
- The area below price
line and above marginal
cost curve
P
MC
P=MR
P*
PS = TR – VC
= Π + FC
PS
Q*
EXERCISE
Total cost function of a perfect competition firm is:
TC = Q2 + Q + 100
a. At P = 27$, state out Q* and ΠMAX
b. State out the break-even point of this firm
c. At P = 9$, should this firm close its business?
d. Show this firm’s supply curve
Q
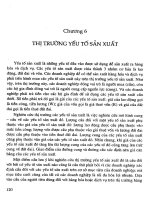
MONOPOLY
1.
-
-
Definition
A type of market where there is only one supplier
and the product is unique
Examples:
2. Reasons of monopoly
-
Economy of scales
Stipulated by government
Owning patterns, license….
Monopoly in inputs
Monopoly in location
MONOPOLY
3. Demand and marginal
revenue curves
-
Demand curve: downward
sloping and relatively steep
-
Marginal revenue curve:
downward sloping, is twice
as steep as the slope of the
demand curve (and the
same intercept)
P = -aQ + b
MR = -2aQ + b
P
MR
D
Q
MONOPOLY
4. Maximizing
profit
P
Πmax: MR=MC
ΠMAX: MR=MC
P*m
MC
ATC
ΠMAX
MR
D
Q*m
Q
MONOPOLY
P
Πmax: MR=MC
P*m>>P*c
Q*m<
MC
P*c
MR
Q*m
Q*c
D
Q
Dead weight loss
Perfect competition
- CS: a+b+c
- PS: d+e
Monopoly:
- CS: a (lose b+c)
- PS: e+b
(gain b, lose d)
Πmax: MR=MC
P
P*m>>P*c
Q*m<
a
P*m
MC
b
b
c
P*c
d
e
→ d+c: Dead weight loss
(DWL)
MR
Q*m
D
Q*c
Q
MONOPOLY
5. Supply curve of a monopolist
P changes, Q is constant
P
P is constant, Q changes
P
MC
P*1
MC
P*
P*2
D2
MR2
D2
MR1
Q*
MR2
D1
D1
MR1
Q
Q*1
Q*2
MONOPOLY
5. Supply curve of a monopolist
-
-
-
No 1:1 relationship between price and
quantity
→ No functional relationship between price
and quantity
→ No supply curve in monopoly
MONOPOLY
6. Market power
-
Found in 1934 by Abba Lerner
L =
-
P − MC
P
(0 ≤ L ≤ 1)
In perfect competition: P = MC → L = 0
The higher value of L is, the stronger market power a firm
can gain
EXERCISE
A monopolist is facing with a demand curve:
P = 18 – 2Q
and total cost function: TC = Q2
a. State out P*, Q* and Π*MAX
b. Government imposes 3$/ unit tax on producer. What is
new P**, Q** and Π**MAX
c. Government imposes a fixed tax amount of 10$ on
producer. Compare P***, Q*** and Π***MAX with P*, Q*
and Π*MAX in question a