Effects of changes in sea surface temperature on migratory spanish mackerel of the coastal current in nha trang bay, 1996 2015
Bạn đang xem bản rút gọn của tài liệu. Xem và tải ngay bản đầy đủ của tài liệu tại đây (2.29 MB, 72 trang )
MINISTRY OF EDUCATION AND TRAINING
NHA TRANG UNIVERSITY
NGUYEN Y VANG
EFFECTS OF CHANGES IN SEA SURFACE TEMPERATURE
ON MIGRATORY SPANISH MACKEREL OF THE COASTAL
CURRENT IN NHA TRANG BAY, 1996 – 2015
MASTER THESIS
NHA TRANG - 2017
MINISTRY OF EDUCATION AND TRAINING
NHA TRANG UNIVERSITY
NGUYEN Y VANG
EFFECTS OF CHANGES IN SEA SURFACE TEMPERATURE ON
MIGRATORY SPANISH MACKEREL OF THE COASTAL CURRENT
IN NHA TRANG BAY, 1996 – 2015
MASTER THESIS
Major:
Marine
Ecosytem
Management
Change
Topic Allocation Decision
Decision on establishing the Committee:
3rd June 2017
Defense date:
Suppervisors:
NGUYEN THI KIM ANH
HENRIK GLENNER
SIGURD STEFANS
Chairman:
LE KIM LONG
Faculty of Graduate Student
QUACH HOAI NAM
NHA TRANG - 2017
and
based
Climate
UNDERTAKING
I undertake that the thesis entitled: “Effects of changes in Sea Surface Temperature
on migratory Spanish mackerel of the coastal current in Nha Trang Bay, 1996
– 2015” is my own work. The work has not been presented elsewhere for assessment
until the time this thesis is submitted.
Khanh Hoa, 28th June 2017
Author
Nguyen Y Vang
i
ACKNOWLEDGMENT
The author acknowledges supporting from the Norwegian Agency for
Development Cooperation (NORAD) for the NORHED Master's Program in Marine
Ecosystem Management and Climate Change.
I acknowledge funding from the Norwegian Agency for Development
Cooperation (NORAD) for my scholarship to follow this master's program.
I would like to express the deepest appreciation to the Faculty of graduate
students of Nha Trang University for helping and giving best conditions as well as
scholarship to finish my thesis. My special thanks go to Prof. Nguyen Thi Kim Anh,
Prof. Henrik Glenner, Prof. Sigurd Stefansson and Prof. Audrey Geffen for the
continuous support of my study and research, for their patience, motivation, enthusiasm,
and immense knowledge. Their guidance helped me in all the time of research and
writing of this thesis.
I deeply thank the Fishing Cooperative Bich Hai and Vietnam National Centre
for Hydrometeorological Forecasting and RDA () for their offers in
collecting data. We are thankful to Mr Huan in using of MapInfo Professional Software
to figure the map of study area. Our gratitude is also extended to Mr. Tan, leader of Bich
Hai set-net fihsery for assisting with data collection without their substantial cooperation and assistance this paper would not have been successful.
Last but not least, I would like to thank my family: my parents and to my brothers
and sister for supporting me spiritually throughout writing this thesis.
Thank you!
Khanh Hoa, 28th June 2017
Author
Nguyen Y Vang
ii
TABLE OF CONTENTS
UNDERTAKING ................................................................................................... i
ACKNOWLEDGMENT ....................................................................................... ii
LIST OF SYMBOLS ............................................................................................ v
LIST OF ABBREVIATIONS .............................................................................. vi
LIST OF TABLES .............................................................................................. vii
LIST OF FIGURES AND GRAPHS ................................................................. viii
ABSTRACT ......................................................................................................... xi
CHAPTER 1. INTRODUCTION ......................................................................... 1
CHAPTER 2. LITERATURE REVIEW .............................................................. 5
CHAPTER 3. RESEARCH METHODOLOGY ................................................ 16
3.2. Data collection.............................................................................................. 17
3.2.1. Secondary data .......................................................................................... 17
3.2.2. Primary data .............................................................................................. 18
3.2.3. Data analysis ............................................................................................. 19
CHAPTER 4. RESULTS AND DISCUSSIONS ................................................ 22
4.1. RESULTS..................................................................................................... 22
4.1.1. Variability of SST during period of 1996 – 2015 ..................................... 22
4.1.2. Changes in landings of Bich Hai Set-net fishery during 1996 to 2015 .... 24
a. Fluctuation in annual landings ........................................................................ 24
b. Inter-annual fluctuations in average landings calculated for fishing months . 25
4.1.3. Variations in weight individual of Mackerel during study period ............ 27
a. Fluctuations in annual average weight individual ........................................... 27
b. Occurrence of several individual sizes in weight in the catches. .................... 29
iii
4.1.4. Correlation between SST and landings of Spanish Mackerel ................... 30
a. Between SST and landings based on annual calculation ................................ 30
b. Between SST and Landings calculated for several months. ........................... 31
4.1.5. Effect of changes in SST on Spanish Mackerel body-sizes...................... 33
a. Effect of changes in inter-annual average SST on average individual
weight. ................................................................................................................. 33
c. Effects of changes in annual average SST on different mackerel body sizes . 34
4.2. DISCUSSIONS ............................................................................................ 36
CHAPTER 4. CONCLUSIONS AND RECOMMENDATIONS ...................... 43
4.1. CONCLUSIONS .......................................................................................... 43
4.2. RECOMMENDATIONS ............................................................................. 43
REFERENCES .................................................................................................... 45
APPENDICES ..................................................................................................... 50
iv
LIST OF SYMBOLS
r: coefficient of correlation Pearson
p-value: Probability value (<0,05)
Kg: Kilogram
D: coefficient of net
v
LIST OF ABBREVIATIONS
AVHRR: Advanced Very High Resolution Radiometer
CPUE: Catch Per unit Effort
EDF: Environmental Defense Fund
EPA: Environmental Protection Agency of United States
FAO: Food and Agriculture Organization
MODIS: Moderate Resolution Imaging Spectroradiomater
NASA: National Aeronautics and Space Administration
NEFSC: Northeast Fisheries Science Center
NSW: New South Wales
NOAA: National Oceanic and Atmospheric Administration
PE: Polyethylene
SEAFDEC: Southeast Asian Fisheries Development center
US: United States
RDA: Research Data Archive
SST: Sea Surface Temperature
vi
LIST OF TABLES
Table 4.1. The parameters of ANOVA statistic for trends of eight months from Feb to
Sep in Nha Trang Bay. ..................................................................................................23
Table 4.2. Parameters of the trends calculated for eight months (from Feb to Sep). ...26
Table 4.3. Basically statistics of SPSS analysis for weight individual in details present
by months (from Feb to Sep). ........................................................................................28
Table 4.4. The coefficients (r, p) of regression analysis for two variables consist of
average SST and landings based month (from Feb to Sep). .........................................31
Table 4.5. Parameters (Function, r and p-value) of correlation analysis for variability of
monthly average SST and %IRI of each body-sizes. ....................................................34
vii
LIST OF FIGURES AND GRAPHS
Figure 1.1. Map of Spanish mackerel shared stock in Southeast Asia ...........................2
Figure 1.2. Narrow Spanish mackerel ............................................................................3
Figure 2.1. Structure of set-net fisheries used to capture in Nha Trang Bay .................5
Figure 2.2. Catch processing of set-net fishery at Bich Dam Island ..............................6
Figure 2.3. Average Global SST, 1880 – 2014 ..............................................................7
Figure 2.4. Change in SST, 1901 – 2014 .......................................................................7
Figure 3.1. Map of Nha Trang Bay where puts the Bich Hai set-net fishery ...............16
Figure 3.2. Map of whole coastal water that received monthly average SST data from
RDA covered grid of 10 x 10 resolution........................................................................18
Figure 3.3. Devices to directly collect SST data on Bich Hai set-net fishery ..............19
Figure 4.1. Distribution of SST at set-net fishery are lower than the SST in outside ..41
Figure 4.2. Distribution of SST at set-net fishery are higher than the SST in outside. 42
Graph 3.1. The temperature recorded at three water levels: surface, middle and bottom.
.......................................................................................................................................19
Graph 4.1. Long term (1996 - 2015) mean SST variability (0C) recorded in Nha Trang
Bay. These data were recorded at Station of Meteorology Center which located in Nha
Trang Bay adjacent Bich Hai set-net fishery. ................................................................22
Graph 4.2. The upward trends of SST several months of year experienced during 1996
to 2015. Figure (a) illustrated the upward trend of Feb; upward trend of Mar (b); upward
trend of April (c); upward trend of May (d); upward trend of June (e); upward trend of
July (f); upward trend of Aug (g); upward trend of Sep (h). .........................................24
Graph 4.3. Long term (1996 - 2015) mean landings variations (Kg) of Bich Hai set-net
fishery located in Nha Trang Bay. .................................................................................25
Graph 4.4. The downward trends of landing of several months experienced during 1996
to 2015. Figure (a) illustrated the downward trend of Feb; downward trend of Mar (b);
viii
downward trend of April (c); downward trend of May (d); downward trend of June (e);
downward trend of July (f); downward trend of Aug (g); downward trend of Sep (h).27
Graph 4.5. Yearly fluctuation of average weight individual during 1996 to 2015. The
downward trend is present by the regression equation: y = -0,0373x + 2,7807, p =
0,0005. ...........................................................................................................................28
Graph 4.6. The proportions of three Mackerel body-size in catches of set-net fishery,
including the small size, medium size and large size ....................................................29
Graph 4.7. Annual variability of average landings and average SST ..........................30
Graph 4.8. The cross-plot illustrated the relationship between landings and SST in a 20year period. The regression equation: Y1 = -17548,7*X1 + 505791,7 and correlation
coefficients of r = -0,657; p=0,001. .................................................................................31
Graph 4.9. The Correlation between landings and SST exanimated for several months
during 1996 to 2015. the negative correlation illustrated in Feb (a) and May (d) and Sep
(h); No correlation in Mar (b) and April (c); negative correlation in; Significant negative
correlation in June (e), July (f) and Aug (g); ..................................................................32
Graph 4.10. The variability of inter-annual average SST (Nha Trang station) and
average weight individual in the 20-year period. ..........................................................33
Graph 4.11. Significant negative relationship between annual average SST and average
weight individual based on yearly during study period. Regression equation: Y3 = 0,9077*X1 + 29,189 and coefficients of r = -0,796; p < 0.001. ....................................34
Graph 4.12. Significant positive relationship between monthly average SST and
frequency of mackerel body-size of <2,0kgs. Regression equation: y = 25,644X1 –
671,823, and r = 0,458; p = 0,021. ................................................................................35
Graph 4.13. Significant negative correlation between monthly average SST and
frequency of mackerel body-size ranged from 2,0kgs to 4,0kgs. Regression equation: y
= -21,570X1 + 654,638 and r = -0,413, p=0,035. .........................................................35
Graph 4.14. The Significant negative relationship between monthly average SST and
frequency of mackerel body-size ranged > 4,0kgs. Regression equation: Y6 = -4,072*X1
+ 117,150 and r = - 0,413, p=0,035. ..............................................................................35
ix
Graph 4.15. The data of SST obtained from two sources. The red line illustrated the
variability of SST derived from RDA website for entire Coastal water of Nha Trang.
Another line present those of Nha Trang station. ..........................................................36
Graph 4.16. Relationship between mean SST of RDA’s dataset and mean SST of Nha
Trang station in a 20-year period. Regression equation: y = 0,5104x + 13,907,
coefficients of r = 0,576 and p=0,004. ..........................................................................37
Graph 4.17. Frequency of several sizes occurred in monthly average landings .........39
x
ABSTRACT
Climate change has been affecting marine ecosystems over the world in recent
decades. One of migratory pelagic species, Spanish mackerel of which distribution
changed under changes in Sea Surface Temperature (SST), had a decline in landings
observed in Nha Trang Bay in recent years. This study investigated the reduction in
annual landings of mackerel during 1996 to 2015 in relation to SST with two
hypotheses: (1) A rise in sea surface temperature reduces the landings of Spanish
mackerel; (2) The effect of a rise SST on Spanish mackerel is body size dependent. Data
collections included catches in corresponding to SST in recent 20 years as well as catch
samples in the field. A Simple Linear Regression Model was used to test the SSTlandings associations. The results showed a significant negative correlation between
annual average SST and annual landings (r= -0,681; p-value = 0,001). In relationship
between SST and various mackerel body sizes, the annual average SST has a positive
correlation with small size (less than 2,0kg) with coefficient of r = 0,508 and p-value =
0,01, while the medium (2,0-4,0kg) and large size (higher than 4,0kg) showed the
significant negative correlation with the same coefficient of r = -0,413 and pvalue=0,035. Results provided the prediction that the impacts of changes in SST might
make more difficult for set-net fisheries in Nha Trang Bay to find and catch Spanish
mackerel.
Keywords: Climate change, Set-net fisheries, SST, Migratory Spanish mackerel
xi
CHAPTER 1. INTRODUCTION
Climate change have been affecting on marine ecosystem very clear and dramatic
(EDF, 2013). In term of climate driven, increases in Sea Surface Temperature (SST) had
the significant impacts on coastal waters where have high biology such as the
distribution and abundant of species, respect to pelagic species (Radlinski, 2013).
Migratory species, for instance, which have a long distance moving are very sensitive
to the changes in upon temperature (Smith, 1985). One of whom, migratory mackerel
species has strong response under increases in SST as was the shifts to preferred
temperature areas (NOAA, 2015). In northeast coast of United States, Atlantic mackerel
dispersed when SST rose (Radlinski, 2013) and occurred in the areas with SST ranged
from 7 – 80C (Goode, 1884), while this species appeared in waters had about 40C in
Northern Gulf of St. Lawrence (Castonguay et al., 1992). By contrast with Senegalese
waters, the landings of horse mackerel were highest in winter when average SST was
lowest value (Diankha et al., 2015).
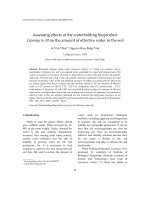
Spanish mackerel (Scomberomorus commerson) mainly distributed where
include inshore waters of Indo-Pacific with two moving circles, one way is from Red
Sea and South Africa to Southeast Asia, another way is from North to China and Japan
(Status of fisheries resources in NSW, 2008) (Figure 1.1). This species moves on coastal
waters of Southeast Asia as predator of small fish such as anchovies, squid as well as
prawns from Feb to Sep when have higher intensity of prey (Queensland fisheries, 2008;
Vo Dieu, 2009). This moving provides the vast majority of commercial production for
countries, including Malaysia, Singapore, Brunei, Thailand Gulf, Vietnam and China and
annual estimated quantity is up to 25,000 tones. Because of narrow berried species
(FAO/SEAFDEC, 1985), even though FAO and SEAFDEC had regulation to manage
this species, stock assessment is also lack of information as well as effecting of
environment conditions.
In Vietnam, by fisherman monitoring who directly capture Spanish mackerel
stock in coastal waters, this species moves along coastal waters at the first time of several
years after a long migration in recent decades. Amount of quantity bycatch of gillnets,
purse seines net and set-net fisheries typically ranged the length from 620mm to 100mm
1
with three particular sizes, including 660mm, 760mm and 800 – 100mm and the second
size is the most popular in annual catch with the ages estimated from 2 to 3 years old
(Phan et al, 2003).
The track of migratory
Spanish mackerel moving on
coastal waters of Vietnam
Figure 1.1. Map of Spanish mackerel shared stock in Southeast Asia
(Source: FAO/SEAFDEC Workshop On Shared Stock In Southeast Asia, 1985)
In Khanh Hoa province, Spanish mackerel stock annually typically occurs from
Feb to Sep with high density. This species was mainly captured by set-net fisheries
which have been existing in a long time unchanged about site, traditional structure, mess
sizes and fishing processing. The main species which were captured by set-net fisheries
in Khanh Hoa province included Spanish mackerel, swordfish, skipjack, therein, the
landings of Spanish mackerel has high proportion and provided about 150 tones per year
(Khanh Hoa fisheries, 2010). These contributions are not only playing an important role
in fishing community as was improving their livelihood, these are also the main part of
food chain of biodiversity in coastal waters in order to develop the friendly fisheries.
One of five set-net fisheries in Nha Trang Bay since 1960s named Bich Hai fishery
2
which was created and operated by fisherman group who voluntarily offer their capital
together. This is like other set-net fisheries in coastal water of Khanh Hoa.
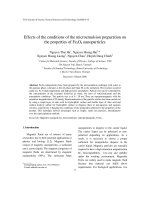
Figure 1.2. Narrow Spanish mackerel
(Source: Queensland fisheries, 2008)
From the temporary observations on Bich Hai set-net fishery, however, it is the
fact that the landings of Spanish mackerel had significant decrease during recent five
years in the catches, from 29,4 tons in 2011 to 2,6 tons in 2015 (Khanh Hoa fisheries,
2015; Nguyen Y Vang, 2013). In comparison with another species in the catches, most
of whom were increased in different degrees, such as skipjack, swordfish and others.
While there are a lot of evidence from previous studies indicated a significant correlation
between distribution of mackerel species and changes in SST as well as forecasting the
fishing ground to catch this species almost coastal waters, there is a lack of information
for those situation in catches of set-net fisheries. Because of which is one of mackerel
species, its behavior is sensitive to environmental conditions, respect to SST. Therefore,
it is necessary to know that whether variability of SST affected the landings of Spanish
mackerel in Nha Trang Bay as was shifting their life history where they typically were
captured in a long time to other places in which they were unavailable to set-net fisheries
or other environmental conditions.
Due to both changes in distribution and body size of fish have impacts on fish
stock (Overholtz et al., 2011). In particular, the purpose of this research is to determine
the possible relationship between Sea Surface Temperature variations and inter-annual
3
variability in landings of mackerel. Furthermore, we also tested the reaction of Spanish
mackerel in different body sizes to changes in SST. Those were totally answered by
which two primary hypotheses were tested: (1) A rise in sea surface temperature
reduces the annual landings of Spanish mackerel; (2) The effect of a rise SST on Spanish
mackerel vary among mackerel body sizes. Relevant to hypothesis (1), from the
phenomenon occurred in Nha Trang Bay above, the finding is expected to the fact that
the SST rise in recent 20 years is the cause of decline in annual landings of Spanish
mackerel. For hypothesis (2), it further assesses the frequency of each body size varies
among different sizes of Spanish mackerel. These findings are the cornerstone to
continue to research the distributions of mackerel when this species moves out of Nha
Trang Bay. By doing this, the forecasting of Spanish mackerel distribution will be
improved as well as the seasonal fishing and appropriated fishing gears to catch this
migrant species.
4
CHAPTER 2. LITERATURE REVIEW
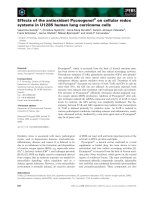
Set-net fisheries
Even though there are significant changes in structure of set-net fishing
technology and popular using in Asian area such as Thailand and Taiwan, there are no
changes in traditional set-net fisheries in Vietnam. This structure of traditional set-net
which has kept a long time is the Japanese –type set-net introduced to Southeast Asia in
the late 1990s (Munprasit et al., 2012). As was a completed passive fishing gear, this
traditional structure is being used in coastal waters of Khanh Hoa province simply
consists of three parts, including main leader net, sub-leader net, chamber. These are
located at selected site by anchors and main buoys. The main leader net is rectangular
aspect with net mess size of 250mm PE 210D/90. In contrast with the sub-leader, while its
mess size of net is smaller with index of 120mm PE 210D/90, this size is also designed for
chamber of set-net. These are linked to frame ropes with the probability compact of 0.6
(Figure 2.1).
2
3
4
1
5
Figure 3.1. Structure of set-net fisheries used to capture in Nha Trang Bay
(1-Main leader; 2-sub-leader; 3-chamber; 4-Main Buoy; 5-anchor)
5
The principle of set-net fishery is to block the migratory fish stock and tend their
moving along the main leader on chamber to catch them. Typically, the sites of set-net
fisheries are far from beach areas about 12 nautical miles with geographic characteristic
of environment conditions that attracted migratory species (Laongmanee et al., 2005).
In Khanh Hoa province, Vietnam, set-net fisheries typically set of five sites around Nha
Trang Bay within coastal waters of Khanh Hoa province far from beach from 5 to 7
nautical miles where migratory species annually move on, including skipjack,
swordfish, Spanish mackerel and other tuna species without fishing effort and quota
regulations (Phan et al., 2003; Phu, 2017). These sites are located in depth ranged from
20 to 30m and current with speed of 2 to 4m/sec. Set-net fishery activities occur from
Feb to Sep, excepted three months at the end of the year had considerably storms or
strong Northeast monsoon. Since 1990s, this fishing gear was encouraged to develop in
Nha Trang Bay by Khanh Hoa’ fisheries management as a way to protect environment
and coastal resources.
Figure 4.2. Catch processing of set-net fishery at Bich Dam Island
Sea Surface Temperature
Sea Surface Temperature which is an important physical component of the ocean
has been consistently increasing during 1880 to 2015 with average rate of 0.170C per
decade (NOAA, 2015). These changes are due either to long-term changes in heat input
associated with global and regional warming (Levitus et al., 2012), or due to changes in
circulation patterns (e.g. strength and location of the North Atlantic sub-polar gyre;
Hatun et al., 2009). For example, Trenberth et al., (2007) observed from 1901 to 2005,
6
the average ocean surface temperature increased 0.74°C. In Southern East China Sea,
Liu and Zhang (2013) indicated that the SST had an increase of 0.56±0.11°C per decade
during period of 1982 – 2001. Supporting to future of SST scenario, the ocean water
temperature upper 80m depth is expected to rise by 0.5°C in 2035, especially the size of
Warm Pool (as defined by the 29°C isotherm) is expected to increase by 230 – 250% by
2035 under some places in Tropical Pacific Ocean.
General Impacts of SST on marine organisms
Depending on different geographical regions, SST can affect on marine
organisms including distributions, assemblage and composition, body-size of fish,
especially with respect to coastal habitat (Cushing, 1982; Glantz, 1992; Bell et al., 2011;
Ganachaud et al., 2012; Cheung et al., 2013; Hsueh-Jung Lu et al., 2014). Furthermore,
the effects of climate change were also found on the population and body size of
migratory species, therein mackerel which are very sensitive with changes in SST on
worldwide (Radlinski et al., 2013).
Figure 5.3. Average Global SST, 1880 – 2014
Figure 6.4. Change in SST, 1901 – 2014
(Source: www.epa.gov/climatechange/indicators - Updated June 2015)
Prior to changes in distribution of marine organism in response to changes in
SST, having said that ocean temperature rise changed their first living areas, coastal
waters assemblage to different ways such as shifting to the north, east, various depth
and both of those (Overholtz et al., 2011). Those biogeography shifting were highly
depended on behavior of several species in responding to the range of temperature (Nye
et al., 2011). Taking example is one study in Northeast United State continental shelf
where has shown a highlighted change in distributed marine fish with 36 species under
7
oceanographic changes with respect to SST changes (Nye et al., 2011; Overholtz et al.,
2011). The study revealed that while some stocks located at increasing depths, many of
those species were showed the poleward shifts. These results are also supported by
Southward et al (1995), a case study for distribution of fish under global warming in
Southwest Britain. This finding indicated that the latitudinal moving of zooplankton is
the cause of pole ward shifting of pelagic fish ranged 120 miles over seventy years from
early 1920s to 1980s in responding to fluctuations of climatic warming. These patterns
were also predicted that in next 50 years, the rising of temperature of 20C will be
expected to latitudinal shift of 200 – 400 miles. Another case study of Greenland water,
Mackenzie et al., (2014) reveals that most of species shifts were be so far involved in
small species at lower trophic level as much as the entering of large predator fish species
into high latitude subpolar including Bluefin tuna (Thunnus thynnus) and Atlantic
mackerel (Scomber scombrus) long time ago.
In contrast to tropical Pacific Island countries, the shift of pelagic fish in
corresponding to changes in SST are different between regions. In the expansion of the
warm pool and contraction of the Pacific Equatorial Divergence (PEQD) province, tuna
is one of popular pelagic species had shift to the East under changes in ocean current
and temperature (Lehodey et al., 1997; Bell et al., 2013). This case is due to the changes
in environmental conditions altered distributed place of zooplankton which attracted the
small fish as were the main feeding of Tuna to offshore where has preferred temperature.
In comparison with the Northeast Pacific, the pattern is reversed. From observation the
moving of zooplankton to North under warming, Zhang Da-juan et al., (2010) found the
northward extending of both of pelagic and benthic – pelagic species. These findings
were the fundamental research for Cheung et al., (2014) to use the three different Earth
System Models illustrated for the future changes in distribution of 28 species in this
area. These indicated that from 2000 to 2050, these study species are expected to shift
poleward with average distance rate of 30.1±2.34 (S.E) km per decade. Scientists also
resulted that in scenario of distribution, the structure of pelagic species may change
considerably in different regions in corresponding to changes in SST altered the fishing
seasons. This finding is similar to the result of studies being carried out by Ching-Hsien
Ho et al., (2014) and Hsueh-Jung Lu et al., (2014) for Tung Ao Bay in Taiwan coastal
8
waters. They showed that the sample catches by set-net fishery changed in both
distribution and structure of cold-water and warm water fish and in timing of fishing
seasons.
In addition to impacts of changes in sea surface temperature on marine fish, the
assemblage, composition and seasonality of occurrence of fish were also changed in
different ways, especially with respect to coastal waters. On the one side, having said
that those changes are likely positive, on the other side, these are inverse. Supporting
the first case, in the inshore areas of Mexican Central Pacific, the assemblage of some
species was sudden increased by SST anomaly during El Nino event occurred from 1998
to 2000 (Godínez-Domínguez et al., 2000). By observations from small Gill net fishery,
at the end of an El Nino episode the seasonality of occurrence of inshore communities
were changed and some uncommon species were more unusually abundant.
Furthermore, this study resulted that during El Nino episode, the species richness was
higher than the non-anomalous year. Another case found that the current regimes which
bring the typical abundance of coastal species have been effected by ocean warming.
This leads to impacts of SST variations on assemblage, seasonality and structure of fish
because of changes in food web and nutrient processing which attracted species richness
(Kuang-Yao Hsia et al., 2004). This is supported by a case study in Japan Sea where has
the Tsushima Warm Current that build the high biodiversity in coastal water based on
cold and warm species. By experiment of CPUE on two bottom trawl fisheries, Tian et
al., (2011) indicated that meanwhile SST rise had negative impact on cold water
demersal species, the warm demersal species were preferred when have increased in
biomass and distribution during warming 1990s.
In relation to impacts of warming on seasonality of coastal species, Ching-Hsien
Ho et al., (2016) had monitored the coastal stock that changed their attention between
seasons in coastal water of Taiwan. As a result of increase in SST, the winter and spring
species decreased dramatically year after year, while summer and autumn species became
dominant in the sample catches. Together with Hsueh-Jung Lu et al., (2012), this study
agreed that changes in seasonal fishing in coastal areas are likely not effected by
anthropogenic activities. These were coincided with the trend of SST variations.
9
Effects of changes in SST on mackerel
Among the species which have been effected by annual SST changes is mackerel.
With a wide range moving this species is very vulnerable to water temperature variations
(Overholtz et al., 2011; Radlinski et al., 2013; Diankha et al., 2015). By different ways,
many scientists reveal that the response of mackerel to climate variability varied
between different species and different regions all over the world. SST variations
obviously impact on seasonal migration, changes in distribution, preferred temperature,
fluctuated landings and body-sizes of mackerel (Studholme et al., 1999). These, in turn,
suggested that both positive and negative relationship between SST variations and
presence of mackerel.
SST and distribution of mackerel
Priority of SST variations impacts on mackerel is changes in distribution. This
leads to change the historical life either to mean latitude or depth or both (Perry et al.,
2005). In 2013, Harding et al., carried out in the Northern Ocean to conduct that under
effects of warming, the horse mackerel declined in average length at all significant
latitudes over 30 years (1977 - 2007). From the collected data in the field during that
period, horse mackerel displayed a shift toward higher proportions of individuals in 56%
of cells, whilst it was only 22% of no response and 22% of cells shifted towards higher
proportions of larger individual. In the inshore waters of Canada, Atlantic mackerel is
also recorded its occurrence in period from 2002 to 2013 under water warming by Jørgen
Berge et al., (2013). This finding indicated that in Svalbar, the occurrence of Atlantic
mackerel has changes following northward into the Arctic in each summer. In addition,
in term of changes in environmental gradients impacts on abundance and assemblage of
fish in the Archipelago areas were also concerned when there were different occurrence
of fish in these areas with their various temperatures. Martin Snickars et al., (2009)
conducted that in coast of Sweden with different thresholds of sea surface temperature,
the fish assemblage is also different in nine selected habitats.
SST and changes in preferred temperature
Those distributions of mackerel might be associated with changes in the ranges
of preferred SST. That means under SST variations, mackerel distributed to the places
10
where have proper temperature to survive. The appropriated ranges of SST of mackerel
depended on geographical regions. While Atlantic mackerel which has a historical life
in Atlantic Ocean has moved on North Sea where SST ranges from 50C to 160C
(Studholme et al., 1999; Olla et al., 1976), Castonguay et al., (2001), however, found
the preferred temperature for spawning of mackerel in the Gulf of St Lawrence is 2,80C.
This finding also indicated that this reasonable temperature is subordinated to the
reproductive needs. These were different with the temperature value which mackerel
distributed in Norway Sea. The samples implemented on large pelagic trawl supporting
Nøttestad et al., (2015) resulted that in Southwest region of Norway Sea, there were
majority of mackerel school swam above the depth where temperature stood by
thermocline of 70C and all mackerel stock occurred in warm water than 60C.
Furthermore, in Northwest region of Norway Sea, the preferred temperature of mackerel
was expected to 80C and optimal value is 6,80C. Another study by Castillo et al., (1996)
in Chile showed the different seasons in corresponding to ranges of SST, the frequency
of mackerel varied in catches.
Relationship between SST and landing of mackerel
Changes in distribution and body size of mackerel by changes in SST are able to
change their landings with different degrees. Given suggestion that there were a
significant relationship between SST and landings of mackerel. This is due to either the
moving of this species on different places to avoid the SST anomaly or replacing its
recruitment areas respected to spawning to preferred temperature (Studholme et al.,
1999; Jansen, 2014). In Senegal waters of Indonesia Ocean, Diankha et al., (2015)
figured the correlation between SST and landings of mackerel during 1999 to 2009. As
a result of study, SST had significant negative relationship with landings of horse
mackerel. That means the decreasing in landings coincided with increasing in SST
during period study. Furthermore, these researchers also compared between landings in
summer in which had highest average SST and winter with lowest SST. The result
indicated that landings by summer were always higher than those in winter between
1999 and 2009. Another study by Radlinski et al., (2013) for northwest coast of United
States also determined that landings of Atlantic mackerel had negative correlations with
in SST anomaly from 1985 to 1999 focused on several Marchs. For example, Landings
11
of Atlantic mackerel was caught in deeper water when SST higher than average value,
while those was landed in shallower waters corresponding to SST lower than the
average. Fluctuations of ladings are also related to potential of recruitment effected by
environmental conditions through changes in spawning areas (Jansen and Gislason,
2013). A reduction in spawning of mackerel in North Sea was because of unfavorable
temperature variations including warming and cooling period leading to changes in
spawning distribution (Jansen, 2014).
In order to analyze those relationships, recent studies suggested that the main
reasons of those might be changes in zooplankton and some species as main feeding
resources of mackerel associated with SST variations (Nøttestad et al.,2015; Plourde et
al., 2015). These environmental condition controlled the spatial distributions of prey
species where had high abundant attracted such pelagic predations stock, especially with
respect to mackerel (Snickars et al., 2014; Robert et al., 2009). Nøttestad et al., (2015),
a study in Norway Sea, for example, generally found the swimming course of mackerel
is directly toward active feeding moving. This supported that in all of regional samples,
the largest fish stock was caught in which had the highest concentration of zooplankton
associated with lowest SST. Trenkel et al., (2014) also reported spawning mackerel
stock changed their life history from spawning grounds to nursery and feeding areas as
well as the opportunist feeders mackerel generally needed such as amphipods, pelagic
bivalves and others (Olafsdottir et al., 2015).
Additionally, other research groups had investigated the depending of mackerel
assemblage on chlorophyll-A concentration related to impacts of SST variation. This is
due to that SST variability had inverse relationship with chlorophyll-A associated with
monsoons, current and depth (Nurdin et al., 2016). This negative relationship is also
illustrated that during Southeast monsoon in the Archipelagic waters of Spermonde
Indonesia, the Chlorophyll-A concentrations reached highest value by Aug in
corresponding to lowest SST, while in Northwest monsoon, this pattern is inverse.
Semedi et al., (2009) used MODIS data to monitor the Chlorophyll-A distributions
under effects of SST variability in Makassar Strait during 2000 to 2007. This provided
the information of ranges of SST appropriated with distributing of Chlorophyll-A. These
results supported implementing of recent studies to investigate the mackerel fishing
12