www.tinhgiac.com Allegro Constraint Manager User Guide Generating and Viewing Constraints Differences
Bạn đang xem bản rút gọn của tài liệu. Xem và tải ngay bản đầy đủ của tài liệu tại đây (503.38 KB, 12 trang )
Allegro® Constraint Manager User Guide
8
Generating and Viewing Constraints
Differences
Topics in this chapter include
Generating Constraint Difference Report
Viewing Constraint Difference Report
Representing Constraint Difference
Generating Constraint Difference Report
Managing design difference is critical to deliver a quality product with today's complex
PCB/SIP designs. Design differences include connectivity (logical), implementation (physical),
and constraint changes.
Comparing Constraints using Differencing Utility
A utility is provided to compare two databases for constraint differences. You can select any of
the listed databases and compare them for constraint differences:
Schematic database (.cpm)
Layout database (.brd, .sip, .mcm)
Constraints Manager Database (.dcf, .tcf)
1
This utility also compares
two different versions of the schematic databases.
two different versions of the layout databases.
the schematic database with the layout database.
To compare the constraints, complete the following steps:
1. Run command cmDiffUtility.
The Cadence Constraints Differencing Utility dialog box is displayed.
2. Click the browser button to select the databases.
The file selection dialog box is displayed. The files are displayed based on the file type filter.
By default the filter is set to Constraints Files (.dcf,.tcf).
3. Click Compare Files.
The comparison starts and a report is generated.
Comparing Constraints using Allegro PCB Designer
You can compare constraint values from technology files in Allegro PCB Designer.
To generate the Constraint Differences, complete the following steps:
1. Choose File - Import - Constraints or File - Import - Technology file
2. The Import Constraints dialog box is displayed. Select Report Only check-box for
generating the constraint difference report.
3. Choose and open the .dcf file to compare.
2
The Constraint Report is displayed.
Viewing Constraint Difference Report
You can open the report in a built-in report viewer.
The report viewer supports a simple, intuitive graphical user interface for displaying constraint
differences between the two databases.This viewer consists of a toolbar, and view window.
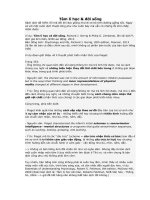
Report Viewer Toolbar
The figure below displays the report viewer toolbar.
3
The table below describes the function of each tool button.
Table 8-1 Constraint Difference Report: Toolbar Description
Tools
Function
Previous Selection
shows previous view of the report
Next Selection
shows next view of the report
Export report to HTML
export report as HTML page
Print Preview
shows printer-friendly view of the report
Close Window
closes the report viewer
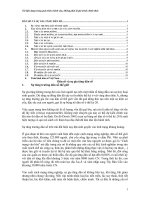
Exporting Report as HTML
You can export to share the constraint difference report as an HTML page.
1. Choose Export report to HTML from toolbar.
4
The Export Report dialog box is displayed.
2. Browse the directory to save the exported.
3. Specify the report folder name and choose OK.
The HTML page of the report is generated.
Note: You can open the HTML report page in any browser.
Printing Report
To print the report complete following steps:
1. Choose Print Preview from the toolbar.
5
6
The printer view is displayed for review.
2. Choose Send to printer for printing the report.
Representing Constraint Difference
The Constraint Difference Report viewer is a two-frame, tree-view based representation.
You can navigate in the report by using following modes:
Navigation Mode
Function
By Tree-view
shows summary of the selected node in the tree-view
By following Links
shows summary of an object when selected the object name
link
By previous and next selections show selections made forward and backward in the report
viewer
Viewing per-layer and array Changes
The Constraint Difference Report for per -layer changes is displayed.
7
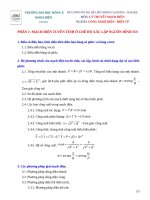
View Modes
There are three viewing modes:
Status/Summary only (S)
Shows description only with the number of changes.
8
Differences only(D)
Shows Destination and Source constraints for each attribute.
Unchanged layers are not shown.
9
All values(A)
Shows constraint at Destination and Source for all layers
10
Return to top of page
For support, see Cadence Online Support service.
Copyright © 2012, Cadence Design Systems, Inc.
All rights reserved.
11
12