DSpace at VNU: Direct Measurement of Silver Anoparticles Suspended in Aqueous Solution by Liquid Electrode Plasma - Atomic Emission Spectrometry
Bạn đang xem bản rút gọn của tài liệu. Xem và tải ngay bản đầy đủ của tài liệu tại đây (482.9 KB, 6 trang )
VNU Journal of Science: Earth and Environmental Sciences, Vol. 33, No. 3 (2017) 23-28
Direct Measurement of Silver Nanoparticles Suspended
in Aqueous Solution by Liquid Electrode Plasma - Atomic
Emission Spectrometry
Le Van Chieu1,*, Nguyen Hoang Tung2
1
VNU Project Management Department, 144 Xuan Thuy, Cau Giay, Hanoi, Vietnam
Institute of Environmental Technology, Vietnam Academy of Science and Technology (VAST),
18 Hoang Quoc Viet, Cau Giay, Hanoi, Vietnam
2
Received 10 August 2017
Revised 17 August 2017; Accepted 22 September 2017
Abstract: This paper presents a quantitative measurement of silver nanoparticles in aqueous suspension
by liquid electrode plasma atomic emission spectrometry (LEP-AES). The dependence of the LEP-AES
signal intensity on voltage-pulse height and duration was investigated. The detection limit and
coefficient of variation (CV) were also measured. The CV attained a minimum value of 7% for a pulse
height of 1080 V and a pulse duration of 7 ms. The detection limit (3σ) of silver nanoparticles by LEPAES, under these optimal conditions, was calculated from a calibration curve to be 0.23 µg/g.
Keywords: Silver nanoparticle, quantitative measurement, liquid electrode plasma, atomic emission
spectrometry.
1. Introduction
has been demonstrated [2], and that of Cd2+ ions
to a precision of 0.3 ppm has been reported. In
addition, Pb and Cu were also investigated by
LEP-AES with the detection limits of 4 and 0.52
µg/L, respectively [3]. The principle of the LEPAES is illustrated in figure 1.
The quantitative analysis of the different
elements can be performed by measuring the
intensities of their characteristic emission peaks.
On the other hand, detecting metallic elements in
a solid-state environment is also of interest for its
potential for nanoparticle (NP) science
applications. Various techniques such as atomic
absorption spectroscopy (AAS), inductively
coupled plasma mass spectrometry (ICP-MS),
and inductively coupled plasma atomic emission
spectrometry (ICP-AES) can yield quantitative
measurements of NPs.
There is an increasing demand for a compact
analysis system that would be capable of
measuring the concentration of elements in
solution; correspondingly, several miniaturized
plasma-based approaches have been reported
recently [1-5]. Among these, liquid electrode
plasma atomic emission spectroscopy (LEPAES) has emerged as a simple and highly
sensitive analysis method for detecting elements
in aqueous solution [6-9]. This handheld device
is easy to use. The detection of metallic ions
such as Na+ and Li+ ions dissolved in nitric acid
_______
Corresponding author. Tel.: 84-904119229.
Email:
/>
23
24
L.V. Chieu, N.H. Tung / VNU Journal of Science: Earth and Environmental Sciences, Vol. 33, No. 3 (2017) 23-28
(a)
(b)
(pH 7.4) for diluting the silver standards was
prepared from pure salts of Na2HPO4, NaH2PO4,
and NaCl (WAKO, Japan). Milli-Q water was
used throughout all experiments in this study.
Depth is 50µm
Power supply
Pt electrode
FI
(Top view)
30µm
600µm
FI
Fluidic flow
Narrow part
Liquid sample
2.2. Apparatus
(Detailed top view)
(Side view)
(c)
+
+
+
+
+
+
Air bubble +
M
M
M
M
Ag
-
Ag
+
+
-
M
M
M
+Plasma
+
-
+
+
-
Emission
+
M
+
M
M
M
-
+
+
Ag
Ag
+
-
M
M
M
-
M
-
-
Sedimentation of the silver NPs was
performed by a ultracentrifuge equipment
(TOMY, USA). A quartz microchip (LepiCuveC cuvette) (Micro Emission Ltd., Japan) was
used for measuring silver NPs, and optical
emissions of this NPs were recorded by a
spectrometer (Andor Technology, UK, SR-3031A) and a CCD camera (Andor Technology, UK,
Newton).
2.3. Sample preparation
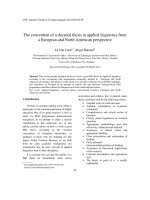
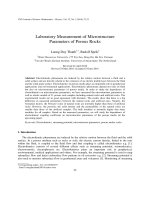
Figure 1. Mechanism of emission process. The
sample suspension is introduced into the narrow part
of the chip device, in the absence of air bubbles. The
platinum electrodes are placed at both ends of the
flow channel. Voltage pulses are applied to the
platinum electrodes (a). The constriction region on the
chip is magnified in (b). The principle of the emission
by the silver nanoparticles is illustrated in (c).
However, LEP-AES is a promising approach
for achieving more compact and cost-effective
measurements. Metallic ions have been
successfully detected by liquid electrode plasma;
however, the application to metallic NPs has so
far not been demonstrated. In particular, the
essential process of atomization of the NPs into
individual metallic atoms has not been
investigated to date. In this study, the detection
limit of silver NPs using LEP-AES was
systematically investigated.
2. Experiment
2.1. Reagents
Silver NP standards, a kind of suspended
solution, with various diameters 20, 40, and 60
nm (BBI, United Kingdom), and silver-ion
standard solution (KANTO, Japan) were used for
studying detection of the silver NPs by LEPAES. Phosphate-buffered saline (PBS) solution
1.09 g of Na2HPO4, 0.368 g of NaH2PO4,
and 9 g of NaCl were dissolved into 100 ml
distilled water to create 0.1 M PBS solution (pH
7.4). A 3 µg/g silver NP suspension (diameter 20
nm), diluted from the initial standard with the
PBS solution, was used for optimizing the
conditions to detect the silver NPs. The
experiments, directly detecting silver NPs by
LEP-AES, were carried out on the suspensions
of 5 µg/g of the silver NPs with diameters to be 0
(corresponding to silver ion solution), 20, 40,
and 60 nm. A calibration curve with 5 points (0,
0.5, 1, 2, and 3 µg/g) was diluted from a initial
20nm-silver NP standard with the PBS solution.
2.4. Experimental setup for direct detection of
Ag NPs by LEP-AES
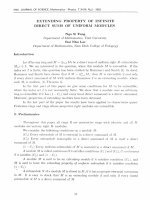
The experimental setup for detecting the
silver NPs by LEP-AES was schematically
shown in Fig. 2b. The sample solution was
carefully spiked into the microchannel with a
syringe. A voltage was applied across the
channel and controlled by the pulsed power
source. This source supplied pulses of predefined
intensities and durations (Fig. 2a). The resulting
plasma excited the silver atoms to generate
emissions, which were then captured by an
optical fiber and recorded by a spectrometer.
L.V. Chieu, N.H. Tung / VNU Journal of Science: Earth and Environmental Sciences, Vol. 33, No. 3 (2017) 23-28
(a)
silver optical emission intensity was minimum
(Fig. 4). The optimal pulse height was therefore
taken at 1080 V.
a
c
Total applied
pulses
a - pulse height
b - pulse duration
c - interval time between each pulse
800
(b)
Pulse power source
Syringe pump
Intensity [a.u.]
b
25
600
400
200
FI
FI
Optical fiber
0
800 900 950 1000 1050 1080 1100 1150 1200
Spectrometer
Waste
Figure 2. Experimental setup. (a) Parameters of the
voltage pulses, applied at both ends of the flow
channel, and generated by the pulsed power source.
(b) Sample suspension spiked into the microchannel
with a syringe. The optical emission by the silver
nanoparticles is captured by the optical fiber and
recorded by the spectrometer and the computer.
3. Results and discussion
3.1. Investigation of the optimal conditions for
detecting the silver NP by LEP-AES
Pulse height [V]
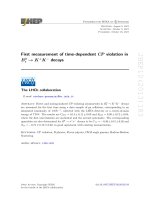
Figure 3. Optical intensity of the silver nanoparticle
emissions as a function of voltage pulse height.
80
60
%CV
Computer
40
20
0
800 900 950 1000 1050 1080 1100 1150 1200
Pulse height [V]
Pulse height dependency
The 3 µg/g silver NP (20 nm) suspension
was used to investigate the pulse height
dependence. Each measurement consisted of ten
equal pulses, and lasted 7 ms at 4 ms intervals,
with a height of 800, 900, 950, 1000, 1050,
1080, 1100, 1150, and 1200 V. Figure 3 shows
the average value of seven repeated
measurements for each pulse height. There was a
clear emission peak for silver appearing at a
wavelength of 338 nm. The increase in silver
peak intensities with the applied pulse height is
plotted in Fig. 3. For the weak pulses (800-1000
V), the emission intensity was very low, whereas
at the other extreme pulses (1050-1200 V), it
was relatively high. Each pulse height creates a
temperature to excite emission of the silver NP,
therefore the increase of pulse height leads to a
temperature rise, resulting in an increase of the
emission intensity. However, at 1080 V, the
relative coefficient of variation (CV) for the
Figure 4. Coefficient of variation of the silver optical
emission intensity as a function of the pulse height.
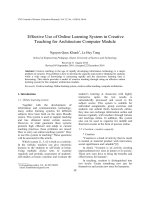
Pulse duration dependency
Using the same NP suspension as mentioned
above, ten voltage pulses were applied for each
measurement with a duration of 3, 4, 5, 6, 7, 8, 9,
and 10 ms. The time interval between each pulse
was 4 ms, and the pulse height was set to 1080
V, and seven measurements were averaged.
Increasing pulse duration was expected to result
in an increase of the silver optical emssion
intensity, however the result showed that the
optical emission intensity of the silver NP
depended non-monotonically on pulse duration
(tp). Intensity of the silver NP was increased
with increasing of the tp from 3 to 7 ms.
However, at the tp values above 7 ms, intensity
of the silver NP was decreased with incresing of
the tp (Fig. 5).
L.V. Chieu, N.H. Tung / VNU Journal of Science: Earth and Environmental Sciences, Vol. 33, No. 3 (2017) 23-28
26
size change of the silver NPs were performed to
prove the direct detection ability of the silver
NPs by LEP-AES.
Intensity (a.u)
300
240
180
Deposition of the silver NPs from the
solution
120
60
0
3
4
5
6
7
8
9
10
Pulse duration [ms]
Figure 5. Optical intensity of the silver nanoparticle
emissions as a function of the pulse duration
(The time interval between pulses is 4 ms).
100
%CV
80
60
40
20
0
3
4
5
6
7
8
9
Pulse application time [ms]
10
Figure 6. Coefficient of variation of the silver optical
emission intensity as a function of pulse duration.
The average CV, excluding the maximum
and the minimum values of the seven
measurements, was calculated for each tp value
(Fig. 6), giving an average CV of 22.5% for
silver. The CV values for the pulse duration of 3,
4, 5, 6, 7, 8, 9, and 10 ms were 93, 25, 23, 11, 7,
13, 18, and 57%, respectively. For the tp value at
7 ms, the optical emission intensity of silver was
highest, and the CV was lowest. The optimal
pulse duration was therefore taken at 7 ms.
In conclusion, the pulse height and the pulse
duration of 1080 V and 7 ms were respectively
used for further experimental studies.
3.2. Direct detection of the silver NPs by LEPAES
Two experiments including sedimentation of
the silver NPs from the solution and analysis of
The silver NPs in the solution may maintain
an equilibrium between the nanoparticle type
and the ion type. Therefore, to eliminate the case
in which the silver spectrum received from LEPAES was only emitted by the ion, the silver NPs
were deposited from the solution. And after the
solution was separated into two parts, named the
deposition and the emergent supernatant, for
compairing the intensities of the silver optical
emission. Many reports indicated that the
deposition of metallic NPs from solution was
usually performed by a centrifugation method.
Two concentrations of the silver NPs (0.5 and 3
µg/g) with the size of 20 nm were centrifugated
at 14,000 rpm/min in 20 °C for 10 minutes. The
corresponding spectrum intensities were
measured by LEP-AES as follows, ten pulses of
the height of 1080 V and duration of 7 ms were
applied at intervals of 4 ms. The results showed
that the intensities of the silver NPs in the
depositional parts were significantly higher than
those in the supernatants for the concentrations
of both 0.5 µg/g and 3 µg/g (Fig. 7A and B).
Therefore the silver NPs deposited by
centrifugation were detected by LEP-AES.
Analysis of size change of the silver NPs by
LEP-AES
The suspensions of 5 µg/g of the silver NPs
with diameters of 0 (solution of silver ion), 20,
40, and 60 nm were demonstrated by LEP-AES.
For measuring the corresponding spectrum
intensities of the silver NPs, the pulse height of
1080 V and the duration of 7 ms were applied at
the intervals of 4 ms. The data in Fig. 8 showed
averages of three sets of pulses. The emission
intensity decreases as the NP diameter increases
and the smallest size of the silver NP (diameter
of 20 nm) has the highest intensity among all
other sizes (expected the silver NP with “zerodiameter”) (Fig. 8).
L.V. Chieu, N.H. Tung / VNU Journal of Science: Earth and Environmental Sciences, Vol. 33, No. 3 (2017) 23-28
70
the NP size also is an evidence for directly
detecting the silver NP by LEP-AES.
Studies about both the deposition of the
silver NPs from the solution and dependence of
the silver intensity on the NP size confirmed the
direct detection of the silver NPs by LEP-AES.
STD
Below
Upper
(A)
56
42
Intensity [a.u.]
28
14
Calibration curve and the detection limit
0
500
(B)
400
300
200
100
0
332
334
336
338
340
Wavelength [nm]
Figure 7. Intensities of the silver NPs in both the
deposition and the supernatant parts after using
centrifugation method, (A) – the silver NP
concentration of 0.5 µg/g, (B) – the silver NP
concentration of 3 µg/g.
1200
Intensity [a.u.]
27
960
720
480
240
For the purpose of calibration, a 10 µg/g of
the silver NP standard suspension with diameter
20 nm was diluted in the PBS to form suspension
concentrations of 0, 0.5, 1, 2, and 3 µg/g. The
measuring conditions for each concentration by
LEP-AES were performed as follows. Ten
pulses of the height of 1080 V and duration of 7
ms were applied at intervals of 4 ms. To assess
the reproducibility, measurements were repeated
seven times for each concentration. An increase
in the silver NP emission intensity with the
concentration was observed (Fig. 9).
The calibration curve is shown in Fig. 10
with the correlation coefficient of 0.959. The
%CV was calculated as 29.2% for the silver NP
concentrations by the silver NP calibration
curve. The limit of detection (LOD) for the silver
NP was estimated by using the equation LOD =
3σ/s, where σ is the standard deviation of the
measurement data of blank solution and s is the
slope of calibration curve. On the basis of Fig.
10, the silver NP detection limit was calculated
to be 0.23 µg/g.
400
0
0nm
20nm
40nm
60nm
Intensity[a.u.]
Figure 8. Optical intensity of the silver nanoparticles
as a function of diameter. A diameter of 0 represents
a silver ion solution.
0 ppm
AgNPs
338nm
Size of AgNPs [nm]
0.5 ppm
300
1 ppm
2 ppm
200
3 ppm
100
The results can be explained by steric
inhibition of the NP sizes. When the NP size
increases, density of the NP around the plasma
environment of LEP-AES may decrease. For this
reason, the intensity of the silver NP with the
coarser size was lower than that with the finer
size. The dependence of the silver intensity on
0
334
336
338
340
342
344
346
Wavelength [nm]
Figure 9. Optical emission spectra of the silver NPs
at each point in the calibration curve (the silver NPs
peak measuring at the wavelength of 338 nm).
L.V. Chieu, N.H. Tung / VNU Journal of Science: Earth and Environmental Sciences, Vol. 33, No. 3 (2017) 23-28
28
Intensity [a.u.]
350
References
y = 73.67x + 23.08
R² = 0.959
250
150
50
-50
0
0.5
1
1.5
2
2.5
3
3.5
Conc. of AgNPs [ppm]
Figure 10. Calibration curve of the silver
nanoparticle intensity.
4. Conclusions
The silver NP suspensions were directly
quantified by LEP-AES with the detection limit
of 0.23 µg/g. The results also confirmed that the
sensitivity of the silver NP depends on both the
height and duration of the applied voltage pulses.
Our results suggest that LEP-AES may be a
potential method for measuring other metallic
NPs. Further investigations on tagging various
antibodies with the silver NP are needed for
using LEP-AES as a detection technique in
biological applications.
[1] Iiduka A, Morita Y, Tamiya E and Takamura Y,
MicroTAS 2004, Vol. 1, The Royal Society of
Chemistry, Cambridge, 2004, pp. 423-425.
[2] Banno M, Tamiya E and Takamura Y 2009 Anal.
Chim. Acta 634 L153.
[3] Matsumoto H, Iiduka A, Yamamoto T, Tamiya E
and Takamura Y, Proceedings of MicroTAS 2005
Conference, Vol. 1, Transducer Research
Foundation, Boston, 2005, pp. 427-429.
[4] Kumagai I, Matsumoto H, Yamamoto T, Tamiya
E and Takamura Y, Proceedings of MicroTAS
2006 Conference, Vol 1, Tokyo, 2006, pp. 497499.
[5] Kumai M, Nakayama K, Furusho Y, Yamamoto T
and Takamura Y 2009 Bunseki Kagaku 58 L561.
[in Japanese]
[6] Kagaya S, Nakada S, Inoue Y, Kamichatani W,
Yanai H, Saito M, Yamamoto T, Takamura Y and
Tohda K 2010 Anal. Sci. 26 L515.
[7] Yamamoto T, Kurotani I, Yamashita A, Kawai J
and Imai S 2010 Bunseki Kagaku 59 L1125. [in
Japanese]
[8] Nakayama K, Yamamoto T, Hata N, Taguchi S
and Takamura Y 2011 Bunseki Kagaku 60 L515.
[in Japanese]
[9] Jo K W, Kim M G, Shin S M and Lee J H 2008
Appl. Phys. Lett. 92 L1503.
Đo trực tiếp hạt nano bạc trong dung dịch bằng phương pháp
plasma điện cực lỏng kết nối phổ phát xạ nguyên tử
Lê Văn Chiều1, Nguyễn Hoàng Tùng2
1
Ban quản lý các dự án, Đại học Quốc gia Hà Nội, 144 Xuân Thủy, Hà Nội, Việt Nam
Viện Công nghệ môi trường, Viện Hàn lâm Khoa học và Công nghệ Việt Nam (VAST),
18 Hoàng Quốc Việt, Cầu Giấy, Hà Nội, Việt Nam
2
Tóm tắt: Bài báo này trình bày phép đo định lượng hạt nano bạc trong dung dịch bằng plasma điện
cực lỏng kết nối phổ phát xạ nguyên tử (LEP-AES). Nghiên cứu này đã khảo sát sự phụ thuộc cường độ
tín hiệu LEP-AES vào chiều cao xung và thời gian áp xung. Giới hạn phát hiện và hệ số biến thiên (CV)
cũng được khảo sát. CV của chiều cao xung tại 1080 V đạt giá trị thấp nhất là 7% tại thời gian áp xung 7
ms. Giới hạn phát hiện (3σ) của hạt nano bạc bằng LEP-AES tại các điều kiện tối ưu đã được tính toán từ
đường chuẩn là 0,23 µg/g.
Từ khóa: Hạt nano bạc, đo định lượng, plasma điện cực lỏng, phổ phát xạ nguyên tử.