DSpace at VNU: Applying artificial neural networks (ANN) model in flash flood simulation and forcast.
Bạn đang xem bản rút gọn của tài liệu. Xem và tải ngay bản đầy đủ của tài liệu tại đây (2.63 MB, 8 trang )
VNU JOURNAL OF SCIENCE, Nat., Sci.. & Tech., T .x x , N03, 2004
A P P L Y IN G A R T IF IC IA L N E U R A L N E T W O R K S (A N N ) M O D E L IN
F L A S H F L O O D S IM U L A T IO N A N D F O R E C A ST
N g u y e n H u u K h ai
D epartm ent o f Hydro-M eteorology & Oceanography, College o f Science ,V N U
Le X u a n Cau
M in istry o f Resources & Environm ent
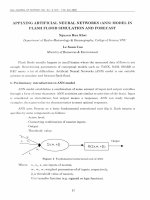
Flash floods u sually h ap pen in small basins where the m easured data of flows is not
enough. Determining p a ra m e te rs of conceptual models such as: TANK, NAM, SSARR or
HEC meets a lot of difficulties. Artificial N eural Networks (ANN) model is one suitable
solution to sim ulate and forecast flash flood.
1. P relim in ary in tr o d u c t io n to ANN m o d el
ANN model establish es a combination of some am ount of input and output variables
through a form of sem i-character. ANN activities are similar to activities of the brain. Input
is considered as stim ulation, b ut o u tpu t m eans a responses. ANN can study through
examples, then generalize its characteristics to m eet optimal responses.
ANN uses N euron as a basic fundam ental correctional unit (fig.l). Each neuron is
specifies by some com ponents as follows:
- Active level.
- Connecting com bination of neuron inputs .
- O utput
- Threshold value.
O utput
---------- ►
Figure 1: Fundamental correctional unit of ANN
Where:
x 1? x.„ X ;1 are in pu ts of neuron,
Wj,
w 2,
W;j
weighed p aram eters of of inputs, respectively,
P3is threshold value of neuron,
G is tra n sfe r function (e.g. sigmoid or logic function).
57
58
N g u yen H im K h a i, Le X u an Can
Multi-layer neural network consists of a t least 3 layers of nodes (fig.2). The input
layers are a passive layer putting examples into ANN to study. The hidden layers include
nodes without direct relation to the outside layers. These layers are the non-linear
combination of inputs. The output layer calculates non-linear combinations of hidden nodes.
Weighted values
W ij
and wjk of ANN can be evaluated by the optimization scheme
(gradient method).
(Input Layer)
(Hidden Layer)
(Output Layer)
XI
Input signal Xị
O utput signal Xj
O utput signal y-j O utput signal z k
Figure 2: Multi-layer ANN (Network of Dinh river-Binh Thuan Prov.)
In ANN, input signs are distributed among hidden nods. After that, these hidden
nods change them into output signs. These signs are transm itted to output of ANN.
If the input of ANN are Xị, (i = 1-Ninp), then output of hidden layers will be y-j, G=l-Nhitl):
Nmp
N
Yj = G
a o j + ^ a ij y i
i=i
( 1)
J
and output will be z k , k = 1-Nout'
N hid
Zu = G B ok + X b ik y J
j=l
(2 )
Where:
Ninp= input patterns,
Nhid= output p attern s of hidden layers,
Nout= output patterns.
V N U . Journal o f Science, N a t., Sci., & Tech.,
T.xx.
N , j . 2004
A p p lyin g artific ia l neural netw orks.
59
Transfer function, which is limited between 0 and 1, is a logistic function as follows:
G(u) = ---- Ỉ-TỊ1+e
(3)
Thus ANN consists of (Ninp + l)N hid +(Nhjd + l)N 0Ut param eters (this is p aram eters a, b
or weighted values Wịj , Wj k). These param eters will be received from teaching ANN
process to find out the minimum error function, th a t is a mean square error MSE:
-I
MSE = —...... i —---^ exam
^fexam^N'out
£
(obsj - mod; )2
out
(4)
i=i
Where:
N,.xani: examples patterns for studying,
obs, :output observed patterns,
mod, : output patterns calculated from ANN .
a, b are the param eters optimized by the gradient method.
Versions of ANN are built up to create advantages for running models and outputting
results. WinNN version 0.97, built by Y.Danon, April 1995, has been used in this document.
ANN model doesn’t require continuous data. It allows analyzing and choosing param eters
of all floods a t the same time. That is a real advantage as compared to the black-box and
conceptual models in hydrology. It also allows establishing directly the relation between
rainfalls and w ater levels without using flows and overcoming principal difficulties, such as
maintaining a station observing discharge in small basins.
2. A p p lyin g ANN to sim u la te and foreca st flash flood
We apply ANN to sim ulate and to forecast flash floods and great floods for some
basins, in which there are Dinh river in Binh T huan province (F=435krrr for Z30D station),
NamLa in Son La province (F=205km2 for 308 bridge station), Ve river in Quang Ngai
province (F =1260knr for AnChi station) and some other rivers, with their various basin area.
2.1. Đ in h b asin
We only have the w ater level data at the Z30D station and rainfall data a t some
meteorological station within this basin. The num ber of the input are 4, and the output is
water level at Z30D station. Applying ANN to sim ulate the great floods, including the
1999’s flash flood, we got the results as follows: (for 43 training patterns):
+ With error of 5%, it will have good patterns of p=95.8%,
+ The root m ean square error RMSE = 0.0241,
+ Maximum error = 6.24%,
+ Ratio: s/ơ = 0.135
Forecasting results for flood peak in period of 1995-1999 were shown in table 1 and fig. 3.
V'NU. Journal o f Science.
Nat.. Sci.. & Tech.. T.xx. N J . 2004
60
N m iycn H u ll K h ai, Lc X u an Cau
Table 1: Comparison to forecasting and observed maximum peak flood
Year
Observed Level
Calculated Level
1995
1996
1997
1998
1999
1055
1004
1041
1100
1355
1040.6
1099.1
1351.8
1054.2
932.2
I4(X)
Tliucdo
1200
/
N et-Out
1000
T in h toan
800
0
2
4
6(K)
6
14
16
18
20
22
Pat. Index
Figure 3: Comparison to simulated and observed process
Verification with independent data series, chain 5 patterns from 1 to 5 are chosen,
responding to a flood. ANN will study the rest patterns to determine param eters, and then
compute for 5 chosen patterns. Result will be shown in fig.4:
T arget
N c t- I
60
cL
A
P a t. I n d e x
Figure 4: Verification by ANN for flash flood of Dinh river
V N U . Journal o f Science. N a t., Sri., á Tech.. T. XX. N lt3 . 2004
A p p lyin g a rtific ia l neural networks.
61
If foreseeing period was chosen as 12h (equivalent to observed rainfall data) the
forecasting result is rath er well as shown bellow:
+ With an error of 5%, it will have good patterns of p=88%,
+ RMSE=0.0452,
+ Maximum error = 17.8%.
2.2. N a m La b asin
In Nam La basin, it has many rainfall and flow data, with 8 inputs and 1 output.
The output discharges in 308 Bridge station; so checking process has more advantages.
Running ANN for floods, including the 1991’s and 1995’s flash floods (47 patterns) has
given some results as follows:
+ With error 1%, it will have p=100%, if 11 p atterns are given to independently
checking forecast, then p=88% will occur and:
+ RMSE = 0.00593,
+ Maximum error = 1.63%,
+ Ratio S/a = 0.112
Simulated form of process is very good (fig.5), even with the independent checking
forecast
Thucdo
/
ISfct-O*
Tinh toon
♦
0;
4
_
8j_
10
1^
16ị
2ŨỊ
24,
28,___ 32
36
PdL Index
Figure 5. Comparison to flash flood process in Nam La basin
V N U . Journal o f Science. N at.. Sri., á Tech..
T.xx,
N t>3, 2004
N g u yen H ull K h ai, Lc X u an Cau
62
St)
Tarcet-1
70
/
Na-CU
50
Nfet-1
♦
♦
30
10
Fbi. Irtfex
F i g u r e 6: V e r if ic a tio n b y A N N for f la s h flood in N a m L a r i v e r
2.3. Ve basin
In Ve basin, ANN was used to detemine relation between level of flood peak depends
rainfall and begininng level of the floods: Hmax= f(Xlv, Hcl)
With 43 pattens, ANN gives following results (fig. 7):
+ With an error of 5%, it will have good patterns of p=87%,
+ RMSE = 0.0401,
+ Maximum error = 8,648%.
I(X »
/
Target
Net-out
Net-1
« 1 ___6 , _______ 9ị
12,
I5|
18,
211
24|
27j
30|
33|
M X)
Pat. Index
F i g u r e 7: S i m u l a t e d a n d o b s e r v e d h y d r o g r a p h in V e b a s i n
V N U . Journal o f Science, N at., S c i & Tech..
T.xx.
N lt3, 2004
63
A p p ly in g a rtific ia l neural networks.
Using ANN for some other rivers (e.g. Ca river-Nghe An) has also given rather good
results.
3. R e m a r k s
- ANN model allows setting up a multi-dimensional and direct relation of the input
and output, it reflects the characteristic of both conceptual and black-box models. It is
suitable to compute and forecast flash flood as well as great flood in a small basin, where
data has onlv rainfall and w ater level. It allows auto-adjusting error in computing process.
That is real advantages in compare to the black-box and conceptual models in hydrology.
Applying ANN model to simulate and forecast flash floods in the Dinh river (Binh
Thuan province), Nam La river (Son La province), Ve river (Quang Ngai province) and some
other basins showed ra th e r good results of simulation and forecast, including independent
control forecast, with good p atterns of p=85-100%.
- But, ANN also has some disadvantages:
+ If initial param eters are incompatibly chosen (The num ber of hidden nodes, inputoutput variables), it will not give excellent results or spend much time.
+ ANN’s param eters are directly determined and adjusted through observed data,
therefore when computing for basin, which has no data can meet difficulties.
However, comparison to the models being used in hydrology nowadays, the results
of ANN is more optimistic, including independent forecasting.
REFERENCES
1.
Keith J. Beven, Rainfall-Runoff Modelling, The Primer. John Winley & Sons. LTD,
Chichester, 2001, 324 pp.
2.
2. M.J. Hall & A.w. Minns, Rainfall-runoff modeling as a problem in artificial intelligence:
experience with a neural network, BHS 4th National Hydrology Sym posium , Cardiff, 1998
pp.23-45.
3.
Le Xuan Cau, Applying ANN model to correct meteo-hydrologic data, Journal of
Meteorology and Hydrology, HaNoi, No.7(1999), 1999, pp.23-29.
4.
Nguyen Huu Khai, Research on flash flood in Dinh river basin, Proceedings international
symposium on achiuements oflH P -V in Hydrological research, Hanoi, 2001, pp. 135-145.
5.
Nguyen Huu Khai, Possibility of applying the combination of ANN and HEC-RAS model for
flood forecasting on Ca river, Journal of Meteorology and Hydrology, HaNoi, No.9(2003),
p p .16-23.
V N U . Journal o f Science. N at., Sci., & Tecli., T.xx, N t>3, 2004
N g u yen H u u K h a i, L c X u an Cau
64
TẠP CHÍ KHOA HỌC ĐHQGHN, KHTN & CN, T .xx, So 3, 2004
ỨNG DỤNG MÒ HÌNH MẠNG THAN KINH NHÂN TẠO ANN TRONG
MỎ PHỎNG VÀ D ự BÁO LỦ QUÉT
N g u y ễn Hữu Khải
Khoa K h í tượng Thuỷ vàn và H ải dương học, Đại học K H TN , Đ H Q G H N
Lê Xuân cầu
Bộ Tài nguyên & Môi trường
Lũ quét thường xẩy ra trên các lưu vực nhỏ, ở đó thường không có số liệu dòng chảy,
gây nhiều khó k h ăn cho việc mô phỏng và dự báo. Mô hình m ạng th ầ n kinh n h ân tạo (ANN)
là một giải pháp tót đê giải quyết vấn đề này.
Mô hình ANN cho phép lựa chọn và xác định thông sô' của nhiều con lũ cùng một lúc.
Nó cũng cho phép xây dựng trực tiếp quan hệ giữa các nhân tố gây lũ với mực nước lũ mà
không cần thông qua lưu lượng và cho phép tự hiệu chỉnh sai sô" dự báo. Đó là những ưu
điểm mà các mô hình mưa-dòng chảy hiện nay không có.
Sử dụng mô hình ANN để mô phỏng và dự báo kiểm tra lũ quét cho các lưu vực sông
Dinh (tỉnh Bình Thuận), sông Nậm La (tỉnh Sơn La) và sông Vệ (tỉnh Q uản Ngãi) và một sô'
lưu vực khác cho kết quả rấ t khả quan, kể cả dự báo kiểm tra độc lập, với mức bảo đảm
p=85-100%.
V N U . Journal o f Science. N at., Sri.. & Teclì..
T.xx,
N ()3, 2004