DSpace at VNU: Sources and leaching of manganese and iron in the Saigon River Basin, Vietnam
Bạn đang xem bản rút gọn của tài liệu. Xem và tải ngay bản đầy đủ của tài liệu tại đây (404.6 KB, 7 trang )
2231
© IWA Publishing 2011 Water Science & Technology
|
63.10
|
2011
Sources and leaching of manganese and iron in the Saigon
River Basin, Vietnam
Nguyen Thi Van Ha, Satoshi Takizawa, Kumiko Oguma and
Nguyen Van Phuoc
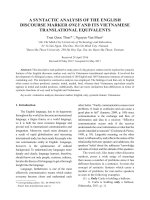
ABSTRACT
High concentrations of manganese and iron in the Saigon River are major problems for the water
supply in Ho Chi Minh City (HCMC), Viet Nam. To identify their sources and leaching processes, we
surveyed water quality along the Saigon River and ran batch leaching tests using soil and sediment
samples. Two important leaching processes were identified: acidic leaching from acid sulfate soil
Nguyen Thi Van Ha (corresponding author)
Nguyen Van Phuoc
Faculty of Environment,
Ho Chi Minh City University of Technology,
268 Ly Thuong Kiet, District 10, Ho Chi Minh City,
Viet Nam
E-mail:
(ASS) in the middle reaches of the river, and Mn dissolution and Fe reduction from sediments in the
downstream reaches. Low pH caused the concurrent release of Fe and Mn from the ASS. In contrast,
anoxia caused the release of Fe but not Mn from the sediments, whereas low pH facilitated Mn
dissolution. Sediments are a more important source of Mn because of their higher Mn contents
(10 times) and release rates (14 times) than those from ASS.
Key words
Satoshi Takizawa
Kumiko Oguma
Department of Urban Engineering,
Graduate School of Engineering,
University of Tokyo, 7-3-1 Hongo,
Bunkyo-ku, Tokyo 113-8656,
Japan
| acid sulfate soil, iron leaching, manganese leaching, pH-Eh diagram, redox condition,
sediment
INTRODUCTION
Manganese and iron are common metals found in Earth’s crust
and in natural water. Excessive exposure to Mn is associated
with adverse health effects and neurotoxicity, and retards the
intellectual development of children (Wasserman et al. ).
The health-based Mn guideline value for drinking water is recommended at 0.4 mg/L (World Health Organization (WHO)
) and 0.3 mg/L (US EPA ). In many countries, the
guideline values for Fe and Mn are set at lower concentrations
than the health-based guidelines. The Vietnamese environmental standards for Fe (QCVN 08:2009, A2) and for Mn
(TCVN 5942: 1995, A) are set at 1 mg/L and 0.1 mg/L, respectively; and the US EPA’s levels are 0.3 mg/L and 0.05 mg/L,
respectively.
Saigon River is the second most important source of water
for HCMC and Binh Phuoc Province. However, it is facing
water quality problems of low pH, high turbidity, and high concentrations of Mn, ammonia and total coliform. Tan Hiep water
treatment plant (WTP) reported that Fe and Mn concentrations
in the river water frequently exceed the Vietnamese standards
for water supply. The monthly average concentration of Mn
was about 0.16 mg/L in the dry season from 2005 to 2008,
and in the rainy season it has reached 0.24 mg/L in the rainy
season, exceeding several times the US EPA health risk level
doi: 10.2166/wst.2011.460
of 0.3 mg/L. High Mn caused difficulties in operation of the
WTPs (Kohl et al. ). In rivers and lakes receiving industrial
effluents, heavy metals and Mn are deposited in the sediments
(Youger & Mitsch ). The amounts of Fe and Mn leaching
depend on their concentrations in the top sediment layer (Guerios et al. ), pH and redox condition (Eh) (Davison ).
There is limited information about sources of Mn and Fe in
the Saigon River. A better understanding of the Mn and Fe
sources and their leaching processes is required to predict
when and where its high concentrations will occur. The objective of this study was to identify the main sources and transport
of Mn and Fe entering the Saigon River to assist development
of river basin management strategies for controlling point and
diffuse sources of Mn and Fe inputs into the river.
MATERIALS AND METHODS
Study sites
The Saigon River has a total length of about 280 km, its
catchment covers about 4,717 km2 and its average flow
rate is 85 m3/s. The upstream Dau Tieng Reservoir is the
N. T. Van Ha et al.
2232
|
Sources and leaching in the Saigon River Basin
Water Science & Technology
|
63.10
|
2011
DT9 and DT7) and 11 from the Saigon River (SG4 to SG22,
of which some points were skipped). On May 9th, 2008
seven river surface water samples (SG9 to SG20) and seven
canal water samples (ThT, RM, RBC, RBB, RBL, RT, VT)
were collected at the same depths. We measured pH, turbidity
and DO on-site by using a Horiba W-23XD probe, and
measured total Mn and total Fe with a DR820 Colorimeter.
fourth biggest reservoir in Vietnam, with a storage capacity
of 1.48 Â 109 m3. The Dau Tieng – Saigon River system is the
largest irrigation system in Vietnam and an important water
supply source. At two water intakes in the middle section
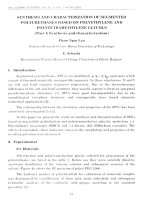
(SG15 and SG16 in Figure 1), about 326,000 m3 per day is
withdrawn for supply to HCMC and Binh Duong Province.
The tidal effect sometimes went up to the location of SG9
(Figure 1). There is about 16,670 ha of ASS around the water
intakes in Cu Chi District in HCMC. The Thi Tinh River
(ThT), the Rach Tra (RT) Canal and the Vam Thuat (VT)
Canal are the 3 main tributaries of the Saigon River. The
ThT and VT receive wastewater from industrial zones in
Binh Duong Province and HCMC, respectively. The RT
Canal collects most of the drainage from potential acid sulfate
soil (PASS) in the Saigon River basin and acidic drainage from
actual acid sulfate soil (AASS) in the Vam Co Dong River basin.
Three undisturbed ASS samples were collected at locations S1
to S3 from two depths: 0–25 cm and 25–50 cm. Fourteen sediment samples were taken along the river and kept in plastic
bags at 4 C until the batch leaching tests were conducted.
Total Mn and Fe were measured following the US EPA
method 3051 (US EPA ) and expressed in mg/kg dry weight.
Water sampling and analysis
Batch leaching test
On August 20th, 2006 we collected three surface water
samples (at 0.5 m) from the DT Reservoir (denoted as DT1,
About 30 g of air-dried soil was mixed with 150 mL
Milli-Q water or 150 mL acid solution at about pH 1.5
Figure 1
|
Map of study area, sampling sites and distributions of acid sulfate soil.
Soil and sediment sampling and analysis
W
N. T. Van Ha et al.
2233
|
Sources and leaching in the Saigon River Basin
(Mehlich 1 extraction solution: 0.025 N H2SO4 and 0.05
N HCl) in serum bottles, shaken for 5 min on a reciprocating shaker at 180 oscillations per min, and then
incubated at room temperature in aerobic conditions. Leachates were sampled at 1, 18, 72 and 168 h after mixing to
measure pH and dissolved Mn and Fe by inductively
coupled plasma atomic emission spectrometer (ICPAES). Four sediment samples containing high amounts
of Mn and Fe (SG15, SG17, SG18 and SG19) were used
for batch leaching tests following the American Society
for Testing and Materials (ASTM) () method. About
5 g of wet sediment was put into 120 mL serum bottles
with 100 mL synthetic Saigon River water (Naþ, 80.9 mg/L;
Mg2þ, 15.6 mg/L; Kþ, 17.2 mg/L; Ca2þ, 10.5 mg/L; ClÀ,
2–
95.7 mg/L; NOÀ
3 , 3.5 mg/L; and SO4 , 19.7 mg/L; pH 5.78;
EC, 17.61 mS/cm; DO, 7.9 mg/L; oxidation–reduction
potential (ORP), 216 mV). Duplicate samples were prepared for aerobic (denoted as A) and anaerobic (denoted
as An) leachants with (denoted P) and without (no annotation) pH amendment, to 4.29. Control samples contained
only synthetic Saigon River water. The anaerobic bottles
were sealed with Teflon-coated rubber stoppers and aluminium caps, and then purged with pure N2 gas for 5 min at
60 mL/min. The aerobic bottles were capped with oxygen-permeable caps made of silicone foam rubber. All bottles were
gently shaken by bio-shaker (BR-300LF) at 30 C at a horizontal shaking rate of 30 rpm for 1 month. Leachates were taken at
1, 18, 72, 168 and 720 h after mixing for the analysis of Mn, Fe
and Ca by ICP-AES and of SO4 by ion chromatography. The
initial and final leachates were measured for pH, electricity
conductivity (EC), dissolved oxygen (DO) and ORP, which
was converted to Eh later. Data were plotted on the Eh–pH diagrams of the Fe-O-H or Mn-O-H-C system (M ¼ 10À5 mol/L,
W
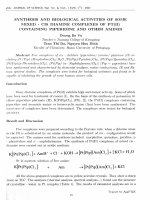
Figure 2
|
Profiles of pH, DO, Mn and Fe in surface water of Saigon River.
Water Science & Technology
|
63.10
|
2011
298.15 K, and P(CO2) ¼ 0.00035 atm) using FACTSAGE software, v. 6.1.
RESULTS AND DISCUSSION
Water quality variation along the Saigon River
Overall, pH, DO, Mn and Fe varied similarly in both river
surveys in August 2006 and May 2008, although there
were some differences at a few sampling locations. The
water was slightly acidic: pH varied from 5.2 to 6.2
(Figure 2(a)) and from 5.5 to 6.5 (Figure 2(b)), and was
lower in the middle section (SG13 to SG16) in both
periods. The ThT and RT canals had pH values of ,5.7,
which increased the acidity in the middle section. The
low pH in the middle section and the anoxia in the downstream section are important characteristics for water
quality. In the upstream and middle sections, it varied
from 1.1 to 6.9 mg/L in 2006 and from 2.1 to 6.8 mg/L
in 2008. In the downstream section it was depleted
owing to urban drainage from Thu Dau Mot Town and
HCMC. DO depletion was more distinct and Fe concentration was lower in August 2006 than in May 2008.
This is because, in early rainy season in May, water contained low Fe in runoffs and therefore less Fe oxidation
occurred. Fe concentrations varied from 0.5 to 2.33 mg/L
in 2006 and from 0.65 to 1.67 mg/L in 2008. Concentrations were higher in the middle section owing to the
erosion of Fe-rich soil in the basin. In the downstream section, because of the high pH (! 6), most of the ferrous
iron was oxidized and precipitated, resulting in a decrease
of Fe concentration downstream. The canal drainages
N. T. Van Ha et al.
2234
|
Sources and leaching in the Saigon River Basin
Water Science & Technology
|
63.10
|
2011
(Abesser et al. ). The amounts of Mn leached varied
among the soil types (Table 1): S3 (AASS) had the lowest
pH, 2.13, the highest dissolved Mn concentration in the leachates, 9.34 mg/L, and the highest Mn release percentage
(30%). S1 had the highest pH and the lowest Mn leaching
rate, 1.36 mg/L, or 3.5%. Similar to Mn, total Fe contents
did not differ between the two soil layers but differed greatly
among soil types. S3 had the highest Fe contents, of 29,800
mg/kg dry top-soil, and the highest Fe leaching rates of 925
mg/L. S1 had the lowest Fe leaching rates, which were
nearly negligible compared with their total contents (17.9
mg/L, or ,0.1%). The similar leaching results between Mn
and Fe implied that they were associated with each other in
the soil samples. The lower pH leachants increased metal
leaching rates from PASS. Acidic leachant (pH ∼ 1.5) dramatically increased Mn and Fe leached at S1. After a week
Mn and Fe concentrations in leachates increased about 10
times and 14 times, respectively.
(RM, RBC and RBL) and tributaries (ThT and RT) in the
middle section had low pH and high Fe concentrations,
indicating that acidic leachates from ASS contribute to
the Fe inputs and acidification of the Saigon River. The
acidic drainage from ASS contained Al, Mn and Fe
(Green et al. ). Mn concentrations in DT Reservoir
varied from 0.007 to 0.099 mg/L, lower than those in
the Saigon River due to less impact from ASS, which
means that DT Reservoir was not an important source
of Mn. Iron was at a peak at SG18 in August 2006 due
to receiving more acidic drainages from Vam Thuat
Canal, and more turbulence which resuspended Fe sediments, than those occurring in the early rainy season in
2008. In contrast to Fe, Mn concentrations increased in
the downstream. Dissolved Mn, which is oxidized very
slowly at pH 6, remained in the water, when dissolved
Fe was readily oxidized and precipitated.
Mn and Fe releases from ASS
Mn, Fe and SO4 releases from sediments
The pH of the soil leachates varied from 2.13 to 4.94
depending on soil type and acidity (Table 1). During leaching tests, pH of S3 leachate remained stable in both soil
layers, while pH of S2 leachate increased slightly. Periodic
inputs of such acidic water acidified Saigon River because
of its low buffering capacity.
Mn and Fe are likely to be the major trace metals released
by the oxidation of ASS (Welch et al. ) and in soil water
Table 1
|
Total Fe contents in surface sediments did not vary significantly along the Saigon River, 31,300–61,220 mg/kg, while
total Mn contents varied greatly, 261–1,370 mg/kg. Mn
contents in the downstream sediments at SG18, SG19 and
SG20 were .1,000 mg/kg, about 10 times higher than that
in ASS. Sediment SG19 had a slower Mn release rate than
SG17 and SG18, and the lowest concentration of released
pH and dissolved Mn and Fe concentrations of soil leachates and total Mn and Fe contents in top-soils (0–25cm)
Mn concentrations in leachates (mg/L)
Site
pHa
hour
1
168
S1
4.06
4.94
S2
2.92
3.79
2.29
2.13
S3
Total Mn mg/kg
Water
Acidic
leachantsb
leachantsc
Fe concentrations in leachates (mg/L)
Water
Total Fe mg/kg
1
168
1
168
143
1.1
1.36
9.43
13.2
65
1.13
0.88
1.52
1.58
120
7.26
9.34
7.30
9.11
29,800
a
leachantsb
Acidic leachantsc
1
168
1
168
16,600
0.55
17.9
38.7
246
20,600
8.23
218
107
519
692
925
924
1,220
b
c
Note: pH of water leachants. pH of acidic leachants was about 1.5 and did not change significantly; soil: milli-Q water ¼ 1:5; soil: Mehlich 1 solution ¼ 1:5.
Table 2
|
Amount of Mn and Fe released from sediments leaching test
Mn released (mg/kg)
Iron released (mg/kg)
Moisture
total Mn
1h
720 h
Total Fe
Sediment
(%)
mg/kg
(A)
(An)
(A)
1h
(An)
mg/kg
(A)
(An)
(A)
SG15
45
573
119
124
SG17
56
619
258
367
SG18
57
1,020
399
378
716
580
55,297
64
SG19
57
1,374
44
41
187
180
58,391
17
720 h
(An)
197
190
50,288
21
27
14
1,582
504
558
61,220
30
46
34
3,045
94
19
1,862
19
18
856
N. T. Van Ha et al.
2235
|
Sources and leaching in the Saigon River Basin
Mn (167–244 mg/kg), although it had the highest total Mn
content, i.e., Mn species in SG15, SG17 and SG18 sediments
were mostly in the readily leachable form, whereas Mn at
SG19 was more slowly leachable. Sediment SG19 was contaminated by industrial and municipal effluents from
HCMC, whereas SG17 and SG18 were located in agricultural areas and received drainage from ASS paddy fields in
Saigon and VCD River basin. Unlike Mn, Fe was slow to dissolve into the leachants at low content. pH adjustment was
too minor to bring any significant effects on releasing rate.
The anaerobic condition had a significant influence on the
amount of Fe released (t-test, P , 0.001), but had no effect
on Mn leaching. After 168 h, anaerobic leachates had pH
more than 6 and zero DO, which could facilitate the Fe
releasing process (Figure 3(b)). Sediments SG17 and SG18
had higher sulfate release rates (14.3–28.8 g/kg), indicating
deposition of SO4-rich particles derived from ASS at those
locations.
Figure 3
|
Leaching of Mn, Fe and SO4 from the sediments.
Water Science & Technology
|
63.10
|
2011
The release of Mn from sediments was about 14 times
that from the soils, indicating sediments are a more important source of Mn in the Saigon River. In contrast,
the amounts of Fe leached from sediments varied from
21 mg/kg in aerobic tests to 124 mg/kg in anaerobic tests,
far less than that from soils, 2,390 mg/kg. This suggests
that Fe was derived mainly from soil erosion and leaching
from soil rather than from sediment.
Effects of pH and Eh on Mn and Fe release from
sediments
Figure 4 shows the effects of pH, Eh and concentrations,
and distribution of Fe and Mn species in the final sediment leachates. Sediments SG15, SG17 and SG18 were
more acidic, explaining the lower pH and higher Eh of
the aerobic samples than those of the control samples,
whereas sediment SG19 showed a pH increase and an
N. T. Van Ha et al.
2236
Figure 4
|
|
Sources and leaching in the Saigon River Basin
Water Science & Technology
|
63.10
|
2011
Eh-pH diagram of Fe and Mn plotted with the data of the final sediment leachates. (The open and solid symbols are aerobic and anaerobic samples and the asterisks are
control samples. Additional lines were drawn in (a) for aqueous Fe concentration from 10À10 to 10À2 mol/L and in (b) for aqueous Mn ¼ 10À2 mol/L at P(CO2) ¼ 0.00035 atm, and
0.0035 atm.).
Eh decrease. Aerobic treatment moved the pH–Eh
conditions along the border between Fe2O3 and Fe2þ,
i.e., moving to lower pH with higher Eh (Figure 4(a)).
Hence, it did not promote dissolution of Fe. In contrast,
anaerobic treatment raised pH and lowered Eh. During
the course of the batch leaching tests, Eh was lowered
before pH was increased, so that the anaerobic condition
accelerated the dissolution of Fe from sediments. The aqueous concentation of Fe also affects its state; the Fe2þ
area gradually narrows as the aqueous Fe concentration
increases from 10À10 to 10À2 mol/L. Fe tends to remain
in solid form in soil and sediment owing to the higher
aqueous Fe concentration in pore water, but, when soil
is eroded into river water or when sediment is resuspended, Fe can be dissolved if pH and Eh are lower in
the Fe2þ area of Figure 4(a).
Most Mn leaching data fell in the Mn2þ area (Figure 4(b)),
indicating that Mn in the sediments is readily soluble in
water, as proved by the batch leaching tests. This contrasts
with Fe, which can be dissolved only if the sediments are
placed under strong anaerobic, i.e. reducing, conditions.
Around the area plotted with the data of the final leachate,
variation of Eh has less effect than pH. The concentration
of aqueous Mn2þ and partial pressure of carbon dioxide
P(CO2) also affected the leaching of Mn (Figure 4(b)). In
river sediments, Mn is estimated to remain as MnCO3
because of higher Mn2þ and P(CO2) in pore water, whereas
in the Saigon River Mn can be easily dissolved because of
lower aqueous Mn2þ and P(CO2) than in the pore water of
the sediments.
CONCLUSIONS
1. Two major sources of Mn and Fe inputs into the Saigon
River were identified: (1) acidic leaching from ASS in
the middle river section, and (2) dissolution from Mnand Fe-enriched sediments downstream.
2. Fe leaching from ASS was more critical than Mn leaching.
Low pH was a determinant cause of Mn and Fe leaching
from ASS. Reducing pH from 4 to 1.5 increased Mn leaching from PASS by 10 times and Fe leaching by 14 times.
3. The acidic pH in river water, especially in the rainy
season, facilitates Mn dissolution and its release from
sediments, whereas anoxia and low pH facilitate Fe
release. Aquatic Mn concentration and CO2 partial
pressure also contribute to Mn dissolution.
4. ASS-derived sediments (SG17 and SG18) had faster and
higher Mn and Fe leaching rates than the other sediments.
5. Land management and improvement of water quality
in the rainy season to avoid the acidification and DO
depletion will help to reduce Mn and Fe leaching into
the river water.
ACKNOWLEDGEMENTS
The Japan Society on Promotion of Science and the HCMC
Department of Science and Technology are greatly appreciated for funding to conduct this study.
2237
N. T. Van Ha et al.
|
Sources and leaching in the Saigon River Basin
REFERENCES
Abesser, C., Robinson, R. & Soulsby, C. Iron and manganese
cycling in the storm runoff of a Scottish upland catchment.
Journal of Hydrology 326, 59–78.
American Society for Testing and Materials (ASTD) Standard
Test Methods for Shake Extraction of Solid Waste with Water.
ASTMD-3987, American Society for Testing and Materials,
Annual Book of ASTM Standards v.11.04, pp. 24–27.
Davison, W. Iron and manganese in lakes. Earth-Science
Reviews 34, 119–163.
Green, R., Waite, T. D. & Melville, M. D. Characteristics of
the acidity in acid sulfate soil drainage waters, MCLeods
Creek, Northeastern NSW, Australia. Environmental
Chemistry 3, 225–232.
Guerios, B. B., Machado, W., Lisboa-Filho, S. D. & Lacerda, L. D.
Manganese behavior at the sediment-water interface in
a Mangrove dominated area in Sepetiba Bay – Abstract, SE
Brazil. Journal of Coastal Research 19 (3), 550–559.
Kohl, P. M., Medlar, S. J. & AWWA and USEPA Occurrence
of Manganese in Drinking Water and Manganese Control.
American Water Works Association, IWA Publishing,
Denver, Colorado, 184 pp.
Water Science & Technology
|
63.10
|
2011
US EPA Method 3051A – Microwave Assisted Acid Digestion
of Sediments, Sludge, Soils and Oils (Revision 1). US EPA
Washington, District of Columbia, 25 pp.
US EPA Drinking Water Health Advisory for Manganese,
Report 822-R-04–003, US EPA, Washington, District of
Columbia, 34 pp. Available from: />safewater/cci/pdf/dwadvisory (accessed 10 October 2006).
Wasserman, G. A., Liu, X., Parvez, F., Ahsan, H., Levy, D., FactorLitvak, P., Kline, J., Geen, A. V., Salvkovich, V., Lolacono,
N. J., Cheng, Z., Zheng, Y. & Graziano, J. H. Water
manganese exposure and children’s intellectual function in
Araihazar, Bangladesh. Environmental Health Perspectives
114 (1), 124–129.
Welch, S. A., Christy, A. G., Kirste, D., Beavis, S. G. & Beavis, F.
Jarosite dissolution I – Trace cations flux in acid sulfate
soils. Chemical Geology 245, 183–197.
World Health Organization (WHO) Manganese in Drinking
Water – Background Document for Development of WHO
Guidelines for Drinking-Water Quality. WHO/SDE/WSH/
03.04/104, World Health Organization, Geneva, 21 pp.
Youger, J. D. & Mitsch, W. J. Heavy metal concentration in
Ohio Revier sediments – Longitudinal and temporal patterns.
Ohio Journal of Science 89 (5), 172–175.