DSpace at VNU: Landslide susceptibility mapping by combining the analytical hierarchy process and weighted linear combination methods: a case study in the upper Lo River catchment (Vietnam)
Bạn đang xem bản rút gọn của tài liệu. Xem và tải ngay bản đầy đủ của tài liệu tại đây (7.4 MB, 17 trang )
Original Paper
Landslides
DOI 10.1007/s10346-015-0657-3
Received: 3 June 2015
Accepted: 11 November 2015
© Springer-Verlag Berlin Heidelberg 2015
Le Quoc Hung I Nguyen Thi Hai Van I Do Minh Duc I Le Thi Chau Ha I Pham Van Son I Nguyen
Ho Khanh I Luu Thanh Binh
Landslide susceptibility mapping by combining
the analytical hierarchy process and weighted linear
combination methods: a case study in the upper Lo
River catchment (Vietnam)
Abstract The purpose of this study is to carry out a regional
landslide susceptibility mapping for the upper Lo River catchment
(ULRC) in northern Vietnam, where data on spatial distribution of
historic landslides and environmental factors are very limited.
Two methods, analytical hierarchy process (AHP) and weighted
linear combination (WLC), were combined to create a landslide
susceptibility map for the ULRC study area. In the first step, 216
existing landslides that occurred in the study area were mapped in
field surveys in 2010 and 2011. A spatial database including six
landslide factor maps related to elevation, slope gradient, drainage
density, fault density, types of weathering crust, and types of land
cover was constructed from various sources. To determine the
relative importance of the six landslide factors and their classes
within the landslide susceptibility analysis, weights of each factor
and each factor class were defined by expert knowledge using the
AHP method. To compute the landslide susceptibility, defined
weights were assigned to all factor maps in raster format using
the WLC method. The result is a landslide susceptibility index that
is reclassified into four susceptible zones to produce a landslide
susceptibility map. Finally, the landslide susceptibility zonation
map was overlaid with the observed landslides in the inventory
map to validate the produced map as well as the overall methodology. The results are in accordance with the occurrences of the
observed landslides, in which 47.69 % of observed landslides are
located in the two most susceptible zones (very-high-susceptibility
zone and high-susceptibility zone) that cover 40.96 % of the total
area. As the approach is able to integrate expert knowledge in the
weighting of the input factors, the actual study shows that the
combination of AHP and WLC methods is suitable for landslide
susceptibility mapping in large mountainous areas at medium
scales, particularly for areas lacking detailed input data.
Keywords Landslide susceptibility . Geographical information
system . Analytical hierarchy process . Weighted linear
combination
Introduction
Landslide susceptibility is defined as “the proneness of the terrain to
produce slope failures” (Yalcin 2008). Landslide susceptibility mapping is the task of ranking areas in different degrees of landsliding
potential by combining some critical factors (landslide factors) that
contributed to the occurrences of inventoried landslides in the past
(Chalkias et al. 2014). For land use planning and management,
landslide susceptibility mapping can provide a basic tool for the
decision-makers to make appropriate development plans
(Gorsevski et al. 2006a; Feizizadeh et al. 2013). The process of landslide susceptibility mapping depends largely on the data availability,
the scale of investigation, and the analysis methods (Fell et al. 2008).
Landslide susceptibility mapping has been widely done for about
40 years (Nielsen et al. 1979; Brabb 1984; Varnes 1984; Wagner et al.
1988; Soeters and van Westen 1996), in which many researches have
applied integrated approaches to analyze the spatial distribution of
landslides and environmental factors as important indications of
slope instability. Geographical information system (GIS) and remote
sensing (RS) techniques are considered as advanced techniques to
improve and update the quality and quantity of these factors. With
the advanced technology development in the range of GIS and RS,
more sophisticated and accurate spatial models have been increasingly used worldwide, especially for the landslide susceptibility mapping as reviewed by Gorsevski et al (2006a).
In Vietnam, mountainous regions have recently played an important role in national economic development; however, they are prone
to a number of disastrous phenomena such as flash floods, landslides,
and debris flows. Particularly, the frequency and magnitude of landslides in those regions have increased in the past 20 years, causing
disastrous losses and damages to people, properties, economics, and
the environment (Saro and Dan 2005; Bui et al. 2011; Duc 2013).
Landslide susceptibility mapping is an urgent task for the government
to find proper and effective strategies in land use planning and
management for landslide-prone regions. Several studies on landslide
susceptibility mapping have been conducted in other mountainous
areas in Vietnam with consideration of the complex interactions
among controlling factors (Saro and Dan 2005; Bui et al. 2012b).
Some others applied modeling approaches, for example, frequency
ratio, weight of evidence, probabilistic approach, and neural networks, to evaluate the susceptibility of landslides in relation to tectonic fracture, slope gradient, slope aspect, slope curvature, soil type,
types of vegetation and land cover, etc. (Hung et al. 2005; Saro and
Dan 2005; Long and De Smedt 2008; Bui et al. 2011, 2012a). However,
those methods were mainly conducted in large regions (more than
1000 km2) at medium scales (1:100,000 to 1:50,000), while they were
only applied for critical areas at large scales (1:50,000 to 1:10,000), for
example, in the surroundings of a hydroelectric plant of Da River in
the northwest part of Vietnam (Khien et al. 2012).
Despite those recent achievements, landslide susceptibility
mapping in Vietnam is still a challenge for scientists because the
required data are unavailable or, if available, they are of poor
quality, which is a common problem worldwide as remarked by
Malczewski (2000), van Westen et al. (2006), and Fell et al. (2008).
Even if the necessary data are available, they are often collected
from various sources with different levels of uncertainty.
Therefore, it is difficult to adequately conduct a regional landslide
susceptibility mapping in Vietnam, and as a consequence, the
resulting susceptibility maps reveal low accuracy and reliability.
Landslides
Original Paper
Among several GIS-multicriteria decision analysis methods, the
analytical hierarchy process (AHP) and weighted linear combination (WLC) have been considered the most simple approaches in
regional landslide susceptibility mapping (Ayalew et al. 2004;
Yoshimatsu and Abe 2006; Ladas et al. 2007; Akgun et al. 2008;
Long and De Smedt 2008; Yalcin 2008; Wu and Chen 2009;
Intarawichian and Dasananda 2010; Feizizadeh and Blaschke
2013; Feizizadeh et al. 2013; Tazik et al. 2014). These two methods
are able to integrate expert knowledge in the weighting of the
input factors. To solve the problem of mapping landslide susceptibility in a large area where data on spatial distribution of historic
landslides and environmental factors are very limited, this study
uses a combination of the AHP and WLC methods in the
Vietnamese context. The case study refers to the upper Lo River
catchment (ULRC) in northern Vietnam.
Study area
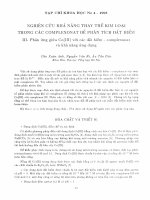
The ULRC is located in Ha Giang, one of the northern mountainous provinces in Vietnam (Fig. 1). This is a tectonically active area
where landslides often occur as one of the most common natural
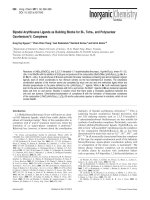
Fig. 1 Study area and shaded relief
image showing the surface
morphology. The black line
indicates the boundaries of the
administrative districts in the ULRC
Landslides
hazards (Khien et al. 2012). The ULRC covers an area of approximately 4528 km2 with strongly dissected and inclined terrain. It
comprises high mountains in the north and the west, in which
karst landscapes are the particular features of the north. The Lo
River is the main channel system in these regions. It originates
from the China territory and flows to the Vietnam territory with a
northwest–southeast direction. The Lo River and its tributaries
form a rather dense drainage network, with an average density
of approximately 1 km/km2; especially, it gets the highest density of
about 6 km/km2 in the southern part (Bac Quang District). Land
cover in the ULRC varies according to the topography, weathering
thickness of the substrate, and human activities, which have impact on the distribution of different types of forest and plantation.
The ULRC is characterized by a tropical climate with four seasons:
the winter period starts from November and ends in April, with an
average temperature ranging from 10 to 20 °C, but highly different
between day and night; the summer period starts from May and
ends in October, with an average temperature of around 27 °C; and
spring and autumn seasons are short with moderate temperatures.
In the study area, rainfall is considered as the main trigger that has
caused a number of disastrous events including landslides (Khien
et al. 2012). According to the 1976–2014 rainfall record database of
the National Centre for Hydro-meteorological Forecasting of
Vietnam, the ULRC has an average annual rainfall ranging from
2500 to 3200 mm/year, in which 90 % of the total rainfall occurs in
the summer (from May to October every year). Locating in the
central south part of the ULRC, Bac Quang District is one of the
areas that have the highest rainfall in Vietnam. This district can get
an annual rainfall up to 6000 mm in case of severe years.
In addition, as in many other mountainous areas in Vietnam,
the ULRC is located in a tropical monsoon climate region, where
weathering process has provided the most impacts on the rock
mass of the slopes. When the weathering process takes place on
natural slopes with steepness less than 20°, the weathering layers
can be well conserved, therefore resulting in rather thick weathered layers. Under extreme weather conditions, such as rains with
high density or long duration, landslides often occur on the natural slopes with highly weathered layers. The thicker the weathered layer is, the higher the volume of the landsliding mass will be.
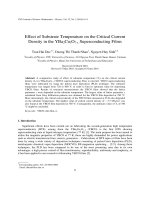
The field observations show that translational, rotational slides
and rock fall are the most common types of landslides in the
ULRC. The volumes/scales of landslides in this area are ranging
from small to very large. Figure 2 shows some landslides that
occurred in different places in which the soil and rock mass of
slope surfaces were influenced by weathering process at different
degrees.
Inside the ULRC, settlements are distributed with high densities
in the lower terrain where rapid urbanization takes place in recent
years (for example, Ha Giang City, Vi Xuyen Town), whereas they
are sparsely distributed in the high terrain where ethnic minorities
are the main inhabitants. In general, local people prefer to live
along the Lo River and its tributaries in order to facilitate their
daily lives. Along the river network, the development of transportation routes is of increasing importance.
In Vietnam, the ULRC is one of the mountainous regions that
are threatened by many types of geohazards such as landslides,
flash floods, debris flows, and river bank erosion that often occur
during rainy seasons, in particular shallow landslides with high
frequency. According to the Disaster Management Office of Ha
Giang province, tens of shallow landslides were reported every
year that caused deaths and injuries to people and damages and
losses to properties and the environment throughout the whole
catchment. Landslide phenomena are in many cases related to
human activities, particularly to urban development and road
constructions causing slope disturbance.
A regional landslide susceptibility mapping is required in order
to support land use planning and management by improving
knowledge on landslide evolution through scientific investigations. However, the reports on historic landslides were not systematically kept up-to-date in any form of disaster database.
Scientists can only get disaster-related information through public
media or annual reports of the local authorities, which contain
mainly statistic summation of losses and damages rather than
detailed observations that limits very much the availability and
quality of historic landslide data as well as geodata on controlling
and triggering factors in the study area. Therefore, it is not possible to apply statistical or deterministic methods to carry out an
adequate landslide susceptibility mapping for the whole ULRC.
Methodology
In this study, the two methods, AHP and WLC, were combined in a
GIS environment for regional landslide susceptibility mapping in
the ULRC. The AHP was applied to define the relative importance
of the landslide factors and their classes in landslide susceptibility
Fig. 2 a–d Common types of
landslides were often observed in
the ULRC (photos taken from the field
in 2011)
Landslides
Original Paper
by computing weights for each factor and each factor class. The
WLC method was applied to assign on the one hand relative
importance to the factor maps and to produce on the other hand
raster datasets of similar resolution and format for subsequent
overlay. A brief overview of these methods and detailed elaboration of the approach are described in the following sections.
General overview of the AHP and WLC methods
The AHP was introduced by Thomas Saaty (1980). The AHP is based
on three principles: decomposition, comparative judgment, and synthesis of priorities (Malczewski 1999). The AHP is widely applied in
many areas because of its simplicity and robustness in obtaining
weights and integrating heterogeneous data (Gorsevski et al. 2006b).
It is one of the multi-attribute techniques that can incorporate expert
judgment into the GIS-based landslide susceptibility analysis to compute weights for different criteria (Intarawichian and Dasananda
2010; Feizizadeh and Blaschke 2013; Feizizadeh et al. 2013). It allows
the active participation of decision-makers from disaster risk management and from other disciplines, which require disaster control
and mitigation measures. It also provides a rational basis on which to
allow evidence-based decisions (Feizizadeh et al. 2013). In landslide
susceptibility mapping, AHP is applied to weight and rank the influence (the relative importance) of each landslide factor and its classes
based on the occurrences of landslides in the study area. Therefore,
this method has been used as the decision analysis technique for the
evaluation of the relative importance to landslide activities in many
areas in the world (Ladas et al. 2007) as well as in Vietnam (Long and
De Smedt 2012). The following steps as adapted by Rajput and Shukla
(2014) are involved in the AHP method:
(1) Decomposition of the complex problem into smaller ones.
(2) Construction of a decision matrix and determination of the
priority score using a 9-point scale for pairwise comparisons
as described in Table 1.
(3) Execution of the comparative judgment with the element in
Table 1.
(4) Normalization of the comparison matrix by dividing each
column by the sum of the entries of that column.
(5) Calculation of the eigenvector value of n normalized matrix
to obtain the relative weight of the criteria. To calculate
weights for each compared factor using the AHP approach,
the comparison matrix means the weight matrix. Therefore,
eigenvector values indicate weighted values of comparison
factors.
(6) Checking the consistency of the comparison using the consistency index (CI), random index (RI), and consistency ratio
(CR) as explained in Tables 2 and 3, in which the CR must be
lower than 0.1 to accept the computed weights; otherwise, the
pair comparison needs to be recalculated.
(7) Using the resulting evaluation scores to order the decision
alternatives from the most to the least desirable.
The great advantage of this approach is that it rearranges the
complexity of a dataset by the hierarchy with a pairwise comparison between two landslide factors or between two classes within
one landslide factor. This comparison allows reducing subjectiveness in weighting and thus creates coherence in processing different data. Another advantage of the AHP is that it allows validating
pair consistency. From eigenvector values, one consistency value is
determined, which is used to recognize the inconsistency or dependency between two factors. The transitive of factors in the AHP
is understood as, for example, if factor A is more preferred than
factor B, and factor B is more preferred than factor C, then factor
A should be more preferred than factor C. From that, the CI, RI,
and CR are calculated in order to validate the consistency of the
comparison (Saaty 2000). All these indices and ratios are arranged
in a range from 0 to 1. The CR is a ratio between the matrix’s
consistency index and random index. The random index is the
Table 1 Adopted scale of absolute numbers for pairwise comparison (Saaty 2008)
Intensity of importance
Definition
Explanation
1
Equal importance
Two activities contribute equally to objectives
2
Weak or slight
3
Moderate importance
4
Moderate plus
5
Strong importance
6
Strong plus
7
Very strong or demonstrated importance
8
Very, very strong
9
Extreme importance
The evidence favoring 1 activity over another is of the
highest possible order of affirmation
Reciprocals of above
If activity i has 1 of the above non-0 numbers
assigned to it when compared with activity j,
then j has the reciprocal value when compared with i
A reasonable assumption
Landslides
Experience and judgment slightly favor 1 activity
over another
Experience and judgment strongly favor 1 activity
over another
An activity is very strongly favored over another; its
dominance is demonstrated in practice
Table 2 List of equations adopted in this study
Equation number
Equation expression
ðλmax −nÞ
n−1
Equation 1
CI ¼
Equation 2
CR ¼ CI
RI
Equation 3
LSI ¼ ∑ W j wi j
n
j
average consistency index obtained by generating large numbers
of random matrices (i.e., 500 matrices, as in the publication of
Saaty (2000)). If CR is less than 0.1, the consistency of the model is
acceptable; if it is greater than 0.1, the pairwise comparison needs
to be recalculated.
However, the disadvantage of the AHP, as remarked by
Gorsevski et al. (2006b), is that it does not adequately solve the
ambiguity and imprecision associated with the conversion from
qualitative categorical data into ordinal variables used in the
comparison matrix. The AHP also shows some uncertainties in
the selection of priorities, measurement scale, and ranking. For
example, the measurement scale is still not agreed among scientists: although Saaty (1977) originally proposed a scale with measures from one to nine (1–9), other scientists such as Dodd and
Donegan (1995) have criticized the absence of a zero in the scale. In
the selection of priorities, in general, AHP pairwise comparison
provides an ability to rank all parameters in order; however, if
there is a small difference in weight value between two parameters,
it is not able to decide which one is preferable to another
(Banuelas and Antony 2004). More details about uncertainties in
the measurement scale of the AHP are discussed in the publication
of Jiří Franek and Aleš Kresta (2014).
Despite those disadvantages, the AHP method has been widely
used for practical applications, particularly in combination with
other methods to take into account expert assessment. The combined methods often involve expert judgments to improve inconsistencies in susceptibility mapping in the areas that have nonsystematic input data, as remarked by Banuelas and Antony
(2004). Experts from different disciplines related to landslide
research are grouped to judge and break down the robust landslide
factors to hierarchy; then, supplemented by observations in the
field, the analyses of each expert are grouped and taken into
account for the factor comparison of the AHP.
The WLC was first introduced by Voogd (1983). This aggregation method is one of the most often used decision models in GIS
to derive composite maps for landslide susceptibility assessment
and mapping (Malczewski 2000; Ayalew et al. 2004). After the
relative weights are generated by other methods such as AHP,
the weights are aggregated by the WLC to form a single score of
evaluation (Gorsevski et al. 2006b). This method can be taken as a
hybrid between qualitative and quantitative methods. In the spatial database prepared for the study, each thematic map, which
represents a landslide factor, comprises a number of classes according to different homogeneous areas distributed in the
Explanation of parameters
CI, consistency index
n, number of elements to be compared
λmax, maximum eigenvector
CR, consistency ratio that should be lower than 0.1;
otherwise, the pair comparison needs to be recalculated
RI, random index (Table 3)
LSI, landslide susceptibility index
Wj, weight of landslide factor j
wij, weight of class i in landslide factor j
n, number of landslide factors
territory. Using the WLC method, the classes of the landslide
factors are standardized to a common numeric range and then
combined by means of a weighting (Ladas et al. 2007). After the
relative weights are generated by other methods such as the AHP,
the weights are aggregated by the WLC to form a single score of
evaluation (Gorsevski et al. 2006b). Each criterion is multiplied by
its weight from the pairwise comparison, and the results are
summed to form the final score, as expressed by Equation 3 in
Table 2. There are six steps involved in the WLC procedure
(Malczewski 2000) including:
(1) Defining the set of landslide factors, which depend largely on
the availability of georeferenced data in digital form.
(2) Defining the set of factor classes (feasible alternatives), into
which each landslide factor is classified.
(3) Generating landslide factors and their classes as thematic
maps in GIS.
(4) Assigning weights to thematic maps, in which weights are
generated by the AHP method.
(5) Combining maps and weights to produce a new combined
map using Equation 3 in Table 2.
(6) Classifying the values (combined weights) of the new combined map into landslide susceptibility categories (the alternatives) to establish a landslide susceptibility zonation map.
The assessment of priorities on score ranking can express the
degree of landslide susceptibility adequately. A ranking scale
is used with the following principle: one end of the scale is
labeled with an expression and the other end of the scale is
labeled with an opposite expression. Below is an example of
the ranking scale:
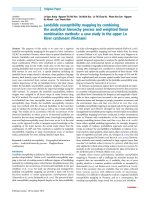
The workflow for landslide susceptibility mapping of ULRC
The procedure of applying the combination of the two methods,
AHP and WLC, for landslide susceptibility mapping in the ULRC
is shown in Fig. 3. In the beginning, the 216 historic landslide
locations were inventoried and mapped by field surveys in 2010
and 2011. This landslide inventory map was used in the final stage
to validate the reliability of the result map. A spatial database was
constructed in a GIS environment that includes six landslide factor
maps related to elevation, slope gradient, drainage density, fault
density, types of weathering crust, and types of land cover. Those
factors were compiled from various sources according to the
available data for the study area. Later, the AHP method was used
Landslides
1.59
1.57
1.56
1.48
1.51
1.49
1.45
0
RI
0
0.58
0.9
1.12
1.24
1.32
1.41
10
4
3
2
1
Number
Table 3 Random indices (RI) for a matrix of n elements (Saaty 1977)
5
6
7
8
9
11
12
13
14
15
Original Paper
Landslides
to define weights for the landslide factors and for the classes of
each factor. The weights were assessed according to expert knowledge and studies from the field surveys. Then, the WLC method is
used to compute weighted factor maps to assess the landslide
susceptibility using a landslide susceptibility index (LSI). The
LSI is calculated by summation of the weighted value of each
factor multiplied by the weighted value of each factor class, as
expressed by Equation 3 in Table 2. In this equation, the values of
Wj and wij are determined based on pairwise comparison and
calculation of eigenvectors by applying the AHP approach, in
which Wj is the eigenvector value of the matrix describing the
landslide causal factor relations, while wij is the eigenvector value
of the matrix describing the relationship of classes of one landslide factor. The LSI values characterize the comparative susceptibility for landslide occurrence; hence, if the index is higher, the
area will be more prone to landslides. When the LSI map is
produced by the WLC method, it is then reclassified to produce
a landslide susceptibility zonation map as a result of the landslide
susceptibility mapping process. Finally, a sensitivity analysis was
performed to validate the produced map as well as the overall
study methodology by overlaying the landslide susceptibility zonation map with the landslide inventory map.
Input data and factor mapping
In this study, a spatial database was constructed in a GIS environment (e.g., ArcGIS 9.2) that includes a landslide inventory map
and six landslide factor maps. Details of the landslide inventory
and landslide factor mapping are described in the following
sections.
Landslide inventory mapping can be defined as the task of
recording “the location and, where known, the date of occurrence
and the types of mass movements that have left discernible traces
in an area” (Guzzetti et al. 2012). It can be used as a preliminary
step towards landslide susceptibility, hazard, vulnerability, and
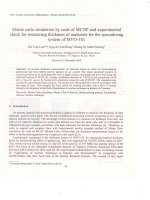
risk assessment and mapping. In this study, an inventory of 216
existing landslides in the ULRC was mapped by two field surveys
in 2010 and 2011. The landslide inventory, as shown in Fig. 4,
indicates that landslides were mostly found in the central parts
of the ULRC, especially densely populated areas such as Ha Giang
City, Vi Xuyen Town, and some surrounding communities. There
are also a number of landslides distributed along the main roads
where many slopes were cut for house and road constructions
such as Highway No. 2, No. 4, and local roads. Those landslides
occurred on cut slopes (made by construction activities), but they
were still triggered by rainfall; therefore, all landslides on natural
slopes and cut slopes were integrated into the inventory of this
study.
The landslide factors can be defined as controlling (or causal)
factors and triggering factors. The controlling factors determine
the initial favorable conditions for landslide occurrence while the
triggering factors determine the timing of landsliding (Ladas et al.
2007). A landslide in any location usually has several controlling
factors but only one triggering factor. In the ULRC, heavy rainfall
is the main landslide triggering factor; however, the detailed
rainfall data and maps were not available. Therefore, only the
controlling factors are incorporated to establish the landslide
susceptibility mapping.
The landslide factor maps can be represented by relevant
thematic maps and generated in a GIS environment. In this study,
Fig. 3 Procedures of the landslide
susceptibility mapping using the
combination of AHP and WLC
methods
six landslide factors in the ULRC at a scale of 1:100,000 were
compiled from different available sources, including elevation,
slope, drainage, fault, weathering, and land cover. Among them,
three maps related to elevation, slope, and drainage were extracted
from 1:50,000-scale topographic maps; two maps related to fault
and weathering were constructed from 1:200,000-scale geological
maps and field observations; and the land cover map was compiled from the 1:100,000-scale forest maps. The landslide factor
maps of the ULRC are given in Fig. 5. To be employed for landslide
susceptibility analysis in a later stage, the main attributes of those
six maps were grouped into different classes using Jenks Natural
Break classification in ArcGIS 9.2. Jenks Natural Break classification is used to define the best arrangement of values into different
classes. This method seeks to reduce the variance within classes
and maximize the variance between classes. Therefore, this classification was used instead of expert knowledge in order to keep in
the classified maps the actual distribution of different homogeneous zones in the study area. A brief description of those six
landslide factor maps is as follows:
– The elevation map (E) was derived from a digital elevation
model (DEM) with a ground resolution of 20×20 m, which
was interpolated from 1:50,000-scale topographic maps.
The ULRC terrain altitude has an elevation ranging from
40 to 2420 m a.s.l. By the natural distribution of the
terrain altitude, the elevation map is classified into five
levels of elevation: (1) <313.6 m, (2) 313.6–633.4 m, (3)
633.4–981.3 m, (4) 981.3–1391 m, and (5) >1391 m. The
elevation is chosen as the controlling factor based on field
observations, and the occurrence of landslides is also
changed corresponding with the change of elevation. The
study area is determined as a mountainous region, with
the lowest elevation at 40 m a.s.l. The elevation map is
shown in Fig. 5a.
– The slope map (S) was derived from the same DEM that
produced the elevation map. It has a maximum steepness of
up to 83°. By the natural distribution of the terrain slope, the
slope map is classified into five levels of gradients: (1) <8.3°, (2)
8.3°–19.9°, (3) 19.9°–29.3°, (4) 29.3°–40.3°, and (5) >40.3°. This
classification is almost equivalent to terrain division for agriculture in the mountainous regions of Vietnam, which is based
on the agriculture slope classification criteria of the Ministry of
Agriculture and Rural Development. The slope map is shown
in Fig. 5b.
Landslides
Original Paper
Fig. 4 Observed landslides in the
inventory map of the ULRC
– The drainage density map (D) was derived from the same DEM
that produced the elevation map and combined with the river
system that was extracted from 1:50,000-scale topographic
maps. Both permanent and temporary runoffs were taken into
account because the temporary runoffs are closely related to
slope erosion degree while the permanent runoffs are closely
related to rainfall. The features of drainage density play an
important role in inducing landslide phenomena in this area.
The drainage network of the ULRC has a rather high density
and concentrates in the south with a maximum of up to 6 km/
km2. By the natural distribution of the drainage network, the
drainage density map is classified into five levels of density: (1)
<0.5 km/km2, (2) 0.5–1.3 km/km2, (3) 1.3–2.1 km/km2, (4) 2.1–
3 km/km2, and (5) >3 km/km2. The drainage density was used
instead of distance to drainage lines according to the geomorphology of the area. The ULRC is characterized by various
types of terrains with different densities of runoffs that cause
different numbers of landslides. Figure 2a shows occurrences
of several landsides close to a main stream in a commune of Vi
Landslides
Xuyen District that has a moderately high density of drainage.
The drainage density map is shown in Fig. 5c.
– The fault density map (F) was extracted from the 1:200,000scale geological maps. The highest density of up to 0.78 km/
km2 mainly distributes in the central part of the ULRC. By the
natural distribution of the fault system, the fault density map is
classified into five levels of density: (1) <0.175 km/km2, (2)
0.175–0.3 km/km2, (3) 0.3–0.42 km/km2, (4) 0.42–0.57 km/
km2, and (5) >0.57 km/km2. The fault density map is shown
in Fig. 5d.
– The weathering crust map (W) was produced from the
1:200,000-scale geological maps and field surveys. Weathering
crusts have been considered as an important controlling factor
regarding the landslide phenomena not only in the ULRC but
also in most of the mountainous areas of Vietnam. The impact
of weathering process on geological formations has been considered to result in different types of “weathering crusts.” The
crust types are recognized by the mineral and chemical compositions and types of bedrocks from which the weathered
Fig. 5 Landslide factor maps: a elevation (E), b slope (S), c drainage density (D), d fault density (F), e weathering crust (W), and f land cover (L)
products are formed. There are seven main types of weathering
crusts as follows:
(1) Quaternary formations that are composed of loose
sediments
(2) Carbonate rocks that are composed of carbonate
minerals
(3) Bedrock, slightly weathered rock, or areas with a small
weathered layer
(4) Sialferite crust that is weathered on acid igneous rocks,
neutral igneous rocks, sedimentary rocks, and metamorphic rocks
(5) Sialite crust that is weathered on acid igneous rocks,
neutral igneous rocks, and eruptive sedimentary rocks
(6) Ferosialite crust that is weathered on ultramafic igneous
rocks, mafic igneous rocks, sedimentary rocks, and
metamorphic rocks
(7) Silixite crust that is weathered on quartz sandstone,
quartzite, and schist
In addition to those seven main types, there are many other
subtypes of weathering crusts, which are derived from the crust
type (3) with different thicknesses of weathered layers or which are
the mixture of the above four main crusts (4), (5), (6), and (7).
In the ULRC, there are ten types of crusts: (1) Quaternary
formations distributed in low areas, which are little prone to
landslides; (2) carbonate rocks distributed in rocky mountains;
(3) bedrock, slightly weathered rock, or areas with a weathered
layer less than 1 m; (4) slightly weathered rock or areas with a
weathered layer less than 2 m; (5) sialferite crust; (6) sialferitesialite crust that is a mixture of sialferite and sialite crusts; (7)
ferosialite crust; (8) ferosialite-sialferite crust that is a mixture of
ferosialite and sialferite crusts; (9) ferosialite-silixite crust that is a
mixture of ferosialite and silixite crusts; and (10) sialferite-silixite
crust that is a mixture of sialferite and silixite crusts. Among those
ten crusts, three types—(2), (3), and (4)—have little conservation
of weathering materials. The weathering crusts in the ULRC normally have thicknesses ranging from 2.5 to 10 m. In some parts
such as Hoang Su Phi District, the thicknesses of weathering crusts
are from 5 m up to tens of meters. The weathering crust map is
shown in Fig. 5e.
– The land cover map (L) was extracted from the 1:100,000-scale
forest maps, which were constructed in 2010. This factor map
presents 11 types of land cover that distribute in the ULRC
Landslides
Original Paper
including (1) rocky mountain, (2) rich forest, (3) bamboo
forest, (4) medium forest, (5) mixed-type forest, (6) plantation
forest, (7) productive young forest, (8) non-productive young
forest, (9) poor forest; (10) agricultural and other land, and (11)
settlements and barren land. The land cover map is shown in
Fig. 5f.
Factor weighting and susceptibility index
The analyses for weighting and ranking of the landslide factors
and their classes are mainly based on expert knowledge about the
natural features that distribute over the whole region. The
weighting and ranking scale is defined in a range of 0–1. Six
landslide factors are evaluated using pairwise comparison in the
AHP method. The weights are presented by the eigenvalues as
given in Table 4, in which the slope factor has the highest
eigenvalue (0.3310) while the elevation factor has the lowest
value (0.0463). From the results of pairwise comparison, the
eigenvalues were assigned as weighting values Wi corresponding to individual landslide factors. The obtained consistency
ratio (CR) of 0.0218 indicated an adequate degree of consistency in the comparison; thus, all values were taken into the
WLC model in the GIS environment. From the results of these
pairwise comparisons as given in Table 5, the eigenvalues
were assigned as weighting values wji, corresponding to classes of each landslide factor. All CR smaller than 0.1 indicate
the weights of all factor classes are accepted. Using the WLC
method, Equation 3 as given in Table 2 was applied to all
landslide factors to produce the landslide susceptibility index
(LSI) map (Fig. 6).
From Equation 3 in Table 2, the applied equation is expressed as
follows:
LSI ¼ 0:0463*E þ 0:0705*D þ 0:1116* F þ 0:1785*L
þ 0:2621*W þ 0:3310*S
in which variables E, D, F, L, W, and S are abbreviations of the
landslide factors: elevation, drainage density, fault density, land
cover, weathering crust, and slope, respectively. LSI represents the
relative susceptibility of a landslide occurrence; therefore, the
higher the LSI, the more susceptible the area is to landslides. The
LSI values were normalized to the range 0–1 in order to perform
the consistency in comparison and classification across all factors.
The final landslide susceptibility map and discussion
The landslide susceptibility zonation map as shown in Fig. 7 represents the final susceptibility map of the study area. It was
established by reclassifying the LSI map using natural breaks in
the cumulative frequency histogram of LSI values, as presented in
Fig. 6 and Table 6. The surfaces of the study area were classified
into four landslide susceptibility zones, namely “low,” “moderate,”
“high,” and “very high,” that account for 21.57, 37.46, 29.21, and
11.75 % of the total areas, respectively (Table 7).
To validate the final susceptibility map as well as the overall
methodology, the landslide susceptibility zonation map was then
overlaid with the observed landslides in the inventory map. As
presented in Table 7, out of 216 observed landslides, 50 landslides
(∼23.15 %) fall within the low-susceptibility zone, 63 landslides
(∼29.17 %) fall within the moderate-susceptibility zone, 83 landslides (∼38.43 %) fall within the high-susceptibility zone, and 20
landslides (∼9.26 %) fall within the very-high-susceptibility zone.
The results are in accordance with the occurrences of the observed
landslides, in which 47.69 % of observed landslides are located in
the two most susceptible zones (very-high-susceptibility zone and
high-susceptibility zone) that cover 40.96 % of the total area. This
simple type of validation based on spatial cross-checking of the
mapping results serves as a first indicator for the plausibility of the
landslide susceptibility map. A true validation of the overall methodology, however, is only supported to some extent by now.
In this study area, landslides have been observed in two types of
slopes: natural slopes that are not influenced by human activities
and cut slopes that are influenced by human activities such as
excavation of slopes for road and house constructions. But those
inventoried landslides were all triggered by rainfall. Landslides
that were triggered by human activities (such as mining and
excavating) were not registered in the inventory map and therefore
not taken into account for the analysis of landslide susceptibility.
Such anthropogenic interventions were considered as the driving
factor that accelerates the landsliding process, not as the triggering
factor that plays as a final cause to landslides. In the weighting of
the input factors, the authors mainly took into account the natural
impacts of environmental factors to assess the natural potential of
landsliding or natural landslide susceptibility. This explained why
in the final landslide susceptibility zonation map, many
inventoried landslides were found in the low-susceptibility zone.
This information from the result map is valuable to recommend to
the local authorities and communities for landslide hazard mitigation and risk reduction. They must take adequate measures for
Table 4 Pairwise comparison matrix, weights, eigenvector values, and consistency ratio (CR) of the landslide factors
Landslide factors
(1)
(2)
(3)
(4)
(5)
(1) Elevation
1
(2) Drainage density
2
1
(3) Fault density
3
2
1
(4) Land cover
4
3
2
1
(5) Weathering crust
5
4
3
2
1
(6) Slope
5
4
3
2
2
(6)
Eigenvector value
0.0463
0.0705
0.1116
0.1785
0.2621
1
0.3310
CR=0.0218
Landslides
Landslides
3
5
3
(3) 633.4–981.3
(4) 981.3–1391
(5) ≥1391
3
5
6
7
(2) 0.173–0.294
(3) 0.294–0.422
(4) 0.422–0.570
(5) >0.570
2
4
5
6
(2) 0.5–1.3
(3) 1.3–2.1
(4) 2.1–3.0
(5) >3.0
3
4
(5) Mixed-type forest
(6) Plantation forest
6
3
(4) Medium forest
(8) Non-productive young forest
3
(3) Bamboo forest
5
2
(2) Rich forest
(7) Productive young forest
1
(1) Rocky mountain
Land cover
1
(1) <0.5
Drainage density (km/km2)
1
(1) 0.173
Fault density (km/km )
2
2
1
(2) 313.6–633.4
(1)
(1) ≤313.6
Elevation (m)
Landslide factors
5
4
3
2
2
2
1
5
4
3
1
5
4
3
1
2
3
2
1
(2)
4
3
2
1
1
1
3
2
1
3
2
1
1
2
1
(3)
4
3
2
1
1
2
1
2
1
1/2
1
(4)
4
3
2
1
1
1
1
(5)
Table 5 Pairwise comparison matrices, weights, eigenvector values, and consistency ratios (CR) of all classes of each factor
3
2
1
(6)
2
1
(7)
1
(8)
(9)
(10)
(11)
0.1064
0.0756
0.0520
0.0338
0.0338
0.0338
0.0225
0.0163
CR=0.0219
0.4241
0.2717
0.1749
0.0780
0.0514
CR=0.0307
0.4245
0.2728
0.1772
0.0836
0.0419
CR=0.0039
0.2121
0.3865
0.2121
0.1198
0.0694
Eigenvector
value
Landslides
7
8
9
(9) Poor forest
(10) Agriculture and other lands
(11) Barren land
9
9
(9) Ferosialite-silixite crust
(10) Sialferite-silixite crust
1
2
4
5
7
(1) ≤8.3
(2) 8.3–19.9
(3) 19.9–29.3
(4) 29.3–40.3
(5) >40.3
Slope (°)
8
(8) Ferosialite-sialferite crust
7
(5) Sialferite crust
7
3
(4) Bedrock and slightly weathered rock
or weathered layer <2 m
8
2
(3) Bedrock and slightly weathered rock
or weathered layer <1 m
(6) Sialferite-sialite crust
2
(2) Carbonate rock
(7) Ferosialite crust
1
(1) Quaternary formations
Weathering crust
(1)
Landslide factors
Table 5 (continued)
6
4
3
1
8
8
7
7
6
6
2
1
1
8
7
6
(2)
4
2
1
7
7
6
6
5
5
2
1
7
6
5
(3)
3
1
6
6
5
5
4
4
1
7
6
5
(4)
1
3
3
2
2
1
1
7
6
5
(5)
3
3
2
2
1
6
5
4
(6)
2
2
1
1
5
4
3
(7)
2
2
1
4
3
2
(8)
1
1
3
2
1
(9)
1
2
1
(10)
1
(11)
CR=0.0314
0.4888
0.2362
0.1565
0.0713
0.0472
CR=0.0105
0.2165
0.2165
0.1413
0.1413
0.0950
0.0950
0.0349
0.0241
0.0194
0.0159
CR=0.0286
0.2761
0.2024
0.1473
Eigenvector
value
Original Paper
Fig. 6 Landslide susceptibility index (LSI) map of the ULRC (left) and the cumulative frequency histogram of LSI values (right) that breaks naturally into four classes of LSI
values
land use planning or carrying out any construction work even if
they settle in the lower elevation or lower slope gradients.
In the low-susceptibility zone, people often excavate natural
slopes for house and road constructions and make stable slopes
become susceptible to landslides during the rainy season. That
explains why many existing landslides (50 locations, equivalent
to 23.15 % of the total inventory) were found in the lowsusceptibility zone. On the other hand, as shown in the final
landslide susceptibility zonation map (Fig. 7), the very-high- and
high-landslide-susceptibility zones (>40 % of the total area) are
located largely in Vi Xuyen District, and partly in Bac Quang
District, where landslide factors contribute the most favorable
conditions to landsliding potential: (1) highest fault density
(>0.422 km/km2) because they locate in the center of the Lo
River fault zone; (2) rather dense drainage system (from 0.5 to
3 km/km2); (3) slope gradients of lower than 40° with conserved
thick weathering layers (2–20 m); (4) distribution of the four
weathering crust types—sialferite-silixite, ferosialite-silixite,
ferosialite-sialferite, and ferosialite—which are the most susceptible to landsliding; (5) lithology comprises of shales, shaleserixites, siltstones, and sandstones, which are easily weathered
and then swollen in wet condition, inducing slope instability
during or after raining; and (6) barren land that distributes over
areas influenced by human activities. Thus, the final predicted
map (landslide susceptibility zonation map) shows reliable
results.
The fact shows that many existing landslides were found
inside or close to areas related to human activities such as
settlements, transportation routes, terraced fields, mining
sites, deforestation land, and barren land; therefore, the occurrences of landslides in the moderate- or low-susceptibility
zones are attributed to local impacts. Those susceptibility
zones are often characterized by natural features such as
lowland, gentle slope, low density of drainage and faulting,
and loose sediment. Therefore, these places are theoretically
favorable for human settlements and unfavorable for
landsliding. From field observations in 2010 and 2011, together with studies on available literatures (topographic maps,
geological maps, and forest maps), in summary, landslides
in the ULRC often occur in the areas with the following
characteristics:
(1) Steepness of the natural slope is greater 20° and/or steepness
of the cut slope is greater than 45°
(2) Bare land or less vegetation cover (such as young forest, poor
forest)
(3) Place close to residential areas, where many cut slopes are
created that foster landslide occurrences as the result of
inadequate designs of cut slopes or due to the weathering
process on the slope surface
(4) Slope surface easy to store water/rich in water that weakens
the strength of slope materials
Landslides
Original Paper
Fig. 7 Landslide susceptibility
zonation map of the ULRC
(5) Loose weathering crusts, which contain silts, sandstones, and
siltstones, on top of the bedrocks clay schist, clay schistserixite (as with ferrosillite crust)
(6) High annual rainfall and high rainfall frequency (as in Bac
Quang District)
(7) Complex geological structures, mostly with high density of
faults as in the central part of Vi Xuyen District
To analyze the final susceptibility map in relation to the controlling factors in the ULRC, the distribution of the observed
landslides over the landslide factor maps was assessed by calculating the percentage of areas and the observed landslides distributed per landslide factor class over the ULRC. The percentage of
area is calculated as the ratio of class area per total area, for each
landslide factor. The percentage of observed landslide is calculated
Table 6 Reclassification of LSI values to produce the landslide susceptibility zonation map
Cumulative frequency of LSI values (%)
Susceptibility index (LSI)
Landslide susceptibility classes
22
LSI<0.11582
Low
59
0.11582
Moderate
88
0.1564
High
100
LSI>0.2032
Very high
Landslides
Table 7 Summary of the distribution of the predicted landslide susceptibility classes in the landslide susceptibility zonation map compared with the observed landslides in
the landslide inventory map
Landslide susceptibility class
Low
Predicted landslide susceptibility classes
Percentage (%)
Area (km2)
Observed landslides
Number
Percentage (%)
977
50
23.15
21.57
Moderate
1696
37.46
63
29.17
High
1323
29.21
83
38.43
Very high
532
11.75
20
9.26
Total
4528
100
216
100
as the ratio of the number of landslides that occurred within one
factor class per the total number of observed landslides that
occurred in the research area, i.e., the dataset of 216 landslides in
the inventory map. The calculation results are shown in Table 8.
As presented in Table 8:
– 74.54 % of observed landslides distribute in the elevations of
less than 313.6 m; subsequently, the higher the elevation is, the
lower the number of landslides that occurred.
– More than 80 % of observed landslides distribute in the slopes
with gradients less than 29.3°; particularly, 34.72 % of observed
landslides distribute in the gradients of less than 8.3°. The
slopes having this range of gradients often contain thick layers
of weathered soils that are still well conserved on those slope
surfaces.
– More than 55 % of observed landslides distribute in the drainage densities of higher than 1.3 km/km2. Particularly, during
heavy rainfall, landslides often occur in the areas with high
drainage density which are prone to shallow-seated landslide
or in the areas with low drainage density which are prone to
large-scale landslides.
– About 80 % of observed landslides distribute in the areas
having fault densities of higher than 0.3 km/km2; particularly,
28.70 % of observed landslides distribute in the areas having
fault densities of less than 0.5 km/km2.
– About 54 % of observed landslides distribute in barren land or
land with less vegetation cover (such as poor forest, young forest).
– About 21 and 30 % of observed landslides distribute in the
ferosialite crust and weathered carbonate rock, respectively.
That was in accordance with the fact that ferosialite crust is
rich in clay mineral and very easy to be weathered, while
landslides on carbonate rock are mainly related to human
activities (road constructions, mining).
The fact shows that development of landslides in mountainous
areas in the ULRC is closely related to weathering layers, where
rock and soil mass of the slopes have been deteriorated over time
due to the weathering process, which results in different types of
weathering crusts with different thicknesses. Having the same
natural conditions (such as the same slope gradient, land cover,
and weathering thickness), the ferosialite crust is the most susceptible to landslides and the silixite crust is the least susceptible to
landslides. The mixed types of crusts are more susceptible to
landslides than the single types. That is in accordance with the
fact that landslides often occur on the sialferite or ferosialite crusts
that contain loose materials with thickness from 1 m up to tens of
meters. It could be argued that, even though the thickness of the
weathering layer may be deep to tens of meters, the weathering
materials are very weak and easily saturated in heavy rainfall.
Conclusions
The frequency of landslides in the ULRC in northern Vietnam has
increased with the rapid urbanization and the economic development of the ULRC in the last 10 years. A regional landslide
susceptibility mapping is required to provide a foundation for a
long-term land use planning that includes landslide mitigation
measures in the region. The lack of historical landslide data in
the region has made the landslide susceptibility assessment difficult. In this study, 216 historic landslides were mapped by field
surveys.
Among many available techniques worldwide, the integrated
analytical hierarchy process (AHP) and weighted linear combination (WLC) approach in landslide susceptibility mapping was
applied. The results revealed the effectiveness of the combination
of AHP and WLC for landslide susceptibility mapping in a region
with limited data on spatial distribution of landslides and environment factors. Therefore, this approach can quickly result in the
final maps in order to provide the local authority and community
better strategies for disaster mitigation and management.
However, this approach still depends very much on the experience
and knowledge of individual experts.
The final susceptibility map of the ULRC is established
based on six factors: the elevation (E), slope (S), drainage
density (D), fault density (F), weathering crust (W), and land
cover (L). Among these factors, the slope and weathering
crust are of utmost importance. The result shows that 77 %
of the area of the ULRC is in the moderate-susceptibility zone
to the very-high-susceptibility zone. This is important for the
local government since human activities are the cause of
many landslides that occur in the low-susceptibility zone
(23 % of the ULRC).
Landslides
Original Paper
Table 8 Percentage of area and observed landslides that distribute per landslide
factor class over the ULRC
Landslide factors and
their classes
Distributed
area (%)
Observed
landslides
(%)
Elevation
Table 8 (continued)
Landslide factors and
their classes
Distributed
area (%)
Observed
landslides
(%)
Sialferite crust
20.43
18.52
Ferosialite crust
10.76
21.30
<313.6
39.78
74.54
Ferosialite-sialferite crust
4.69
7.87
313.6–633.4
20.77
17.59
Sialferite-sialite crust
17.49
7.41
633.4–981.3
18.30
6.48
Sialferite-silixite crust
2.38
0.00
981.3–1391
14.29
1.39
Ferosialite-silixite crust
1.40
0.46
>1391
6.85
0.00
Carbonate rock
19.70
30.09
Quaternary sediments
5.63
5.56
<8.3
21.50
34.72
8.3–19.9
20.25
21.76
19.9–29.3
28.17
25.46
29.3–40.3
21.66
15.28
>40.3
8.41
2.78
<0.5
37.80
28.70
0.5–1.3
21.46
16.67
1.3–2.1
19.34
25.00
Slope
Drainage density
2.1–3.0
14.20
23.15
>3.0
7.21
6.48
References
Fault density
0.175
18.20
6.02
0.175–0.300
27.32
14.35
0.300–0.420
23.61
29.17
0.420–0.570
19.06
27.78
>0.570
11.80
22.69
Agriculture and other lands
14.14
15.74
Rocky mountain
2.97
1.39
Barren land
32.92
54.17
Medium forest
6.10
0.00
Land cover
Bamboo forest
5.48
0.93
Productive young forest
10.59
11.57
Mixed-type forest
4.71
3.24
Plantation forest
4.53
9.26
Poor forest
18.17
3.70
Rich forest
0.30
0.00
Non-productive young forest
0.09
0.00
Bedrock and slightly weathered
rock or weathered layer <1 m
3.13
0.46
Bedrock and slightly weathered
rock or weathered layer <2 m
14.40
8.33
Weathering crust
Landslides
Acknowledgments
This work is part of the research project “Building up an integrated
system for assessing natural disasters in mountainous areas of
Vietnam - A case study in upstream catchment of Lo River,”
project code: 105.11.50.09, funded by the National Foundation for
Science and Technology Development (NAFOSTED), Vietnam
Ministry of Science and Technology (MOST). The authors thank
the two anonymous reviewers for their constructive reviews that
helped to bring the manuscript to its present form.
Akgun A, Dag S, Bulut F (2008) Landslide susceptibility mapping for a landslideprone area (Findikli, NE of Turkey) by likelihood-frequency ratio and weighted
linear combination models. Environ Geol 54:1127–1143. doi:10.1007/s00254007-0882-8
Ayalew L, Yamagishi H, Ugawa N (2004) Landslide susceptibility mapping using GISbased weighted linear combination, the case in Tsugawa area of Agano River. Niigata
Prefecture, Japan. Landslides 1:73–81. doi:10.1007/s10346-003-0006-9
Banuelas R, Antony J (2004) Modified analytic hierarchy process to incorporate uncertainty and managerial aspects. Int J Prod Res 42:3851–3872. doi:10.1080/
00207540410001699183
Brabb EE (1984) Innovative approaches to landslide hazard and risk mapping. In: Seychuk
OJ (ed) Proceedings of the 4th International Symposium on Landslides, vol 1,
Canadian Geotechnical Society, Toronto, vol., pp 307–324
Bui D, Lofman O, Revhaug I, Dick O (2011) Landslide susceptibility analysis in the Hoa
Binh province of Vietnam using statistical index and logistic regression. Nat Hazards
59:1413–1444. doi:10.1007/s11069-011-9844-2
Bui DT, Pradhan B, Lofman O, Revhaug I, Dick OB (2012a) Landslide susceptibility
assessment in the Hoa Binh province of Vietnam. A comparison of the LevenbergMarquardt and Bayesian regularized neural networks. Geomorphology 171:12–29.
doi:10.1016/j.geomorph.2012.04.023
Bui DT, Pradhan B, Lofman O, Revhaug I, Dick OB (2012b) Landslide susceptibility
mapping at Hoa Binh province (Vietnam) using an adaptive neuro-fuzzy inference
system and GIS. Comput Geosci 45:199–211. doi:10.1016/j.cageo.2011.10.031
Chalkias C, Ferentinou M, Polykretis C (2014) GIS-based landslide susceptibility mapping
on the Peloponnese peninsula. Greece Geosciences 4:176–190. doi:10.3390/
geosciences4030176
Dodd FJ, Donegan HA (1995) Comparison of prioritization techniques using
interhierarchy mappings. J Oper Res Soc 46:492–498. doi:10.2307/2584596
Duc DM (2013) Rainfall-triggered large landslides on 15 December 2005 in Van Canh
District. Binh Dinh Province, Vietnam Landslides 10:219–230. doi:10.1007/s10346012-0362-4
Feizizadeh B, Blaschke T (2013) GIS-multicriteria decision analysis for landslide susceptibility mapping: comparing three methods for the Urmia lake basin. Iran Natural
Hazards 65:2105–2128. doi:10.1007/s11069-012-0463-3
Feizizadeh B, Blaschke T, Nazmfar H, Rezaei Moghaddam MH (2013) Landslide susceptibility mapping for the Urmia Lake basin. Iran: A multi-Criteria Evaluation Approach
using GIS Int J Environ Res 7:319–336
Fell R, Corominas J, Bonnard C, Cascini L, Leroi E, Savage WZ (2008) Guidelines for
landslide susceptibility, hazard and risk zoning for land use planning. Eng Geol
102:85–98. doi:10.1016/j.enggeo.2008.03.022
Gorsevski PV, Gessler PE, Boll J, Elliot WJ, Foltz RB (2006a) Spatially and temporally
distributed modeling of landslide susceptibility. Geomorphology 80:178–198
Gorsevski PV, Jankowski P, Gessler PE (2006b) An heuristic approach for mapping
landslide hazard by integrating fuzzy logic with analytic hierarchy process. Control
Cybern 35(2006):121–146
Guzzetti F, Mondini AC, Cardinali M, Fiorucci F, Santangelo M, Chang KT (2012) Landslide
inventory maps: new tools for an old problem. Earth Sci Rev 112:42–66. doi:10.1016/
j.earscirev.2012.02.001
Hung LQ, Batelaan O, San DN, Van TT (2005) GIS—remote sensing application of
landslide hazard mapping—case study Thua-Thien-Hue Province, Vietnam. New
Strategies for European Remote Sensing
Intarawichian N, Dasananda S (2010) Analytical hierarchy process for landslide susceptibility mapping in lower Mae Chaem watershed. Northern Thailand Suranaree J Sci
Technol 17:277–292
Jiří Franek and Aleš Kresta (2014) Judgment scales and consistency measure in AHP
Enterprise and the Competitive Environment 2014 conference, ECE 2014, 6–7
March 2014, Brno, Czech Republic Volume 12, 2014:164 - 173
Khien NX, Hung LQ, Long NT (2012) Assessment of status geohazards in four mountainous provinces in North of Viet Nam: Ha Giang, Bac Kan, Cao Bang, Tuyen Quang.
Identification of sources, prediction and propose preventive measures and consequences mitigation. Vietnam Institute of Geosciences and Mineral Resources,
Ladas I, Fountoulis I, I. M (2007) Using GIS & multicriteria decision analysis in landslide
susceptibility mapping—a case study in Messinia Prefecture area (SW Peloponnesus,
Greece) Bulletin of Geological Society of Greece XXXX:1973–1985
Long NT, De Smedt F (2008) Landslide susceptibility mapping of the mountainous area
in A Luoi district, Thua Thien Hue province, Vietnam. Vrije University of Brussel,
Dissertation
Long NT, De Smedt F (2012) Application of an analytical hierarchical process approach
for landslide susceptibility mapping in A Luoi district. Thua Thien Hue Province,
Vietnam Environ Earth Sci 66:1739–1752. doi:10.1007/s12665-011-1397-x
Malczewski J (1999) GIS and multicriteria decision analysis. John Wiley and Sons, New
York
Malczewski J (2000) On the use of weighted linear combination method in GIS: common
and best practice approaches. Trans GIS 4:5–22
Nielsen TH, Wrigth RH, Vlasic TC, Spangle WE (1979) Relative slope stability and land-use
planning in the San Francisco Bay region. California, US Geological Survey Professional
Rajput V, Shukla AC (2014) Decision-making using the analytic hierarchy process (AHP).
Int J Sci Res 3:135–136
Saaty TL (1977) A scaling method for priorities in hierarchical structures. J Math Psychol
15:234–281. doi:10.1016/0022-2496(77)90033-5
Saaty TL (1980) The analytic hierarchy process: planning, priority setting, resource
allocation. McGraw-Hill, New York
Saaty TL (2000) Fundamentals of decision making and priority theory with the analytic
hierarchy process. RWS Publications, Pittsburg, USA
Saaty TL (2008) Decision making with the analytic hierarchy process. Int J Services
Sciences 1:83–98
Saro L, Dan NT (2005) Probabilistic landslide susceptibility mapping in the Lai Chau
province of Vietnam: focus on the relationship between tectonic fractures and
landslides. Environ Geol 48:778–787. doi:10.1007/s00254-005-0019-x
Soeters R, van Westen CJ (1996) Slope instability recognition, analysis, and zonation. In:
Turner AK, Schuster RL (eds) Landslides, investigation and mitigation, vol 247,
Transportation Research Board, National Research Council, Special Report. National
Academy Press, Washington, D.C., pp 129–177
Tazik E, Jahantab Z, Bakhtiari M, Rezaei A, Alavipanah SK (2014) Landslide susceptibility
mapping by combining the three methods fuzzy logic, frequency ratio and analytical
hierarchy process in Dozain basin. The 1st ISPRS International Conference on
Geospatial Information Research, 15-17 November 2014, Tehran, Iran XL-2/W3:267272 doi:10.5194/isprsarchives-XL-2-W3-267-2014
van Westen CJ, van Asch TWJ, Soeters R (2006) Landslide hazard and risk zonation: why
is it still so difficult? Bulletin of engineering geology and the environment : the official
journal of the International Association for Engineering Geology and the Environment:
IAEG 65
Varnes DJ (1984) Landslide hazard zonation: a review of principles and practice. Natural
hazards, 3. Unesco, Paris
Voogd H (1983) Multicriteria evaluation for urban and regional planning, 1st edn. Pion
Ltd., Princeton University, London
Wagner A, Leite E, Olivier R (1988) Rock and debris slides risk mapping in Nepal—a user
friendly PC system for risk mapping. In: Proceedings of the 5th International
Symposium on Landslides, 10–15 July, Lausanne, Switzerland (A.A. Balkema, Rotterdam, The Netherlands), vol 2. pp 1251–1258
Wu C-H, Chen S-C (2009) Determining landslide susceptibility in Central Taiwan from
rainfall and six site factors using the analytical hierarchy process method. Geomorphology 112:190–204. doi:10.1016/j.geomorph.2009.06.002
Yalcin A (2008) GIS-based landslide susceptibility mapping using analytical hierarchy
process and bivariate statistics in Ardesen (Turkey): comparisons of results and
confirmations. CATENA 72:1–12. doi:10.1016/j.catena.2007.01.003
Yoshimatsu H, Abe S (2006) A review of landslide hazards in Japan and assessment of
their susceptibility using an analytical hierarchic process (AHP) method. Landslides
3:149–158. doi:10.1007/s10346-005-0031-y
L. Q. Hung : N. T. H. Van : P. Son : N. H. Khanh : L. T. Binh
Vietnam Institute of Geosciences and Mineral Resources,
Chien Thanh Street, Thanh Xuan, Hanoi, Vietnam
D. M. Duc ())
VNU University of Science,
Vietnam National University, Hanoi,
334 Nguyen Trai, Thanh Xuan, Hanoi, Vietnam
e-mail:
L. T. C. Ha
Central Vietnam Institute for Water Resources,
132 Dong Da Hai Chau, Da Nang, Vietnam
Landslides