DSpace at VNU: Flood vulnerability among rural households in the Red River Delta of Vietnam: implications for future climate change risk and adaptation
Bạn đang xem bản rút gọn của tài liệu. Xem và tải ngay bản đầy đủ của tài liệu tại đây (1.32 MB, 28 trang )
Nat Hazards
DOI 10.1007/s11069-016-2701-6
ORIGINAL PAPER
Flood vulnerability among rural households in the Red
River Delta of Vietnam: implications for future climate
change risk and adaptation
Pamela McElwee1
Huong Vu2
•
Tuyen Nghiem2 • Hue Le2
•
Received: 5 May 2016 / Accepted: 26 November 2016
Ó Springer Science+Business Media Dordrecht 2016
Abstract The Red River Delta (RRD) of Vietnam, one of the world’s most densely
populated deltas, is already vulnerable to flooding events, and climate change forecasts
project increased exposure to flood risk in coming decades due to changes in rainfall, storm
intensity and frequency, and sea-level rise. However, there is a relative neglect of this
region in the literature on natural hazards and climate change, particularly on how floods in
the RRD might affect poor people and different livelihood sectors, how flood risk is
understood and acted on, and how flood impacts experienced by households influence local
adaptation choices. This article presents research undertaken in 2009–2010 to understand
the impacts of flooding in a typical rural zone (Thai Binh Province) of the RRD to assess
overall vulnerability, particularly the relationship between poverty, livelihoods, and flood
impacts, as well as to assess the range of adaptation and flood risk reduction options
currently used. Our findings indicate that while poor households do not appear to be more
exposed to floods than others, their incomes are more sensitive to relative impacts from
floods. Yet poverty alone did not explain flood vulnerability, as age of household and
livelihood sector involvement showed stronger relationships to flood impacts. Flood risk
perceptions were also uneven, but poor people did not seem to take less proactive flood risk
reduction measures than others. There are few long-term adaptation actions to flooding
being taken by households of any income class, and there is a need for better community
and government aid after flood events to help households cope with increased flood risks in
the RRD, rather than relying on improvements in hard infrastructure, as is currently the
dominant approach in the region, particularly given future forecasts of increased rainfall
for northern Vietnam under climate change.
& Pamela McElwee
1
Department of Human Ecology, Rutgers, The State University of New Jersey, 55 Dudley Road,
New Brunswick, NJ 08901, USA
2
Center for Natural Resources and Environmental Studies (CRES), Vietnam National University, 19
Le Thanh Tong, Hanoi, Vietnam
123
Nat Hazards
Keywords Flooding Á Vietnam Á Vulnerability Á Poverty Á Climate-dependent livelihoods Á
Adaptation
1 Introduction
Climate change is likely to bring a multitude of new regional weather changes, many of
them water-related, and Asia is particularly vulnerable to these trends. Asia already
accounts for the largest number of flood events in recent decades (Douben 2006), and
forecasts indicate that parts of the region are likely to see flood events rise in frequency and
scale (Chang 2010; Hirabayashi et al. 2013). Forecasted exposure to floods globally
indicates that the countries of Southeast Asia face particularly strong increases in risk in
the future due to a combination of development decisions that put people in the path of
floods, along with projected future climate change impacts (Neumann et al. 2015a; Winsemius et al. 2015). Thus, there is an urgent need to assess current vulnerability and
adaptation to flood hazards in this part of the world, and to identify ways in which future
risks can be better anticipated and managed through vulnerability reduction efforts
(Jongman et al. 2012).
This is particularly true for countries like Vietnam, where there are dense populations
living in low-lying areas, and who are currently subject to regular flood events even in the
absence of climate change. Vietnam was ranked fourth in a 2009 global ranking of total
populations exposed to floods (UNISDR 2009), given a long coastline and high numbers of
people living in these exposed areas, with over 80 major flood events recorded between
1985 and 2010 in the Dartmouth Flood Observatory database (tmouth.
edu/%7Efloods/Archives/index.html). Floods have been the second most hazardous climate event in Vietnam after hurricanes, with over 5000 killed and 25 million affected in
the past half century (IMHEN and UNDP 2015). Regionally downscaled climate change
scenarios for Vietnam indicate that floods are likely to worsen in the future, due to changes
in amount and seasonality of rainfall, along with sea-level rise of up to 1 m in low-lying
deltas (MONRE 2009; Bangalore et al. 2016). Indeed, higher precipitation events leading
to increased flooding already appear noticeable in climatic patterns in some regions of
Vietnam (Souvignet et al. 2013). These risks are compounded by poor development
decision making in sectors such as forestry, hydroelectric development, and infrastructure
that can increase flood risks (Beckman 2011). Therefore, more needs to be known about
how existing floods impact households, the different types of social vulnerability to floods,
and how households are coping with or adapting to floods.
There is a particular need to understand whether poor households or households with
specific types of livelihoods are more vulnerable to flooding in Vietnam. A recent global
report on poverty and climate impacts has noted that poor people are often more impacted
by floods, as their incomes are more dependent on weather, their housing and assets are
less protected, and they are more prone to health problems (Hallegatte et al. 2015). Other
studies confirm that poor people tend to be more exposed to floods as they often settle in
poorer quality and cheaper lands in floodplains; they tend to be sensitive to losses in that
they lose relatively more when hit by floods than wealthier households; and they have a
lower capacity to cope with and adapt to flood impacts due to lower access to savings,
borrowing, or social protection (Cutter et al. 2000; Brouwer et al. 2007; Braun and
Aßheuer 2011). Climate-sensitive livelihoods can be another factor in flood vulnerability;
123
Nat Hazards
activities like farming and fishing can be particularly damaged by floodwaters (Thomas
and Twyman 2005; Paavola 2008; Gentle and Maraseni 2012). These two types of social
vulnerability have linkages, as globally, more poor households tend to be dependent on
agriculture for their livelihoods than wealthier ones (Davies et al. 2009).
Yet there have been relatively few studies in Vietnam specifically on how floods differentially affect poor people and different livelihood sectors, such as in terms of exposure
and sensitivity, and how flood impacts experienced by households influence local adaptation choices (Birkmann et al. 2012; World Bank and AusAID 2013). This is particularly
true for the Red River Delta (RRD) that dominates northern Vietnam, as this region,
despite being densely populated and impacted by major floods in recent years, has been
mostly neglected in the academic literature. Much more attention has been paid to the
Mekong (Nguyen 2007; Few and Tran 2010; Dun 2011; Birkmann et al. 2012; Few et al.
2013) and Perfume River basins (Tran et al. 2008; Tran et al. 2009; Tran and Shaw 2010),
and urban flooding and climate change impacts in major cities like Ho Chi Minh City,
Hanoi, Can Tho, Hue, and Danang (Hung et al. 2007; Hung et al. 2010; Birkmann et al.
2010; Bich et al. 2011; Tu and Nitivattananon 2011; Razafindrabe et al. 2012). Much less
is known about vulnerability and adaptation to floods in rural areas of the RRD, as only a
few studies are available (Tinh 2011; Dang et al. 2011). This lack of attention is serious,
due to the fact that in terms of total numbers of population forecasted to experience flood
hazards in Vietnam as a result of future climate change, the RRD is predicted to be the
most affected region of the entire country (Bangalore et al. 2016).
Given this dearth of information and the importance of the RRD, this article presents
research undertaken in 2009–2010 to understand the impacts of flooding in a typical rural
area there. Our aim was to assess exposure to floods; overall vulnerability, particularly the
relationship between poverty, livelihoods, and flood impacts; and to assess the range of
adaptation and flood risk reduction options currently used in the RRD, given the fact that
floods are predicted to increase in both intensity and frequency in the future. Our findings
indicate that while poor households do not appear to be more exposed to floods than others,
their incomes are more sensitive to relative impacts from floods. Yet poverty alone did not
explain flood vulnerability, as age of household and livelihood sector involvement also
were correlated with flood impacts, which we explain in terms of settlement histories and
investment strategies of households. Flood risk perceptions were also uneven, but poor
people did not seem to take less proactive flood risk reduction measures than others, which
is a potentially positive sign for future planning. Finally, qualitative work with households
impacted by floods revealed strong needs for community and government aid after flood
events, particularly as private insurance is nonexistent in this area, and previous disaster
aid has been mostly ineffective in helping households adapt to longer-term flood hazards
that are projected for this region.
2 Background: flood risk and vulnerability in Vietnam
2.1 Flood regimes in Vietnam
The northern, central, and southern regions of Vietnam have traditionally had divergent
ways of coping with flood hazards, and the lack of information about and attention to flood
risk and vulnerability in the RRD, while other areas of Vietnam have seen much more
research, is likely due to the misperception that the RRD has sufficient infrastructure in the
123
Nat Hazards
form of dams and dikes to prevent large-scale flooding. In the Mekong Delta, slow-onset
yearly floods have prompted an adaptation regime of ‘‘living with the floods’’ (Huu 2012;
Ehlert 2013), while in central Vietnam short slopes and high risk of flash floods have
focused efforts on preparedness and disaster risk reduction projects (Beckman 2006; Tran
et al. 2008; Tong et al. 2012). In the north of Vietnam in the RRD, floods usually occur
primarily after storms or extreme rainfall events, and the focus has been on infrastructure
for flood prevention, including investments in reservoirs, river and sea dikes, and dredging
(Pilarczyk and Nuoi 2005). However, recent flood events in the RRD have pointed out the
deficiencies in this approach, as existing infrastructure has proved inadequate for extreme
rainfall-induced floods, and household losses have been substantial (IFRC 2008; UN 2015).
The future holds more flood risk for Vietnam under climate change, particularly the
RRD, as forecasts indicate changes in flood hazard patterns in terms of timing, intensity,
and duration can be expected (Ngo-Duc et al. 2014; Giang et al. 2014). Monsoonal rains
have been tending to come earlier in the season than in previous decades, and increases in
flood peaks have been documented for all regions of Vietnam (with the exception of the
Red River, due to storage reservoirs built in the upstream) since 1961 (IMHEN and UNDP
2015). The overall predictions for the end of the twenty-first century under medium
greenhouse gas emissions scenarios are that the dry seasons will get drier, and in the rainy
season, larger volumes will fall in shorter periods, exacerbating floods in places that
already experience them. In the RRD, rainfall is expected to increase at a higher rate than
any other part of the country (MONRE 2009) (see Table 1). These hazards are combined
with existing high densities of population in the RRD who are likely to be exposed and
potentially vulnerable to these future flood hazards (Bangalore et al. 2016)
2.2 Vulnerability to floods in Vietnam
Floods are the most frequently experienced climate risk in Vietnam, according to the
national Vietnam Household Living Standards Survey (VHLSS), which covers all provinces and regions and assesses household well-being approximately every 2 years.
According to VHLSS data, floods cause the most income damage of all climate events at
the household level in Vietnam (Arouri et al. 2015). Overall, 10% of all communes (the
lowest level of state government) in Vietnam were affected by at least one flood in 2010
Table 1 Changes in annual rainfall (%) relative to period of 1980–1999 projected for Vietnam’s regions
under a medium emission scenario (B2). Source MONRE (2009)
Climatic region
Decades in the twenty-first century
2020
2030
2040
2050
2060
2070
2080
2090
2100
Northwest
1.4
2.1
3.0
3.8
4.6
5.4
6.1
6.7
7.4
Northeast
1.4
2.1
3.0
3.8
4.7
5.4
6.1
6.8
7.3
Red River Delta
1.6
2.3
3.2
4.1
5.0
5.9
6.6
7.3
7.9
North central coast
1.5
2.2
3.1
4.0
4.9
5.7
6.4
7.1
7.7
South central coast
0.7
1.0
1.3
1.7
2.1
2.4
2.7
3.0
3.2
Central highlands
0.3
0.4
0.5
0.7
0.9
1.0
1.2
1.3
1.4
Southeast and Mekong Delta
0.3
0.4
0.6
0.8
1.0
1.1
1.2
1.4
1.5
Bold indicates Red River Delta
123
Nat Hazards
(Kozel 2014). Several studies have pointed out, based on the VHLSS data or case studies
of particular floods, that floods have negative impacts on household welfare in Vietnam, as
well as leading to death and injury (Thomas et al. 2010; Bich et al. 2011; Navrud et al.
2012), and the poorest households in Vietnam seem to be disproportionately impacted
(Birkmann et al. 2012; Rubin 2014).
The channels by which poor households in Vietnam experience floods are related to
both exposure and sensitivity. Poor households often settle in flood plains or in low-quality
housing, increasing their exposure to flooding. For example, a study in the Mekong Delta
found 38% of the region’s poor but only 29% of the region’s non-poor lived in frequently
flooded areas (Nguyen Van Kien 2011). Another study in Hue city in the central region of
Vietnam found that poor households experienced flooding at rates more than 40 cm higher
in their houses than richer homes built with higher elevations (Tran et al. 2008). This
increased exposure of the poor leads to increased mortality from floods; deaths from
disasters (including floods and storms) correlate strongly with poverty rates in Vietnam’s
provinces, according to one study (Rubin 2014). Evidence from the Mekong Delta and Ho
Chi Minh City’s urban wards indicates that exposure to floods has led to higher health risks
among the poor, including both waterborne and respiratory diseases (Few and Tran 2010;
World Bank and AusAID 2013). Exposure also relates to the ability to prepare in advance
for flooding; a study in Hoi An city in the central region noted that poorer households
found it more difficult to protect household assets from floods, as they did not have second
floor storage areas in their houses, or could not afford to pay workers to move goods to
safety in time (McElwee et al. 2010).
Sensitivity and vulnerability are often used interchangeably, and refer to the fact that
loss and damage may relate more to the socioeconomic or cultural situation of a household
rather than their physical exposure, including indicators like poverty status or the types of
livelihood activities they pursue, such as agriculture and other high-risk and climatedependent activities. Previous research from Vietnam confirms the links between poverty,
climate-sensitive livelihoods, and vulnerability. One study in the central region of Vietnam
noted that more poor households reported a ‘‘high impact’’ from flood hazards than the
middle class or rich (Casse et al. 2015), while another study in the same region found that
flood damage made up a larger portion of annual household income for the poor (26% of
income) versus only 14% of the non-poor (Navrud et al. 2012). A study from the Mekong
Delta found that poor households were more likely to experience submerged homes, job
losses, reduced income from fishing, and temporary evacuation during floods than those
who were better off (Nguyen and James 2013). Sensitivity also relates to information
access, as poor households may receive less early warning information in order to prepare
for flood risks if they cannot afford TVs or mobile phones (Bruun and Casse 2013).
Further, while floods are often indiscriminate, and can hit both poor and wealthy in the
same area, it is often the poor who have fewer reserves to aid in recovery or in longer-term
adaptation (Arouri et al. 2015; Casse et al. 2015). Floods can therefore be one factor in
pushing near-poor people into poverty if there is not sufficient safety-net and livelihood
support to aid in coping responses (Beckman 2006; Miller 2006). Local institutions,
informal safety nets, and local social capital are enormously important in responding to
disasters and climate events, and poor households may have trouble accessing these forms
of assistance, as well as access to more formal government disaster support, whose coverage in Vietnam can be spotty (Casse 2013; Chau et al. 2014b).
Yet all too often, reports from Vietnam do not focus on these social factors of vulnerability and risk. Much literature on flooding focused on Vietnam uses methods that
conflate vulnerability simply with physical exposure (Hien et al. 2005), or uses overly
123
Nat Hazards
general indexes which have very few indicators related to social vulnerability, particularly
at household levels (Dinh et al. 2012; Ho et al. 2013; Chau et al. 2013, 2014a). Thus, there
is a need for a closer look at social vulnerability to flooding in Vietnam, particularly in the
RRD.
3 Study area and methods
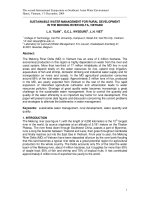
The Red River dominates northern Vietnam, with a total catchment area of 86,660 km2,
fed by tributaries including the Thao, Lo, and Da Rivers. The lower delta consists of six
different mouths (the Thai Binh, Ninh Co, Tra Ly, Ba Lat, Van Uc, and Day Rivers) that
fan out from the main Red River and empty into the Gulf of Tonkin in the East China Sea
over 200 km of coastline (see Fig. 1). The lower RRD lies south and east of the capital of
Hanoi, covering an area of nearly 1.3 million hectares over nine provinces (4% of the total
area of Vietnam), and is characterized by mostly agriculture and aquaculture production.
58% of the delta is less than 2 m below sea level (Tinh 2011). The RRD is the most
densely populated area of the country, with a total population of over 17 million people,
and a population density that can reach 1225 persons per km2 (Devienne 2006). Much of
this population is engaged in climate-sensitive livelihoods, particularly farming and fishing
(Adger 1999).
The RRD has a strong monsoonal climate; around 80% of the total annual rainfall
occurs during the 6-month season from approximately late May to early November, with
an average rainfall of 1900 mm/yr (Tinh 2011). Typhoons from the South China Sea which
bring sudden and torrential rains and high winds to coastal areas are also a factor in the fall
months, and on average, the RRD is hit by six typhoons a season (Kelly 2001). Changes in
the frequency and severity of flood events have been documented for the RRD, with a rise
in the average number of days of flooding per event in the past half century (Khanh and Le
2001). Further, while July and August were traditionally the flood months in the monsoon,
flood events are now falling throughout early summer to winter. Storm surges and sea-level
rise are also predicted to increase due to climate change, with severe consequences for
flood risk, especially for the coastal populations (Neumann et al. 2015b).
The RRD is protected by two dike systems: river dikes of 3000 km length that control
floods from the Red River and its tributaries; and a sea dike of 1500 km in length. Some of
these dikes were first built more than a thousand years ago and upgraded during the French
colonial period (Smith 2002). A survey in 12 northern provinces found 14% of local dikes
to be in bad condition, 73% in average condition and only 13% in good condition (Tinh
2011). This can be attributed to the fact that collective contributions to the maintenance of
local dikes, channels, and canals have been in decline in the post-socialist era (Adger
1999). Although irrigation and drainage in many polders of the RRD were upgraded in the
1990s with international development aid, floods still cause damage, especially when
pumping stations cannot keep up with excess water (Ritzema et al. 2008). Other problems
include poor land-use planning, as currently much land which is designed for agricultural
production has been converted into industrial or urban uses, without flood prevention
measures. Unlike many other flood-prone areas of the world (Brown and Damery 2002),
there are no systematic hazard maps for the RRD to guide zoning and planning. Thus, there
are reasons to think flood vulnerability in the RRD might differ from other areas of
Vietnam, due to the lack of hazard maps, unregulated development, and overreliance on
infrastructural and technical means of flood risk reduction, such as dikes.
123
Nat Hazards
Fig. 1 Map of Red River Delta system and site of field research. Source Base map from (Tuan and Shannon
2010)
Therefore, to determine the impact of flooding on rural areas of the RRD, we undertook
research in 2008–2009 in one typical area (Thai Binh Province) that had experienced
flooding in the last 10 years. Thai Binh is a mostly rural province approximately 70 km
southeast of Hanoi, and has been the leading province of the RRD in rice productivity,
which can reach 8–10 tons/year in some areas. Aquaculture in fresh and saltwater areas has
developed in recent years, but agriculture remains the dominant income source. Both the
Tra Ly and Red Rivers run through Thai Binh Province, and much of the province lies
below river level and thus relies heavily on river dikes and pumping for drainage. We
123
Nat Hazards
selected Kien Xuong district for field research as it had experienced a major flood caused
by excess monsoon rains in recent memory (September 2003) at the time of the research,
and because Kien Xuong is predicted to be one of the top 20 districts in the whole country
in terms of population exposed to flooding under future climate change scenarios (Bangalore et al. 2016). The total number of people who would be exposed in Kien Xuong
under 200-year flood risks would be over 200,000 people, or close to 90% of the entire
current population of the district (around 235,000 people).
We conducted interviews with 151 households in four villages of Kien Xuong in
summer of 2009 after pretesting of questionnaires in fall 2008. We choose two flood
affected communes (Tra Giang and Quoc Tuan) and chose two villages in each site (Truc
Tam and Duc Duong villages in Tra Giang and Dac Chung Bac and Dac Chung Trung in
Quoc Tuan). We excluded non-flood-affected households out of the village census roles, in
consultation with key village informants, as we were interested in flood impacts and social
vulnerability of those affected. We selected households to be interviewed based on the
proportion of population size of the village by randomly selected every kth household
remaining on the village census lists for interviews with a standardized survey, which was
conducted with either the head of household or the spouse. The authors guided the survey
data collection, along with five university students working as surveyors, with all interviews conducted in Vietnamese. Our overall questions related to channels of vulnerability
by which households were effected by floods—did these risks relate to location within the
village, type and amount of assets, characteristics of livelihoods, or other social factors,
which we tested by collecting detailed income measures for before and after flood events
within surveyed households.
We also conducted focus group discussions with over 50 participants. Topics discussed
in focus groups included histories of climate events in the local area and different adaptation measures to floods undertaken by the community and their efficacy. Provincial,
district, and commune government officials (27 total) in different sectors dealing with
climate and water management issues were also interviewed. These tools were all aimed at
outlining the differential types of vulnerabilities and responses to flood events that existed
in this representative site of the RRD.
4 Results
4.1 Household demographic data
Households in Kien Xuong district that were interviewed tended to reflect demographic
trends in the RRD region: namely, an aging population continuing to reside in the countryside, while children often migrated to Hanoi or other areas for work. The average age of
the household survey respondent was 55, and households tended to be fairly small (3.55
members), with less than one child under 16 still residing in the home per household. All
respondents were literate, with an average educational level of 9 years of schooling
(equivalent to lower secondary school training). The residents were primarily farmers, with
100% of households reporting at least some farm income from the year before the survey
was administered. The large majority of households owned their own rice lands, while a
smaller percentage also owned or had access to fishponds as a source of income (see
Table 2). Small livestock was also an important source of income (from pigs and chickens,
primarily, although a few wealthier households had buffalo or cattle).
123
Nat Hazards
Table 2 Basic demographic characteristics of the respondents. Source Household survey, 2009
Characteristics
Percentage male respondents
SD
68%
Average age
55
Percentage HH with a male head
89%
Years of schooling of HH head
9
Average number HH members
3.55
1.44
Average number of children still living at home per HH
.5
.73
Average per capita income
19,883,364 VND
(1132 USD)
20,011,435 VND
(1140 US)
Percentage HH with farm income at the time of survey
100%
Percentage HH owning some irrigated rice land
99%
11.91
2.04
Average landholding of irrigated rice land
0.21 ha
.13 ha
Average landholding size (residential, agriculture and other,
e.g., forest or aquaculture)
0.33 ha
.21 ha
Percentage HH with livestock income
88%
Percentage HH owning or renting a fish pond
26%
Percentage HH owning own house
100%
Percentage homes made of concrete or brick
72%
Percentage homes with only one story
95%
Percentage HH with electricity
99%
Percentage HH with domestic tubewell water
98%
Percentage HH owning at least one motorbike
72%
Percentage HH owning at least one boat
30%
Housing stock varied somewhat in the researched area; 72% were concrete or brick,
while the rest were a mix of brick and wood (considered less permanent and stable). Only
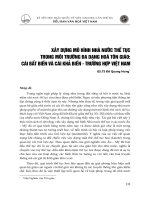
5% of households had homes of more than one story, either two story or one story with roof
mezzanine, known as gac lung, which could be used to store assets during floods, while
other households had to make do with less stable ‘‘attics’’ of bamboo floors in the rafters of
one-story homes (see Fig. 2). All households owned their own homes and most had
electricity and tubewell water. Other common household assets included motorbikes and
boats, both of which can be useful in transporting people, livestock, and household goods
to safety during floods.
4.2 Experience of flood events
Kien Xuong district had experienced several severe flood events in living memory (see
Table 3). Focus group discussions revealed key differences in the types of floods, most of
which were caused by excess rainfall or storms or were ‘‘out of season’’ from the traditional flood months of the early fall, as well as the historical severity of floods experienced,
such as in fatalities and damage. Community discussions confirmed that most households
perceived a 2003 flood to have been the most serious in recent memory, so we used this
event as our key research topic. The 2003 flood was experienced as a series of heavy rains
from the 10th to the 14th of September, leading local rivers (the Thai Binh and Tra Ly) to
123
Nat Hazards
Fig. 2 House types in Kien Xuong (two story with mezzanine, right; one story with mezzanine, center; and
one story with no mezzanine and traditional tile roof, far left). The two houses on the right also have raised
foundations, while the traditional one on the left does not
Table 3 Past flood events in Thai Binh in past decades. Source Key informant interviews in the field, 2009
Year
Impacts in Kien Xuong, Thai Binh
1968
The back dike was broken causing a severe flood, and then the sea dike was broken. Much flooding
and waterlogged land for a long time. At least seven people died
1971
Severe storm and broken sea dike, leading to extensive evacuation and damage, and multiple deaths
1976
Flood caused multiple deaths
1978
Heavy rains caused severe flood
1980
Heavy rain. Lost two-thirds of rice crop to flood
1986
Heavy rain. Severe flood, some house damage
2003
Heavy September rains leading Tra Ly river to overflow; back dike and small dike for production
broken, causing 9 days of waterlogging. All rice fields were flooded and destroyed, some houses as
well
2008
Sudden severe rain in September (Tropical Storm Hagupit) led to loss of some crops
overtop river dikes, and the dikes were broken in several places. The local dike was said to
be weaker than in the past due to a number of migrant families who had moved into land
right next to the dike, building houses too close to the structure. Pumping stations were
unable to keep up with the floodwaters, and the drainage system canals functioned very
poorly, preventing water from draining out of fields back to the river. Fifteen people were
123
Nat Hazards
reported dead in the province from the 2003 flood, and 31,000 km2 of land were affected;
the total area of rice cultivation affected in the province by inundation was 60,000 ha. The
damage caused to aquatic production was also large, and $38 million in property losses
were reported from the province.
Households in focus groups described the 2003 flood as ‘‘very sudden,’’ occurring after
heavy rains described as ‘‘mua den’’ (black rain), and that advanced warning of a day or so
allowed households to have some time to prepare. Around 70% the households in Kien
Xuong reported listening to TV carefully prior to flood events and during heavy rains,
while 49% reported using radios to listen for flood forecasts. 52% of households also
reported getting direct information about floods from either a village leader or via a
relative/friend who had spoken to a village leader. In terms of rapid preparation, sandbags
were filled to pile along dikes and in front of houses, and bamboo stakes cut to help secure
trees, houses and other structures. Livestock were brought to pens or evacuated to higher
ground, and some animals simply ran away themselves and had to be caught by owners
after the floods had receded. Household goods were lifted to second stories or attics, or
moved to friends’ or relatives’ houses on higher ground.
When the flood hit, most households recalled floodwaters of at least knee-high in yards
during the worst of the flood, and some houses had waters up to the level of beds on the
first floor. In these cases, family members evacuated to relatives’ or neighbors’ houses.
75% of households surveyed reported that they perceived their houses were relatively safe
during flood events, and that they could stay at home safely to wait out flooding. Local
government officials interviewed disputed these risk perceptions somewhat, stating that in
the future, faced with a similar flood as in 2003, they would need to be more proactive
about evacuating people and not letting them stay in their own houses, in order to reduce
risks of health effects or injury. 58% households in the sample did report that they had
knowledge of safe places to evacuate to if they were needed (such as buildings of the
People’s committee or schools, which are often located on the higher land and which serve
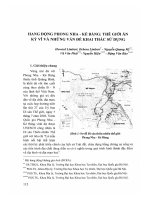
as shelters). In the case of evacuations, both boats and motorbikes could be used,
depending on the level of floodwaters (see Fig. 3).
4.3 Impact from flood event
The 2003 flood had significant impacts on households. Immediate impacts included
damage to homes and livelihoods, and access to transportation. 64% of surveyed households got some floodwater in their yards (the average depth of yard floodwaters was .4 m),
while 20% of the interviewed households got some water inside their house (but less than
1 m); only 1% of the interviewed households had more than 1 m of water in their house.
The duration of the water in yards and houses was from 5–10 days for most households.
There was no correlation in the sample between depth of floodwater and poverty status of
the household, indicating that poor families did not seem more physically exposed to floods
than others.
The household survey asked sampled households about their major income sources
before and after 2003 flood event, and 59% of interviewed households in Thai Binh agreed
that the event had caused ‘‘very serious’’ damage, while the rest of households said the
damage was average or minimal. Given an average household income of around $1337
USD before the flood, 8% of households estimated their total property and income damage
above 20 million VND (around $1130 USD), while 23% estimated from 10 to 20 million
($570–1130 USD). The rest reported damage under 10 million VND ($570 US). 52% of
households estimated needing from 1–6 months to recover from the floods, 23% needed
123
Nat Hazards
Fig. 3 Example of concrete boats available to use during floods in Kien Xuong
6–12 months, and 26% needed over a year, with some even reporting taking up to 3 years
to recover losses.
When asked to estimate the amount of damage from the flood to different income
sectors, households provided varying estimates (Table 4). 95% of the total interviewed
households reported a decrease in income from agriculture from the flood, explained by the
timing of the flood event, as the 2003 flood hit in early September when paddy rice was
still in the field, causing the near-complete destruction of the summer–autumn rice crop.
Vegetable crops (which were often planted outside of protective dikes and thus exposed to
floodwaters) were also heavily damaged. Livestock was a differentially affected sector,
with 52% of households reporting a loss of income after the flood from livestock, while the
Table 4 Households reporting income changes before and after flood event. Source Household survey,
2009
Source of income
Baseline income (in 2002)
in USD
% HH reporting change in income after 2003
flood
Decrease (%)
Same (%)
Increase (%)
Agriculture
322
96
4
0
Livestock
444
52
47
[1
Aquaculture/fishing
119
42
58
0
Salary and business income
452
18
80
2
Total
123
1337
Nat Hazards
rest reported little income decrease. Aquaculture was also affected for some households
(42%), reflecting the fact that while only around one-quarter of households had a fish pond,
other families without fishponds usually had fishing income from river fishing, which
decreased after floods, as people were either too busy or wary of catching fish that might
have been in polluted floodwaters. Salary and wage income showed the least impact from
flooding, with 80% of households reporting that it was the same after the flood event, or
even increased (2% of households).
The average value of flood losses was estimated at US$447/HH in damages, or around
one-third the average income for households the previous year. Because insurance for
crops or livestock, as well as for houses, is virtually nonexistent in Vietnam (Hansson et al.
2008), these losses had to be borne entirely by households themselves. For the 42% of
households that had reported aquaculture damages, the income losses were almost total:
92% of the value of the previous years’ fish income was reported as losses or damaged by
the 2003 flood (Table 5). This was attributed to the fact that the floods often swept away
fish, losing not only the ability to sell the fish, but also wiping out the investment that had
been made in fish fry. Salary and business income was the least affected by the floods, with
only 1% damage reported.
4.4 Damage from flooding by income and age classes
To understand the differential impact of flood damage on income classes, we stratified our
surveyed households into three income terciles (lowest one-third, middle one-third, and
richest one-third). Damage to cropping, livestock, and aquaculture was significant across
income terciles (Kruskal–Wallis test), although impacts need to be weighed both in terms
of absolute (total) damages incurred and relative impacts (the damage as a percentage of
income). While poorer households had the most relative damage from floods, in that they
lost higher percentages of their total income, their overall absolute damage was lower
compared to richer households (Table 6). Richer households had higher amounts of
absolute damage from the flooding events, as they were more likely to have invested large
sums in risky ventures like new aquaculture ponds or large flocks of ducks that were badly
hit by the flooding (significant at 0.00). Yet for poorer households, even the lower amounts
of overall damage were significant as they took up a large percentage of total income, and
relative agricultural damage was highest for the poorest households (sig at .002). The
reported time needed for recovery from the flood event varied by household from only
1 week to over 3 years (15% of households). Interestingly, middle-class households
reported needing less time to recover than either poor or rich households did.
To judge impacts based on household’ own assessments of the impacts from floods,
rather than by income classes, we asked our respondents themselves to state whether they
Table 5 Value of flood losses across survey sample. Source Household survey, 2009
Value
Agriculture
Livestock
Aquaculture
Salary/
business
income
Total value of aggregate income reported for 2002
across all households surveyed (USD)
48,761
67,852
18,627
101,689
Reported losses in 2003 flood
-27,307
-17,642
-17,084
-1017
% Impact
-56%
-26%
-92%
-1%
123
Nat Hazards
Table 6 Relationship of economic class to flood vulnerability. Source Household survey, 2009
Variable
Poorest 1/3
(n = 51)
Middle 1/3
(n = 50)
Richest 1/3
(n = 50)
Sig.
Total land owned
.265 ha
.31 ha
.407 ha
.004**
Total income in 2007
5,341157
15,718,220
38,881,560
.000**
Depth of water in yard
.415
.437
.458
.676
Depth of water in house
.06
.117
.111
.517
Total property and HH asset damage
896,471
566,400
3,151,600
.488
Agricultural damage (absolute)
2,070,549
1,875,540
4,753,060
.033**
Relative agricultural damage (% of income from
this source lost by flood)
89%
46%
48%
.002**
Livestock damage
542,759
1,084,440
4,353,800
0.016**
Relative livestock damage (% of income from
this source lost by flood)
66%
22%
38%
.160
Business/trade damage
43,137
207,600
31,000
.316
Aquaculture/fishing damage
792,255
579,000
3,292,000
0.02**
Total cost of damages
4,383,798
4,694,280
15,811,460
.000**
Time to recover from floods
476 days
303 days
515 days
0.04**
** indicates significance of the results (p \ .05)
were ‘‘highly affected’’ by the flood of 2003, ‘‘moderately affected,’’ or ‘‘little to no affect’’
(Table 7). These self-assessments not surprisingly were highly correlated with total income
damage, as those noting they were ‘‘highly affected’’ had nearly three times the income and
property damage as the ‘‘moderately affected’’ group (sig at 0.00). We assessed how each
of these groups may have differed from each other using Kruskal–Wallis tests, which
showed that the age of the household head and the educational level were correlated with
higher self-reported impacts. Age showed a clear correlation, with less impacted households more likely to be older. This is likely due to the fact older households were more
long settled and more likely to have land inside dikes in protected areas and thus less
exposed to floodwaters, as opposed to younger families who were more likely to have
marginal lands they had settled more recently that were not protected within the dikes.
Educational levels however did not show a clear relationship to impact, and were likely
Table 7 Comparison of different levels of impacted households. Source Household survey, 2009
Variable
Highly affected HH
(n = 89)
Moderately affected
HH (n = 55)
Low affected HH
(n = 7)
Sig.
Age of HH head
53
57
65
0.011**
Educational level
8.79
9.4
7.14
0.035**
HH size
3.76
3.29
2.86
0.094
Total land owned
3592
2868
2502
0.076
Total average income in
non-flood year
22,751,775
16,519,272
9,845,714
0.133
Reported total damage
from floods
11,152,663
4,201,704
3,597,142
0.000**
** indicates significance of the results (p \ .05)
123
Nat Hazards
more related to age (with older households having less schooling than younger ones,
typical of older eras where schooling was less universal). Household size and land owning
size did not predict levels of damage.
To explore further what impact the age of the household had on the damages incurred,
we divided the sample into older households, middle-aged ones, and younger households
(Table 8). Older households tended to have both smaller landholdings (as many older
households had distributed some of their land to children who had separated into their own
households already) and lower incomes overall. While they had lower amounts of absolute
crop damage, their relative crop damage was higher (70% losses), a finding similar to those
households that were classified as poor. They had less absolute and relative damage in
aquaculture than middle-aged households, however. The total cost of damages was significantly lower for older households than for both middle-aged and younger households.
There were not statistically significant differences in time to recover across the ages of
households or in the levels of inundations experienced in yards or houses.
We also tested our sample for any differences between male-headed households (135)
and those with a female head (12) (the remaining households did not know exactly who
was officially the household head). There were no significances between the two groups in
any indicators related to prosperity (income or land ownership) or damages and impacts
from flooding. This is likely due to the fact that some households keep the female registered as the head of the household, while the male is absent doing migrant work in Hanoi or
other areas. In such cases, the male of the household would be able to return to the village
Table 8 Impacts on households in different age classes. Source Household survey, 2009
Variable
Older HH (65
and over)
(n = 43)
Middle aged HH
(41–64) (n = 91)
Younger HH
(under 40)
(n = 17)
Sig.
Total land owned
2278
3862
2717
.000**
Total estimated yearly income at time
of survey
12,881,419
23,600,407
17,697,059
.006**
Depth of water in yard
.48
.43
.36
.518
Depth of water in house
.13
.09
.029
.286
Property and HH asset damage
836,512
1,944,176
1,101,765
.459
Agricultural damage (absolute)
1,911,837
3,344,055
2,971,176
.012**
Relative agricultural damage (% of
income from this source lost by
flood)
70%
59%
55%
.854
Livestock damage
977,814
2,491,810
1,811,294
.069
Relative livestock damage (% of
income from this source lost by
flood)
45%
34%
76%
.514
Aquaculture/fishing damage
800,581
2,080,549
600,000
.014**
Relative aquaculture damage (%of
income from this source lost by
flood)
91%
198%
113%
.510
Business/trade damage
46,512
11,319
117,647
.483
Total cost of damages
4,600,465
10,167,129
7,401,882
.000**
Time to recover from floods
373
456
449
.452
** indicates significance of the results (p \ .05)
123
Nat Hazards
in advance of flood forecasts or immediately afterward to help, and therefore these
households did not unduly suffer from labor shortages. In a few cases of a female-headed
households being a widow, children of the woman in the area or neighbors would come
help her in advance and after floods.
4.5 Coping responses to flooding
There are two sets of possible responses to flood hazards: preparation (ex-ante) to anticipate flood exposures, vulnerability, and risk and try to reduce these, and coping, adaptation, and aid (ex-post) after floods to try to restore households to a pre-hazard state as
much as possible. Immediate preparation responses to floods in Kien Xuong usually
focused on listening to the weather forecasts and stockpiling food (rice, salt, and instant
noodles) and water (see Table 9). Residents also worked to reinforce houses (tying down
roofs, putting sandbags around foundations), trimming trees to avoid falling branches, and
reinforcing livestock pens and ponds (with sandbags or ropes). Households also commonly
donated some time or money to a local relief fund to prepare for flood impacts.
Ex-post actions were primarily focused on immediate disaster relief: repairing damaged
houses, fields, and ponds. Assistance after the floods came primarily from self-mobilized
sources, including borrowing money from banks or relatives, while only 3% of households
said they relied on government support post-flood. Friends and relatives were often the first
line of defense for immediate coping, as people could seek shelter in relatives’ houses, rely
on relatives to help them clean up afterward, and to provide loans if financial assistance is
needed after flooding happened.
The poorest third of households tended to take both ex-ante and ex-post actions that
were largely similarly to those of the sample as a whole, although the poor did tend to
donate labor or time to the community flood fund before floods, and less afterward. Poorer
households spent more time in ex-ante actions to protect property and livestock, especially
in low cost actions like trimming trees around the house or tying down livestock pens. The
poor were also less likely to have built roof mezzanines and were more likely to have sold
some assets to cover flood losses.
Overall, however, there were few ex-ante anticipatory actions that might reduce overall
flood vulnerability taken by any households, and longer-term adaptation actions after
floods were also quite limited; only a few households (less than 10%) indicated changes to
housing style (adding mezzanines to store goods above flood level, raising foundations, or
strengthening construction). Almost no households indicated that they might change
production patterns, or migrate out.
In t test comparisons of those households who took private actions to cope with floods,
or who contributed to community actions, we found only a few differences. For private
actions, those who did some preventative measures tended to have larger households
(indicating more laborers to help prepare) and larger landholding sizes. Income was not a
significant factor of those who prepared in advance. In terms of contributions to community activities, there were no significant differences between those households who
contributed and those who did not (Table 10).
4.6 Perceptions and concerns over future flood risks
The concept of risk refers to the fact that hazards like floods are experienced through the
interplay between exposure and vulnerability (Surminski and Oramas-Dorta 2014). Perceptions of exposure risk varied among surveyed households; only 8% of people surveyed
123
Nat Hazards
Table 9 Ex-ante and ex-post actions to deal with floods. Source Household survey, 2009
Action
% of all HH who
did
% of poorest
HH who did
Stockpiling food and water
69
65
Donating to local fund for disasters
68
76
Reinforce house
42
41
Listening to early warnings
40
37
Reinforcing livestock houses/ponds
34
43
Trimming trees
31
45
Moving household items to safe place
19
16
Moving family members to safe place
12
12
Preparing evacuation routes/equipment
9
12
Harvesting crops early
0
0
Restoring production activities (repairing ponds, replanting fields)
63
63
Repairing damaged goods/houses
36
37
Contributing labor and money to local relief fund
36
14
Borrowing money
21
25
Ex-ante actions (before the flood)
Ex-post actions (after the flood)
Rebuilding/strengthening house
9
6
Building mezzanine for roof
9
2
Asking for support from relatives
7
6
Contributing to dike/road repair
5
8
Selling assets
5
10
Planting trees to protect against wind, rain
5
6
Changing crop patterns/calendar
1
2
Diversifying production
1
0
Migrating for work
3
2
Asking for government aid
3
4
Bold indicates a notable difference between the number of poor people who took an action and those who
were better off
reported getting flooded regularly (every 5 years or less), while 22% said flooding every
10 years was more common. The majority of the households reported they ‘‘rarely’’
experienced flood events, indicating that most felt low risks from exposure to floods.
However, when rare floods were experienced, such as in 2003, vulnerability to these floods
was widespread, with flood losses on average one-third of the median household income.
There was no consensus among interviewed households over future flood risks or the
impacts of climate change; exactly half of the interviewed villagers said that future risks
were likely to be more severe, while half said risks would be less, or they did not know.
Those who thought the future would be worse expressed concern that climate change
would cause more rain, and the building of more infrastructure would block water flows;
together this was considered likely to cause more serious floods in the coming years.
Given this uncertainty about the future, most villagers surveyed had no specific plan to
reduce risk or prevent impacts from future flood events (48% had no plans). Slightly less
123
Nat Hazards
Table 10 Comparison of households that undertook private and community actions on floods. Source
Household survey, 2009
Took ex-ante
action related to
individual
property
(n = 100)
Did not take
action related to
individual
property
(n = 51)
Sig.
Took action (expost or ex-ante)
related to
community
(n = 130)
Did not take
action related
to community
(n = 21)
Sig.
HH head age
55.7
55.7
.507
54
59
.120
Size of HH
3.72
3.22
.041**
3.6
3.24
.285
Landholding
size
3515
2791
.049**
3362
2714
.201
Average
income in
non-flood
year
19,126,680
21,367,059
.517
20,787,115
14,288,714
.168
than half of survey respondents (44%) expressed interest in finding non-farm jobs to earn
money to cover household losses caused by floods and other natural disasters, but only
small numbers (around 5% of households) had actually acted on this idea after the 2003
flood. Most preferences for off-farm jobs were local, as long-term migration was seen to be
less desirable for the mostly older households who remain as agriculturalists in the RRD.
5 Discussion: social indicators and exposure, sensitivity, and adaptive
capacity to deal with floods in the RRD
Following interest within the climate change community in assessing the degree to which
households may be impacted by their exposure, sensitivity, and adaptive capacity to
weather and climate risks, like flooding (Turner et al. 2003), we discuss below how these
indicators were linked to social positions and livelihoods in our research site, and what the
implications may be for adaptation and other policy actions in the future to reduce flood
risk.
5.1 Poverty, livelihoods, and exposure
Poor households in the surveyed villages did not seem to experience greater exposure to
floodwaters, at least in terms of estimated water levels in yards and houses, which were
fairly even across all income classes. The fact that the RRD is somewhat more egalitarian
with regard to incomes and landholding sizes than other regions of Vietnam may suggest
that lower income inequality may result in distribution of flood exposure risk somewhat
more equally among households (Cuong et al. 2010). Further testing of this proposition in
other areas would be worthwhile, given that other reports exploring the impact of
inequality at the district level on flood impacts have been inconclusive (Casse 2013).
The main characteristic of those who experienced less exposure to floods in Kien Xuong
(those households self-assessing as low to no damage from the flood) was that they tended
to be older households, indicating that early settlement in a village may confer some
protection from floods, if households’ land and property are located in more secure areas
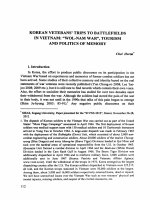
within protective dikes. Many newcomers or young families leaving their parents’
123
Nat Hazards
households have had to settle on the edges of villages, and may plant vegetables and other
secondary crops on more marginal lands outside protective dikes (see Fig. 4). Although
local authorities had advocated converting these fields outside dikes to fish ponds only, this
had not yet happened; further, these fish ponds would have also been vulnerable to
flooding, given the large losses by aquaculture-producing households in the 2003 floods.
The implications of this discussion of exposure are that studies in Vietnam which rely
only on mapping locations of households against flood forecast maps may not capture the
true dimensions of vulnerability (e.g., Dinh et al. 2012). That is, poor people, at least in the
RRD, may not be more exposed to flood risk than the non-poor, but as we note below, they
are still more sensitive to the exposure they do experience.
5.2 Poverty, livelihoods, and sensitivity
Vulnerability of households depends not just on their physical exposure to floods and
resulting impacts, but also on their sensitivity to these impacts. In terms of sensitivity, there
were clearer links to poverty. Poorer people had higher relative income damage, losing the
equivalent of 89% of their previous year’s agricultural income in the flood, compared to
the middle class or rich, who lost under 50%. Similar findings of highest relative damage
among the poor are also reported elsewhere for Vietnam, indicating that despite the different types of floods experienced, the impacts on poor people are remarkably similar
across the country (Casse 2013; Casse et al. 2015; Navrud et al. 2012). Livestock damages
were similarly uneven, though less statistically significant.
Fig. 4 Typical vegetable fields and housing along the Tra Ly River in Kien Xuong on right which are
vulnerable to flooding, and irrigated rice fields behind the dike on the far left side of the river
123
Nat Hazards
Richer households had more absolute income damage, experiencing total damages and
losses from the flood nearly three times as high as poor and middle-income households
(over 15 million VND vs. 4–5 million VND) (Table 6 previously). This indicates that the
rich also have particular vulnerabilities, such as those who have invested significantly in
new or risky ventures (in the RRD, such activities include duck ponds or aquaculture); such
a finding on the absolute damages incurred by the rich is echoed in other parts of Asia
(Brouwer et al. 2007).
Households with climate-sensitive livelihoods also were more impacted by floods than
others who reported more business and trade income. Exposure of agricultural households
to the 2003 flood was greater than any other livelihood sector, given the timing of the flood
event in early September before the fall rice harvest. This was reflected in the large number
of households involved in agriculture who reported impacts and damage, while those with
business or trade income noted very little income impacts to these sources. In terms of
overall damage within a sector, however, aquaculture was the single most exposed
livelihood, as damages from the flood were nearly 90% of the value of this sector compared to the year before (Table 6 previously). This perhaps suggests a more cautious
approach to promoting aquaculture as an alternative to rice production in the RRD; if this
sector is particularly exposed to income losses from floods, this may be an increasingly
risky venture in the future under climate change.
Reported recovery times were ambiguous across income classes; while other parts of
Vietnam report faster recovery among wealthier households (Razafindrabe et al. 2012), in
our study sites even richer households often expressed concern for longer recovery times
than middle-class households. The more households earned from natural resource-dependent income (including both rich and poor), the more reported time they tended to need for
recovery from damages, indicating that type of livelihood, rather than absolute income
levels, may be a better indicator of vulnerability, particularly for the RRD. These inconsistent patterns of absolute and relative vulnerabilities further indicate that climate vulnerability is complex and interconnected to overall entitlements and asset mobilization,
which can be difficult to predict into the future (Few 2006). Other social indicators of
vulnerability, such as being a female-headed household or being elderly, did not seem to
correlate with sensitivity to flood damage. Indeed, older households appeared to experience
less overall flood exposure, as noted above.
5.3 Poverty, livelihoods, and adaptation responses
Households in our study site primarily had reactive, rather than proactive, flood responses,
which tended to be aimed at the short term: listening to weather forecasts, battening down
houses, or evacuating goods and people. These actions were nearly evenly spread across
income classes, with only a few differences in poorer people choosing cheaper prevention
responses (such as trimming trees rather than building onto houses) and tending to donate
labor and money to the community fund ahead of floods, rather than afterward, perhaps in
anticipation of the difficulties they might have in donating after events (Table 9 previously). Unlike reports of adaptation measures taken by farmers in flooded areas of the
Mekong Delta (Dang et al. 2013), which have focused on changing production calendars
and varieties, such actions were very limited in our site in the RRD, which we attribute to
low awareness of flood risk, given the relatively infrequent flood experiences over the past
30 years, and overconfidence of authorities in the ability of infrastructural approaches such
as drainage and dikes in preventing floods. Focus groups revealed that many households
felt they and authorities had grown complacent about floods once better water drainage and
123
Nat Hazards
pumping equipment had been installed in 1985. Further, households reiterated multiple
risks (‘‘rui ro’’) they faced: livestock diseases, health risks, motorcycle accidents, and crop
pests among them, and floods were only one among many issues that required attention and
investments.
Other studies have indicated that individuals’ willingness to take precautionary action
against climate hazards is often a function of complex factors, such as risk perceptions,
previous experience with floods, and financial means, rather than simple household indicators like income or age (Grothmann and Patt 2005; Grothmann and Reusswig 2006; Lin
et al. 2008; Whitmarsh 2008; Ho et al. 2008; Schad et al. 2011). The fact that other risks
often co-occur along with floods, such as pests, inflation, poor health, and other concerns,
may reduce households’ awareness and concern about flood risk in isolation (Lo´pezMarrero 2010). While most households in Kien Xuong took some active flood response
measures, particularly in evacuation, these were the most pressing and often least cost
options; other options, particularly those that required capital, like buying boats or
changing house building styles, were less frequently taken. In other more urban areas of
Vietnam that have seen rises in floodwater frequency, increasing house floor level is one of
the most common strategies of ex-ante adaptation (Birkmann et al. 2010). Yet this was an
action taken by only a very small number of households in the study site, due to high
upfront costs and uneven perceptions of the seriousness of risk of flood hazards. Similar
results have been reported elsewhere for other areas of rural Vietnam (Dang et al. 2013).
There were limited ex-post adaptation responses as well in Kien Xuong, even for
cheaper measures; only a small number of households had changed cropping patterns or
seeds, or ‘‘hard adaptation’’ measures such as building small impoundments and drainage
systems in fields in response to flood pressures. Households in focus group discussions
reiterated that they understood that rice was a crop that was vulnerable to floods, given
timing of rice harvests and locations of rice fields in low-lying areas, but they considered
rice to be ‘‘least risky’’ when compared against alternative crops that might have no
market, or livestock who often were vulnerable to pests and diseases. The low levels of
adaptation actions taken in the study area are also likely attributable to a lack of clear
understanding of what the future will bring for households, with half of the surveyed
households thinking that climate change will bring more flooding, and the other half of
households surveyed not knowing or thinking flooding would be less in the future. The
evenly divided opinion over the causes of flooding and uncertainly about future climate
changes may have contributed to the lack of longer term or more proactive measures in
Kien Xuong, and similar findings regarding the uncertainty of climate and flood risk have
been reported elsewhere in Vietnam (Phong Tran et al. 2008; Dang et al. 2014).
The good news is that poverty levels alone did not appear to prevent coping or
adaptation actions from being taken: those households that had not taken proactive
prevention measures ahead of the flood did not appear to be poorer than those who had
taken measures (Table 10 previously), as income levels were not a significant predictor of
action. The more significant indicator was the household size, with smaller households
appearing to be able to take fewer preemptive measures, and households with smaller
landholdings, who perhaps felt less urgency to try to take some risk reduction measures.
The implications for assistance, from communities or government actors, are that smaller
households with labor shortages may need to be particularly targeted for help in advance
of floods, such as through sending volunteers to help these households evacuate or move
household goods.
Communities as a whole had also taken few steps to limit impacts or reduce vulnerability, although they did have relief funds in each locality to which a majority of
123
Nat Hazards
households contributed, and which were generally spent on buying emergency water or
food, and paying for labor for cleanup activities. These types of mutual assistance and
support have been shown elsewhere to be particularly useful for lower-income and more
vulnerable households (Braun and Aßheuer 2011), and they were used in Kien Xuong to
make up for the fact that national government disaster funds had been skimpy or nonexistent after flood events in this area. Focus group discussions highlighted areas that
households felt more governmental support for flood risk reduction would be useful. In
preparation for flood events associated with heavy rains in areas of inconsistent drainage,
the type most regularly experienced in Kien Xuong, households stated they would benefit
from well-publicized forecasting so that harvests can be brought in advance, or fish collected and held in protected traps. Longer-term adaptation to these types of floods will
require better infrastructure investment by the national state combined with local community response (e.g., keeping canals clear, keeping pumping machines maintained and up
to date), and households suggested flood-specific loans through banks could help households adapt. For rarer extreme flood events (those associated with out of season or
unusually large volumes of rainfall, or dike breaks or other infrastructure failures),
households stated that the existing emergency response will need to ensure everyone is
reached for evacuation, and that potentially risk reduction instruments like insurance could
be helpful, while in the longer-term households agreed that they will need to make hard
decisions about relocating houses or investing in different house styles in those areas far
away from drainage or not in protected dike zones.
However, there is little move within Vietnam toward more robust ‘‘flood risk management (FRM)’’ as a holistic approach to flooding which incorporates both hard infrastructural investments and soft approaches like land-use planning or insurance instruments
(Lempert et al. 2013). While there have been some experiments with insurance microprojects, nationwide lending in agricultural or flood insurance was essentially absent at the
time of the study (Skees et al. 2007; Wang et al. 2010). While researchers have found that
insurance is useful for not only covering losses of those affected, but can be used to
identify risk areas and raise awareness about preventative measures as well (Surminski and
Oramas-Dorta 2014), there is little discussion among authorities regarding flood insurance
as a useful tool in the RRD. There is also little discussion in Vietnam of how a FRM
approach could incorporate more participatory approaches that include local knowledge,
stakeholder negotiations, and public prioritization for infrastructure, as is the case in FRM
approaches elsewhere (Challies et al. 2015; Evers et al. 2016). Rather, Vietnam’s flood
responses in the RRD in particular remain resolutely top–down, and there is little participation in collaborative planning for reduced flood risk or longer-term adaptation (Chau
et al. 2014b). There is a certain degree of culturally embedded risk perception that will be
hard to change, in that there is a sense that it is the job of government and authorities to
provide flood infrastructure, not those of communities, and so to get them involved in FRM
will require trial and error (IMHEN & UNDP 2015). The path dependence of existing
flood control measures—focused on dike upgrades to the exclusion of other approaches—
means that these engineering solutions may be crowding out alternatives, and might even
be contributing to moral hazards by encouraging settlement in flood risk zones (Dang et al.
2011; Hung et al. 2007). These are all issues that will need to be confronted by both
authorities and affected communities in the RRD.
123
Nat Hazards
6 Conclusion
Future climate forecasts for Vietnam suggest that coastal and delta regions of the country
will experience an increase in the amount of people exposed to floods. Therefore, there is a
need to understand differential vulnerability and existing adaptation actions in these
regions. Within the RRD, our results indicate that vulnerability to flood events is highest
across certain livelihood sectors (agriculture and aquaculture, while business income is
little affected). These results confirm that those with climate-sensitive livelihoods are most
impacted by floods, leading to two possible policy suggestions for government focus: first,
promotion of some livelihoods (namely aquaculture) that have been prioritized in recent
years may in fact increase exposure of households to flood risks, and may need to be
rethought. Secondly, business and trade income livelihoods showed the least impact from
floods, and may suggest a possible alternative to promotion of climate-sensitive income
sources.
While poor people in particular do not appear to be more exposed to floods at our
fieldsite, they are more sensitive in the fact that floods inflict higher amounts of relative
damage to the poor, especially within the agricultural sector. Richer households were also
affected, though, and experienced higher levels of absolute damage. Age was also revealed
as an important variable as well. While the aging population of the RRD could have
potentially been a social vulnerability, in that older households might have less labor to
expend on flood prevention and recovery activities, the data showed that older households
actually tended to experience less flood exposure, with lower damage estimates overall in
the older household group.
In comparison with research on climate adaptation in other areas of the world (Agrawal
and Perrin 2013; Amaru and Chhetri 2013), the actions taken thus far in the RRD to adapt
to floods are quite limited, and activities were mostly limited to some ex-ante preparation
and some limited ex-post coping. While short-term coping can in fact contribute to
building long-term resilience (Jabeen et al. 2009), the majority of households interviewed
simply did not have any idea about what they should be doing into the future to help them
adapt to flood risk under future climate change. This is likely due to cognitive uncertainty
among households over the direction and causes of future flood risk. Overall, however, the
data did not show strong indications that the poor took less adaptive actions than others,
which is good news for future planning. Nearly all types of people felt they could take
some basic flood prevention actions, especially low cost ones, and community support as
measured in willingness to donate money or labor to flood relief locally was generally
high. This is a good foundation on which to build resiliency to climate change-induced risk
in the future.
However, while these data on poverty and other social vulnerabilities are generally
more positive than might be expected, the near absence of government support for flood
victims, along with a lack of insurance to cover losses, has meant that households in the
RRD must cover flood damage themselves. Repeated floods are likely to take a toll on
household welfare in the long term, especially as the most affected households felt that it
took them a year or more on average to recover from a serious flood. If such serious flood
risks continue to persist and even grow, the long-term impact could be to move households
away from high risk but high-return activities (like aquaculture and livestock) and back to
lower risk but lower-return activities (like rice). This could have a long-term impact on
economic growth and attempts to move households out of poverty and into the middle class
(Hallegatte et al. 2015).
123
Nat Hazards
The evidence from Thai Binh Province suggests that existing coping mechanisms of
advanced warnings and flood preparation, combined with more information on longer-term
forecasts and an institutional framework that facilitates more participatory and robust
future land-use and livelihood planning in the face of climate change, could potentially
lead to better long-term adaptation to flood risks, but this is not yet in place in most areas of
Vietnam (Adger 2000; Birkmann et al. 2012). How to improve the resiliency of households
and communities in the RRD to floods in the face of climate change, and what kinds of
mechanisms or institutions can facilitate that capacity, is still an open question, and is
clearly an area that needs more attention in the future.
Acknowledgements Funding for the Vietnamese authors was provided by the Economy and Environment
Program for Southeast Asia (EEPSEA). The authors thank Dr. Herminia A. Francisco, Director of EEPSEA,
for her support of this work both financially and intellectually, as well as advice from Dr. Bui Dung The,
Hue University. Support was also provided by an Arizona State University travel grant to the first author.
The authors would like to thank the director of the Center for Natural Resources and Environmental Studies,
Dr. Hoang Van Thang, for his strong support of this work, and for the administrative assistance of Ha Thi
Thu Hue, Pham Viet Hung, and Dang Thu Loan. Conversations with Mook Bangalore and Le Anh Tuan at
the World Bank about poverty and flooding were also helpful to frame our paper.
Funding This study was funded by the Economy and Environment Program for Southeast Asia (EEPSEA)
of the International Development Research Center, in a grant awarded to the Center for Natural Resources
and Environmental Studies, Hanoi, Vietnam, for the project: ‘‘Learning from Past Adaptation: Assessing
Adaptive Capacity to Climate Changes in the Red River Delta of Vietnam.’’
Compliance with ethical standards
Conflict of interest The authors declare that they have no conflict of interest.
References
Adger WN (1999) Social vulnerability to climate change and extremes in coastal Vietnam. World Dev
27:249–269
Adger WN (2000) Institutional adaptation to environmental risk under the transition in Vietnam. Ann As
Am Geogr 90:738–758
Agrawal A, Perrin N (2013) Climate adaptation, local institutions and rural livelihoods. In: Adger WN,
Lorenzoni I, O’Brien KL (eds) Adapting to climate change: thresholds, governance. Cambridge
University Press, Cambridge, pp 350–367
Amaru S, Chhetri NB (2013) Climate adaptation: institutional response to environmental constraints, and the
need for increased flexibility, participation, and integration of approaches. Appl Geogr 39:128–139.
doi:10.1016/j.apgeog.2012.12.006
Arouri M, Nguyen C, Ben Youssef A (2015) Natural disasters, household welfare, and resilience: evidence
from rural Vietnam. World Dev 70:59–77. doi:10.1016/j.worlddev.2014.12.017
Bangalore M, Smith A, Veldkamp T (2016) Exposure to floods, climate change, and poverty in Vietnam.
Policy research working paper; no. WPS 7765. World Bank Group, Washington DC
Beckman M (2006) Resilient society, vulnerable people: a study of disaster response and recovery from
floods in central Vietnam. PhD thesis, Swedish University of Agricultural Sciences
Beckman M (2011) Converging and conflicting interests in adaptation to environmental change in central
Vietnam. Clim Dev 3:32–41. doi:10.3763/cdev.2010.0065
Bich TH, Quang LN, Ha LTT, et al (2011) Impacts of flood on health: epidemiologic evidence from Hanoi,
Vietnam. Glob Health Action. doi:10.3402/gha.v4i0.6356
Birkmann J, Garschagen M, Kraas F, Quang N (2010) Adaptive urban governance: new challenges for the
second generation of urban adaptation strategies to climate change. Sustain Sci 5:185–206. doi:10.
1007/s11625-010-0111-3
123
Nat Hazards
Birkmann J, Garschagen M, Vo VT, Nguyen TB (2012) Vulnerability, coping and adaptation to water
related hazards in the Vietnamese Mekong Delta. In: Renaud F, Kuenzer C (eds) The Mekong Delta
system: interdisciplinary analyses of a river delta. Springer, Dordrecht, pp 245–289
Braun B, Aßheuer T (2011) Floods in megacity environments: vulnerability and coping strategies of slum
dwellers in Dhaka/Bangladesh. Nat Hazards 58:771–787. doi:10.1007/s11069-011-9752-5
Brouwer R, Akter S, Brander L, Haque E (2007) Socioeconomic vulnerability and adaptation to environmental risk: a case study of climate change and flooding in Bangladesh. Risk Anal 27:313–326. doi:10.
1111/j.1539-6924.2007.00884.x
Brown JD, Damery SL (2002) Managing flood risk in the UK: towards an integration of social and technical
perspectives. Trans Inst Br Geogr 27:412–426
Bruun O, Casse T (eds) (2013) On the frontiers of climate and environmental change: vulnerabilities and
adaptations in central Vietnam. Springer, Dordrecht
Casse T (2013) Livelihood strategies under the constraints of climate change vulnerability in Quang Nam.
In: Bruun O, Casse T (eds) On the frontiers of climate and environmental change: vulnerabilities and
adaptations in central Vietnam. Springer, Dordrecht, pp 119–131
Casse T, Milhøj A, Nguyen TP (2015) Vulnerability in north-central Vietnam: do natural hazards matter for
everybody? Nat Hazards 79:2145–2162. doi:10.1007/s11069-015-1952-y
Challies E, Newig J, Thaler T et al (2015) Participatory and collaborative governance for sustainable flood
risk management: an emerging research agenda. Environ Sci Pol 55:275–280. doi:10.1016/j.envsci.
2015.09.012
Chang C-H (2010) Preparedness and storm hazards in a global warming world: lessons from Southeast Asia.
Nat Hazards 56:667–679. doi:10.1007/s11069-010-9581-y
Chau VN, Holland J, Cassells S, Tuohy M (2013) Using GIS to map impacts upon agriculture from extreme
floods in Vietnam. Appl Geogr 41:65–74. doi:10.1016/j.apgeog.2013.03.014
Chau VN, Cassells S, Holland J (2014a) Economic impact upon agricultural production from extreme flood
events in Quang Nam, central Vietnam. Nat Hazards 75:1747–1765. doi:10.1007/s11069-014-1395-x
Chau VN, Holland J, Cassells S (2014b) Institutional structures underpinning flood management in Vietnam.
Int J Disaster Risk Reduct 10:341–348. doi:10.1016/j.ijdrr.2014.10.008
Cuong NV, Truong TN, van der Weide R (2010) Poverty and inequality maps for rural Vietnam. World
Bank Policy Research Paper 5443, Washington DC
Cutter SL, Mitchell JT, Scott MS (2000) Revealing the vulnerability of people and places: a case study of
Georgetown County, South Carolina. Ann As Am Geogr 90:738–758
Dang NM, Babel MS, Luong HT (2011) Evaluation of flood risk parameters in the Day River Flood
Diversion Area, Red River Delta, Vietnam. Nat Hazards 56:169–194. doi:10.1007/s11069-010-9558-x
Dang HL, Li E, Nuberg I, Bruwer J (2013) Farmers’ assessments of private adaptive measures to climate
change and influential factors: a study in the Mekong Delta, Vietnam. Nat Hazards 71:385–401. doi:10.
1007/s11069-013-0931-4
Dang HL, Li E, Nuberg I, Bruwer J (2014) Farmers’ perceived risks of climate change and influencing
factors: a study in the Mekong Delta, Vietnam. Environ Manag 54:331–345. doi:10.1007/s11252-0130299-y
Davies M, Guenther B, Leavy J (2009) Climate change adaptation, disaster risk reduction and social
protection: complementary roles in agriculture and rural growth? IDS Working Paper 320, Sussex
Devienne S (2006) Red River Delta: fifty years of change. Moussons 9–10:255–280. doi:10.4000/moussons.
2042
Dinh Q, Balica S, Popescu I, Jonoski A (2012) Climate change impact on flood hazard, vulnerability and risk
of the Long Xuyen Quadrangle in the Mekong Delta. Int J River Basin Manag 10:103–120. doi:10.
1080/15715124.2012.663383
Douben K-J (2006) Characteristics of river floods and flooding: a global overview, 1985–2003. Irrigat Drain
Syst 55:S9–S21. doi:10.1002/ird.239
Dun O (2011) Migration and displacement triggered by floods in the Mekong Delta. Int Migr 49:e200–e223.
doi:10.1111/j.1468-2435.2010.00646.x
Ehlert J (2013) Beautiful floods: environmental knowledge and agrarian change in the Mekong Delta. LIT
Verlag, Bonn
Evers M, Jonoski A, Almoradie A, Lange L (2016) Collaborative decision making in sustainable flood risk
management: a socio-technical approach and tools for participatory governance. Environ Sci Pol
55:335–344. doi:10.1016/j.envsci.2015.09.009
Few R (2006) Flooding, vulnerability and coping strategies: local responses to a global threat. Prog Dev
Studies 3:43–58. doi:10.1191/1464993403ps049ra
Few R, Tran PG (2010) Climatic hazards, health risk and response in Vietnam: case studies on social
dimensions of vulnerability. Glob Env Change 20:529–538. doi:10.1016/j.gloenvcha.2010.02.004
123