DSpace at VNU: Upsizing manufacturing line in Vietnamese industrial plants: A simulation approach
Bạn đang xem bản rút gọn của tài liệu. Xem và tải ngay bản đầy đủ của tài liệu tại đây (612.81 KB, 12 trang )
Proceedings of the 2013 Winter Simulation Conference
R. Pasupathy, S.-H. Kim, A. Tolk, R. Hill, and M. E. Kuhl, eds.
UPSIZING MANUFACTURING LINE IN VIETNAMESE INDUSTRIAL PLANTS:
A SIMULATION APPROACH
Nguyen Dang Minh
Nguyen Dang Toan
University of Economics and Business, Vietnam
National University, Hanoi
Xuan Thuy Road, Cau Giay Dist
Hanoi, VIETNAM
Media Tenor International, Hanoi
Trung Tien Street, Dong Da District
Hanoi, VIETNAM
ABSTRACT
Vietnamese industrialists have understood that simulation studies can help to form a more reliable manufacturing line than conventional methods that for the most based upon engineering experiences. However,
the use of simulation has not been applied in designing the manufacturing line, and a confident method of
designing a new manufacturing line or modifying the capacity of a current manufacturing line (CML) has
remained a task in Vietnamese industrial plants. The main purpose of this research is to propose a new
perspective of a simulation study in Vietnamese industry from an empirical point of view to implement
the framework for designing a manufacturing line. The second purpose is to introduce the method and analytical procedures of modifying a CML utilized by a linear programming (LP) model for selecting. The
proposed method was applied in an actual design project to confirm the feasibility of the framework.
1
INTRODUCTION
The Manufacturing line (ML) design plays a critical and valuable role in today’s manufacturing system.
Developing a more efficient ML and bringing it to realization is the main task of ML designers. In present
manufacturing activities, there are two main tasks for ML designer; the first is to design a new ML and
the second is to modify the current manufacturing line (CML) when the required production volume increases over the line capacity.
After conducting interviews with Vietnamese industrial manufacturers, the authors realized that manufacturing lines were traditionally designed following conventional methods and, for the most part, were
based on engineering experience and simple calculations of labor utilization, machine utilization, and line
productivity with constant processing data. However, the experience of designers is not always at the
same level and conventional methods of design cannot simulate the actual situation of the ML because of
some factors such as unevenness of processing data or machine failures. The application of a simulation
study has been lacking in this field. The main reason is that no method or procedure setting a practical
ML design with application of simulation study has been applied within the manufacturing society. Vietnamese designers are still hesitant to apply simulation for designing the ML, preferring conventional
methods of design.
From an academic aspect, approaches related to manufacturing system design using simulation studies have been briefly reviewed as follows:
Firstly, research about the conversion of an existing manufacturing system into a new system was presented; for example, in the conversion from a job shop to a cellular manufacturing system (Durmusoglu
1993; Satoglu et al. 2006), and a US traditional manufacturing system to just-in-time system (Dyck 1998).
Simulation of alternatives for simulating an old manufacturing method to a new system has been introduced in those studies; however, these studies failed to provide a method of how to design a ML based on
initial information of product (production volume, line capacity, process cycle time).
978-1-4799-3950-3/13/$31.00 ©2013 IEEE
1835
Minh and Toan
Secondly, research about the modification of the current manufacturing systems has been proposed (William et al. 2002; Grimard and Marvel 2005; Taj et al. 1998; Gujarathi et al. 2004). Such research focused
on the improvement of a specific line rather than proposed a general method in solving the task of increasing current ML capacity when production volume was increasing. Furthermore, several studies with
method of sizing the ML (Schniederjans and Hoffman1999; Masmoudi 2006) were also investigated.
However, the proposed sizing methods in these studies were not practical in modifying CML capacity
while satisfying the requirement of the process cycle time and available space constraints within a factory.
Thirdly, research analyzing specific factors of a manufacturing system has also been discussed. These
studies concentrated on analyzing the impact of some detailed factors in the ML such as in breakdowns
(Elleuch et al. 2007), takt time (Duanmu and Taaffe 2007) and bottlenecks (Roser, Nakano, and Tanaka
2001) in the system. These studies also did not provide methods of how to design or modify a ML from
initial requirements.
However, the extant literature has not specifically found out the method of designing a new ML for
Vietnamese industrial plants from the beginning stage with initial information of the product and the
method of modifying a CML when production volume increases over the line capacity. From both the
practical and theoretical point of view, the method of ML design using a simulation in a study to establish
an efficient ML before fabricating and purchasing equipment is emerged in Vietnamese automobile manufacturing plants.
From the above-mentioned context, the first contribution of this research is to introduce a new
framework for a ML design process from the empirical manufacturing point of view. The framework provides a general idea of how to design a new ML with a simulation study. The second contribution is to
propose a distinguished method for modifying a CML when production volume increases over the line
capacity. In this design process, a LP model is proposed for selecting alternatives for the simulation study.
Finally, a comprehensive empirical design project in modifying an actual CML in Company A in Vietnam
is introduced for ensuring the framework and understanding the important role of simulation studies in
making decisions for the most efficient line. The project was completed by a project team led by the author of this article over a three year period and then handed-over to the factory in the beginning of 2013.
2
FRAMEWORK FOR MANUFACTURING LINE DESIGN IN VIETNAMESE
MANUFACTURING PLANTS
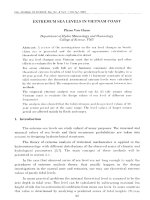
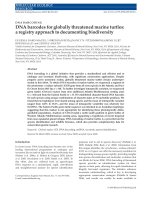
The general concept and method for ML design projects are introduced in Figure 1. The content of this
concept is explained in the following section.
2.1
Manufacturing Line (ML) New Project Information
The content of this concept is explained in the following section. The following information for the project is given to designers:
ML capacity: ML capacity is initially set by top-class managers of the company, this is given to ML
designer for deciding process cycle time and calculating manufacturing cost.
Product model life: product model life is the information concerning the number of years the ML will
be used for manufacturing activities; this information helps ML designers calculate the depreciation
cost of investment equipment.
Takt time of the manufacturing line: takt time is the maximum time that should be taken in producing
one unit of product. Takt time can be used to decide how many workers should be used for the ML. In
the new ML designs, takt time is often set at a higher percentage than process cycle time in covering
some estimated fluctuations of the market demand. In case of modifying a CML, takt time is often set
equal to process cycle time to save modification costs.
Product drawing: from the technical information written in product drawing, the processing method
and process sequences are decided.
With this information, the ML development can begin.
1836
Minh and Toan
1. New project information
(manufacturing line capacity,
product model life, takt time, product drawing)
Buy
2. Make-or-Buy
Make
• Simulation study
3. Design and make a new manufacturing line
• Decide the number of processes and
standardized processing operation for each process
Resource utilization
• Collect data for simulation
Manufacturing cost
Line productivity
• Select alternatives for simulation study
• Build alternative simulation models
• Analyze simulation results
and decide efficient alternatives
• Make the manufacturing line
No
4. Perform a trial
to check actual results of the
designed line
Satisfy design requirement
5 . Hand over to the factory
6. Investigate periodically
the market demand
No
Production volume fluctuation
7. Design and modify the line
• Simulation study
• Decide alternatives of modification line for
simulation study based on LP model result analysis
Resource utilization
• Build alternative simulation models
Manufacturing cost
Line productivity
• Analyze the simulation results
and decide efficient alternatives
• Modify the line
8. Perform
a trial to check results of the
modification
Satisfy modification requirement
9. Finish the project
Figure 1: Framework of Manufacturing line design (MLD) for Vietnamese industrial plants
2.2
Make or Buy
Based on the project information, the make or buy process is investigated carefully. Make refers to made
in-house and Buy refers to a product sent to an outside manufacturer. Make or Buy decision involves discussions with various related divisions in the company by project team members. In the case of a Buy de1837
Minh and Toan
cision, the manufacturing line design project will conclude, otherwise the project will progress to the next
process.
2.3
Design and Make a New Manufacturing Line
A ML design can be developed through a simulation process. Resource utilization, line productivity and
manufacturing costs are all considered in developing the most efficient line. In a manufacturing line design project, productivity is calculated as a ratio of actual output multiplied by takt time over the total operation time. This specific design process for new manufacturing lines was carried out in the following
steps:
Firstly, a decision was made on the number of processes and standardized processing operations
based on manufacturing technology, empirical know-how of the company, and quality and technical requirements of the product.
Secondly, data from standardized processing operations for both manual and automated process was
collected from existing pilot lines (a pilot line is a line used for simulating every single standardized processing operation for a new project). Pilot project team-members joined together to simulate and measure
standardized processing operations for both manual and automated processing times. Data for cost simulation was collected from the company.
Thirdly, alternative options for the new manufacturing line were decided based on the amount of
workers and the type of equipment used for the line. The team investigated a manual operated manufacturing line with a manual processing machine, an automated production line with an automated machine
and a hybrid line with both automated and manual machines. The manual line was advantageous in simplicity and having a lower investment in equipment costs, however, the line used more human resources
than the automated line.
Fourthly, in building a simulation model, all alternatives were constructed based on information of data collection in the above-mentioned steps.
Fifthly, the simulation was analyzed based on a target of maximization in utilization of both machine
and workers, maximization of line productivity (company requirement was higher than 90%), and a minimization of manufacturing costs.
Finally, the chosen manufacturing line was constructed for trial to check the feasibility of the line.
2.4
Check Actual Results of the Designed Line and Hand over to the Factory
Production engineers and pilot members joined together to run the trial in checking the feasibility of the
line. Worker utilization, machine utilization, and line productivity were measured and compared with
simulation results. If the line satisfied a given design target, it was handed over to the factory, otherwise it
was re-modified until a satisfactory result was achieved
2.5
Investigate the Market Demand for the Product
The production volume of the product responded from market demand and was surveyed by the marketing division periodically. In case of a decrease in production volume, takt time and a number of workers
on the manufacturing line should be adjusted. The estimation of new requirements for production volume
increased over the initial estimated production volume for the CML, the manufacturing line could be
modified to ensure capacity.
2.6
Design and Modification of the Line
Firstly, the design team investigated the actual cycle time and worker cycle time of each process in order
to identify excessive processing time. Secondly, the team selected alternatives of modifying the CML
based on analysis process of the LP model results. Thirdly, the simulation models from the selected alternatives were constructed based on data collection in the CML and pilot line. Fourthly, the team analyzed
1838
Minh and Toan
the simulation results and chose an efficient alternative. Finally, after modifying the manufacturing line,
design team members performed a trial to re-confirm the feasibility of the modifications.
2.7
Check the Modification and Return to the Factory
Worker, machine utilization, and line productivity were measured to re-confirm the feasibility of the line
by project team and pilot members. Once the modifications satisfy design targets, the manufacturing line
can be returned to the factory, otherwise it would be modified again until achieving positive results.
When a manufacturing line is handed-over to the factory after a positive modification, the design process has been completed.
3
METHOD FOR SELECTING ALTERNATIVES
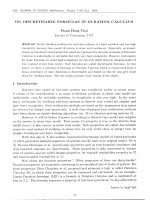
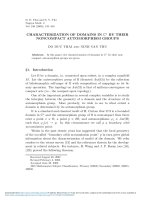
The CML is described as shown in Figure 2. The CML has n processes including n1 manual process PMi,
n2 automated process PAj, p processing types, (processing type is the method of manufacturing, for example, a motorbike welding manufacturing line has some processing type such as type 1 (arc weld), type2
(nut weld), type 3 (spot weld).
Process 1
Process 2
Process 3
Process 4
(Type 1)
(Type 2)
(Type 3)
(Type 1)
Manual (PM1)
Automated (PA1)
Manual (PM2)
Automated(PA2)
Process i
…
(Type pi)
….
Manual (PMi)
Figure 2: Image of current manufacturing line (CML)
The general idea of deciding upon alternatives for a simulation study is illustrated in Figure 3. The
processes that had process cycle time over the new required process cycle time were identified. Excessive
time in the current process must be reduced to satisfy the new requirement. Because the process cycle
time is combined from worker set-up time and machine processing time (Monden 1998), so that the excessive time can be reduced basically by reducing the set-up time of worker and processing time of machine. For a line modification project, worker set-up time was assumed fixed (from the empirical point of
view, it was difficult to reduce worker set-up time due to it having been done in everyday improvement
activities). As a result, the project team concentrated only on reducing the machine processing time. In
cases where a current process is completed manually, excessive time can be reduced by moving the excessive time to a new process or change the manual process to an automated process (the processing time
of an automated machine is faster than a manual machine). In cases where the current process is automated, this excessive time can be moved to a new process. Analytic procedures of LP model results were applied in making the decision for selecting the alternatives.
1839
Minh and Toan
1. Investigate the CML to identify excessive time of every process
(Excessive time = Current process cycle time – New requirement of process cycle time)
2. Reduce excessive time
2. 1 Possibility for reducing excessive time of manual process:
•
Move the excessive time to new process
•
Change the manual process to automated process
2. 2 Possibility for reducing excessive time of automated process:
•
Move the excessive time to new process
2. Build LP model
Objective
Minimum investment cost of new process
Constraint
Satisfy the new requirement of processing cycle time
Satisfy the amount of available space for new added process
3. Analyze the LP model results based on proposed analytic procedures
4. Decide alternative for simulation study
Figure 3: Method for decide alternatives for simulation study
3.1
Linear Programming (LP) Model
A LP model was proposed in selecting alternatives for simulation study. This model assists in solving the
number of new processes that should be increased while minimizing the total equipment investment costs
in equation (1) below. The expressions in (2) and (3) set the condition that available processing time of
new processes has to satisfy the excessive time of the current process. The space constraint for the new
process presented in (4) shows the condition of total space occupied by new processes and must satisfy
the available space within the factory.
Minimize
n
n
(1)
z ai xi b j y j
1
2
i 1
j 1
Subject to:
tmi xi kmi emi
(2)
taj y j kajeej
(3)
n1
n2
x y
i 1
i
j 1
j
(4)
q
where:
xi, yj : number of new processes should be increased for every current manual and automated
process respectively ( xi, yi≥0, real ) (process).
ai, bj : investment cost for increasing one process xi and yj (1000$)
tmi, taj : available machine processing time for the new process xi, yj (sec)
tmi tr smi
(5)
taj tr saj
tr
smi, saj
emi eaj
: new requirement of process cycle time of the modification line (sec)
: set up time of workers for the new process xi, yj (sec)
: excessive time of the current process PMi, PAj (sec)
1840
(6)
Minh and Toan
kmi, kaj : coefficient indicating the differences of processing speed between current machine and
newly added machines in the process PMi, PAi. (kmi, kaj ≥0)
q
: amount of available space for new added process (q>0, integer)
The LP model is built into two cases when a new process is considered as manual and automated respectively. Data of processing time that uses the LP model is considered as constant data quoted from the
average results of the current line.
3.2
Analytic Procedures for the linear Programming (LP) Model Results
Based on the results of the LP model simulation, the following empirical engineering procedures were
proposed for selecting the new process and estimating the number of workers for the selected alternatives.
1. Combining processes xi and yj to one process if processing type of xi and yj were the same, and satisfy condition given in (7).
(7)
xi y j 1
2.
Changing the current manual process to automated process if the current manual process satisfied the
new requirement of processing time condition expressed in (8). Furthermore if the newly modified
automated process still had capacity, the process was combined with other automated process that
had the same processing type given in condition of (9).
(8)
(t e )k t
mi mi mi mi
(tmi emi )kmi
yi 1
tmi
(9)
3. Combining the excessive processing time of the inspection and repair process with its preceding and
subsequent process (same concept with condition given in (7)).
4. Number of workers for the alternative was decided after selecting a number of new processes. Necessary workers were calculated as total manual processing time and waking time divided by the process cycle time given in (10)
nw
where:
nw
g1, g2
smi, saj
tpi
twi
4
g1
g2
g 1 g 2
1
1
1
(smi t pi ) saj
t
wi
tr
(10)
: number of estimated worker (nw > 0, integer)
: total manual and automated processes of the modification line (process)
: set up time for manual process and automated process (sec)
: manual processing time of worker for manual process (sec)
: estimated walking time of worker for every process (sec)
APPLY PROPOSED METHOD TO AN ACTUAL DESIGN PROJECT
In this section, an actual project of modifying a CML in Company A is introduced in order to enhance understanding of proposed method.
The modification of increasing line capacity of a current cellular welding ML was requested by the
Production Planning Division. The line has been utilized for three years with information on the modification is shown in Table 1. Production volume of the modification line was requested to increase to 17000
units/month, takt time and process cycle time were reduced to 58 seconds (as mention in previous section,
for the modification of CML, the new process cycle time and worker cycle time was also set equal to required takt time)
Table 1: Information for the modification line
1841
Minh and Toan
Items
Line capacity
Process cycle time
Process takt time
4.1
Current manufacturing line
13500 units/month
71 seconds
98 seconds
New requirement of the modification line
17000 units/month
58 seconds 58 seconds
Running Heads
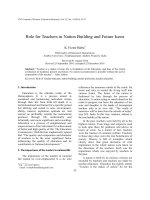
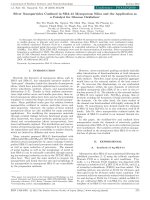
The concept of the CML is shown in Figure 4, which followed the just-in-time manufacturing method
(Monden1998) in which parts (part 1, part 2, part 3, and part 4) were fed into the system at a constant rate
base on takt time. The CML was operated by 3 workers that worker 1 was in charge of process 1 (manual
nut welding PM1) and process 2 (automated arc weld PA1), worker 2 was responsible for process 3 (manual spot weld PM2) and process 4 (automated arc weld PA2), worker 3 was in charge of process 5 (additional automated spot weld PA3) and process 6 the (final manual inspection and repair PM3).
Part 1
Part 2
Part 3
Part 4
Process 1
(Type 1)
Process 2
(Type 2)
Process 3
(Type 3)
Process 4
(Type 2)
Process 5
(Type 3)
Process 6
(Type 4)
Manual nut weld
(PM1)
Automated arc
weld (PA1)
Manual spot weld
(PM2)
Automated arc
weld (PA2)
Automated spot
weld (PA3)
Manual inspection
& repair (PM3)
Worker 3
Worker2
Worker1
Finished
Part Out
Figure 4: Concept of the current manufacturing line
Actual process cycle time of each process were measured for identifying excessive time (13 seconds,
10 seconds, 13 seconds, 10 seconds, 12 seconds, 10 seconds for process 1, 2, 3, 4, 5, 6 respectively).
4.2
Linear Programming (LP) Model
LP model for the case one (new process was considered as manual process) and case 2 (new process was
considered as automated process) was given as:
Min: z 60* (150** ) x1 78* (170** ) x2 40* (120** ) x3 80* (180** ) y1 85* (180** ) y2 75* (165** ) y3
Subject to:
48x1 1* (0.67** ) 13
42 x2 1* (0.55** ) 13
42 x3 1* (0.8** ) 10
43 y1 1.5* (1** ) 10
45 y2 1.5*. (1** ) 10
45 y3 1* (1.5** ) 12
x1 x2 x3 y1 y2 y3 2
(*): parameters for case 1; (**): parameters for case 2
All parameters using the LP model was quoted from CML of the company.
4.3
Analyze LP Model Results and Decide Alternatives for a Simulation Study
The LINDO programming software (Schrage 1997) was applied to assist in solving the LP model in
both case 1 and case 2. Results of the new process (x1 x2, x3, y1, y2, y3) are given in Table 2.
Table 2: LP results
Type
Current process for the CML
Results
Type 1
Process 1
x1
Process 2
y1
Type 2
Process 4
y2
1842
Process 3
x2
Type 3
Process 5
y3
Type 4
Process 6
x3
z
Minh and Toan
Case 1
Case 2
0.27
0.18
0.34
0.23
0.33
0.22
0.30
0.17
0.40
0.27
0.23
0.19
136.2
204.8
Based on the analytic procedures of (7), (8), and (9) given in section 3.2 of this paper, the final analysis results for reducing excessive processing time are summarized as:
Current process 1 (type 1): change to automated nut weld process
Current process 2 and process 4 (type 2): move the excessive processing time of these processes
to one new arc weld process (this new arc process can be selected as manual process for Alternative 1 and automated for Alternative 2).
Current process 3 (type 3): change to automated spot weld process.
Current process 5 (type 3): move the excessive processing time to process 3 when process 3 was
changed to automated process
Current process 6 (type 4): move excessive inspection time to the new arc weld process (because
the arc weld process still has capacity).
The estimation of the number of workers for both alternatives was decided based on the method
shown in step (10). The average data for the calculation is referred from Table 3. The calculation results
for case 1 and case 2 are given as: nwalternative1 = (206/58=3.6); nwalternative2 = (171/58 = 2.9). As a result,
four workers were selected for alternative 1 and three workers were estimated for alternative 2.
New process for the modification
Manual set up time
Manual processing time
Estimation of walking time
Manual set up time
Manual processing time
Estimation of walking time
Process 1 Process 2 Process 3 Process 4 Process 5 Process 6
10
16
16
16
13
13
35
5
5
5
5
5
5
10
16
16
16
13
13
5
5
5
5
5
5
Process 7
13
39
5
13
39
5
Al
ter.2
Alter.1
Table 3: Parameters of worker manual processing and walking time (seconds)
Both alternative 1 and alternative 2 have its own advantages. Investment costs in the process of alternative 1 were cheaper while the labor costs for alternative 2 were lower. Alternative 1 and case 2 were selected for a simulation study.
4.4
Data Collection for Simulation Study
The data for each standardized operation in seven processes of both alternatives was collected by the project team-members. The data of the modified process (process 1, process 3, and process 6) was collected
from pilot line. The data in the remaining process 2, 5 and 7 was collected from the CML. Besides the operation time, the following information was also obtained from the factory: there were two production
work shifts consisting of eight hours each. In each shift, the worker was allowed one hour for a meal and
two 15-minute tea breaks. Average unplanned failure on the manufacturing line and repair rates in the final inspection process quoted from past data from the factory. The sample size of each standardized processing operation was 50. The final results of collected data are summarized in Table 4.
4.1
Simulation Model
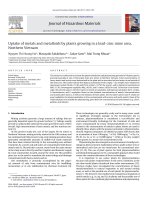
Simulation models were built using the software Arena (Kelton, Sadowski and Sturrock 2007). Input parameters and simulation run conditions were set-up based on information explained section 4.4 above.
Parts were fed into the system at a constant rate based on required takt time. The simulation run time was
set to 100 working days with 100 replications. In this project, a simulation model of each alternative was
also built and executed separately due to resource differentials. An example of a process flow for alternative 2 is illustrated in Figure 5.
1843
Minh and Toan
4.1
Analyze Simulation Results and Decide an Efficient Alternative
The purpose of the simulation study for this project is to reveal which alternative satisfies the design requirements included concerns with higher resource utilization, over 90% of line productivity, and lower
manufacturing costs. Simulation results from each of the alternative are summarized in table 5.
Table 4: Parameters for simulation model (seconds)
Standardized operation
Process 1
Process 2
Process 3
Process 4
Process 5
Process 6
Process 7
Load part on jig by
TRIA(4,5,6) TRIA(8,9,10) TRIA(8,9,10) TRIA(8,9,10) TRIA(5,6,7) TRIA(5,6,7)
TRIA(5,6,9)
worker
Slide finished part to
TRIA(3,5,6) TRIA(5,7,8) TRIA(5,7,8) TRIA(5,7,8) TRIA(5,7,8) TRIA(5,7,8)
TRIA(5,7,9)
next process by worker
Automated weld by roUNIF(15,30)
UNIF(43,45) UNIF(40,42) UNIF(38,40) UNIF(41,43) UNIF(41,43)
bot
(**)
TRIA(26,29,36)
Manual weld by worker
(*)
UNIF(10,20)
Inspection by robot
(**)
Manual inspection by
TRIA(10,12,15)
TRIA(35,37,50)
worker
(* )
Manual repair by worker
TRIA(25,30,35)
(Repair rate =10%)
Worker walk in process Worker1:TRIA(14,16,20); Worker2: TRIA(14,16,20); Worker3: TRIA(2,3,4); Worker4: TRIA(2,3,4) (*)
for alternative 1
Worker 1: TRIA(14,16,20); Worker 2 TRIA(14,16,20); Worker 3: TRIA(2,3,4)
(**)
Unplanned break failure
Time to Failure: TRIA(5400,7200,10800); Failure time: TRIA(50,70,90)
Notation: TRIA=Triangular, UNIF=Uniform, (*): for alternative 1, (**): for alternative 2
1. Load part on
process 1 jig
11. Automated
Spot weld by
robot 3
12. Worker 2
return to
process 4
10. Automated arc
weld & inspection1
by robot 6
11. Slide finished
part to process
7
10. Slide finished
part to process 4
1. Load part on
process 4 jig
2. Slide finished
part to process 2
9. Load part on
process 3 jig
2. Slide finished
part to process 5
9. Load part on
process 6 jig
3. Automated
nut weld by
robot 1
8. Worker 1
walk to
process 3
3. Automated
arc weld by
robot 4
8. Worker 2
walk to
process 6
7. Automated
arc weld by
robot 2
4. Worker 2
walk to
process 5
4. Worker 1
walk to
process 2
12. Worker 1
return to
process 1
5. Load part on
process 2 jig
6. Slide finished
part to process 3
5. Load part on
process 5 jig
6. Slide finished
part to process 6
7. Automated
spot weld by
robot 5
1. Load part on
process 7 jig
2. Manual
inspection2
4. Slide finished
part to complete
pallet
b) Worker 2
a) Worker 1
3. Repair part
c) Worker 3
Figure 5: Example of process flow of alternative 2 for simulation model
Table 5: Simulation results
Line productivity
(%)
Manufacturing
Cost ($/unit)
Robot of
process 6
94.4
98.4
Robot of
process 5
95.4
-
Robot of
process 4
Average
98.4
98.5
Robot of
process 3
Worker 4
94.1
98.3
Robot of
process 1
Worker 3
87.9
98.4
Robot of
process 1
Worker 2
Alt 1
Alt 2
71.7
72.1
96.4
98.3
14.9
13.2
Robot utilization (%)
Worker
1
Worker utilization (%)
Average
Resource utilization
75.8
75.8
70.7
70.7
67.2
67.2
72.4
72.4
72.4
72.4
73.8
1844
Minh and Toan
The alternative one was designed to employ four workers and five robots with an average utilization
of 94.4% and 71.7% respectively. The alternative two used three workers and six robots with an average
utilization of 98.4% and 72.1% respectively. The results showed that the alternative two achieved higher
resource utilization.
The line productivity of each alternative was also calculated from a simulation model. Both alternatives achieved the design requirement (higher than 90%), however, the alternative two was more advantageous.
Manufacturing costs in both alternatives also were estimated by data quoted from the company’s finance and accounting division. The final results were summarized with the manufacturing costs of alternative two being lower because labor costs in the alternative one were higher than the depreciation costs
in the alternative two.
In summarizing the simulation study, the alternative two achieved higher resource utilization and satisfied the design requirement for productivity and lower manufacturing costs. The alternative two was,
therefore, selected to modify the manufacturing line.
4.2
Check Actual Results of the Modification and Hand over the Factory
Automated robots and associated equipment were purchased and installed, and then a final trial was completed by project-team members after adjusting the machines, robots and parts at good quality condition.
Trials were carried out for three working days in order to re-confirm the feasibility of the line (due to time
and budget constraints, the team could not run a trial as long as the simulation conditions). Actual trial results of the resource utilization and line productivity were very close to the simulation results (average
utilization was 98% for workers and 72% for robots, while the line productivity was 98%).
Average actual results of the process cycle time and worker cycle time were also measured (process
cycle time were 57, 57.5, 57.5, 56.5, 57,57 and 56.5 seconds for process 1,2,3,4,5,6,7 respectively; worker
cycle time were 57, 57.5, and 56.5 seconds for worker 1, worker 2, worker 3 respectively). The actual results show that the chosen manufacturing line satisfies the design target (58 seconds), the line could be returned to the factory for manufacturing activities.
The proposed method was useful in investigating the feasibility of modifying a ML. In this project,
the simulation study also assisted in reducing project time in the design process (10% of the total designed time) and saved costs in line modification (7% of the total equipment investment costs) in comparison with the conventional design method in previous projects.
5
CONCLUSIONS
A framework in ML designs in Vietnamese manufacturing plants was introduced to show the contribution
of a simulation study in the whole design process. The method for combining a LP model and simulation
investigation was helpful for ML designers in dealing with the ML modification task. The proposed
framework and designed method have opened up new potential for ML design for the application of simulation models in the Vietnamese automobile manufacturing plants.
A simulation study not only can help engineers discover better options for developing efficient
equipment but can also save time and money from mistakes in redesigning and re-fabricating equipment
in comparison with conventional methods that for the most part were based on engineering experience.
However, limitations in the application of a simulation study in actual ML design still exist. For instance,
the company needs to organize training program for engineers to obtain professional knowledge in building simulation model. The concept of the ML design in this research can be extended to other manufacturing areas in future research.
REFERENCES
Dyck, H., Johnson A. J. 1988. “Transforming a traditional manufacturing system into a just-in-time system with kanban”. Proceedings of the 1988 Winter Simulation Conference 616-623.
1845
Minh and Toan
Duanmu, J. and Taaffe K. 2007. “Measuring manufacturing throughput using takt time analysis and simulation”. Proceedings of the 2007 Winter Simulation Conference 1633-1640.
Durmusoglu, M. B. 1993. “Analysis of the conversion from a job shop system to a cellular manufacturing
system”. International Journal of Production Economics Vol. 30-31: 427-436.
Elleuch, M., Masmoudi F., Ben Bacha H., and Maalej A. Y. 2007. “Simulation of manufacturing cells
with unreliable machines”. International Journal of Simulation Modeling Vol.6, No.1: 5-12.
Grimard, C. and Marvel J. H. 2005. “Validation of the Re-design of a manufacturing work cell using simulation”. Proceedings of the 2005 Winter Simulation Conference 1386-1391.
Gujarathi, N. S., Ogale R. M., and Gupta T. 2004. “Production capacity analysis of a shock absorber assembly line using simulation”. Proceedings of the 2004 Winter Simulation Conference 1213-1217.
Kelton, W. D., Sadowski R. P., and Sturrock D. T. 2007. Simulation with ARENA. McGraw-Hill, New
York.
Masmoudi, F. 2006. “Sizing manufacturing cell machines base on the simulation and an expert system”.
International Journal of Simulation Modeling Vol.5, No.2: 45-55.
Monden, Y. 1998. Toyota Production System: An Integrated Approach to Just-In-Time. Industrial Engineering and Management Press, Georgia.
Roser, C., Nakano M., and Tanaka M. 2001. “A practical bottleneck detection method”. Proceedings of
the 2001 Winter Simulation Conference 949-953.
Satoglu, S. I., Durmusoglu M. B., and Dogan I. 2006. “Evaluation of the conversion from central storage
to decentralized storages in cellular manufacturing environments using activity-based costing”. International Journal of Production Economics Vol.103: 616-632.
Schniederjans, M. J. and Hoffman. J. J. 1999. “Downsizing production/operations with multi-objective
programming”. International Journal of Operations and Production Management Vol.19, No.1: 7991.
Schrage, L. 1997. Optimization model with LINDO. International Thomson Publishing, New York.
Taj, S., Cochran D. S., Dura J. W., and Linck J. 1998. “Simulation and production planning for manufacturing cells”. Proceedings of the 1998 Winter Simulation Conference 973-977.
William, G. S., Thomas N. M., and Eileen M. V. A. 2002. “Equipment replacement decisions and lean
manufacturing”. Journal of Robotics and Computer Integrated Manufacturing Vol.18: 255-265.
AUTHOR BIOGRAPHIES
NGUYEN DANG MINH is Director of Research, Cooperation and Development Department, University of Economics and Business, Vietnam National University, Hanoi. His research interests are in the area
of securities and investment analysis, optimization of make or buy decision making process, production
line design using simulation and multiple economic factors. His email address is
NGUYEN DANG TOAN is a researcher at Media Tenor Vietnam and Vietnam Development Forum.
His research interests are Monte Carlo methods with a specific focus on Corporate Valuation and Stock
Valuation. His email address is
1846