DSpace at VNU: Observation of double charm production involving open charm in pp collisions at root s=7 TeV
Bạn đang xem bản rút gọn của tài liệu. Xem và tải ngay bản đầy đủ của tài liệu tại đây (1.13 MB, 36 trang )
Published for SISSA by
Springer
Received: May 7, 2012
Accepted: June 5, 2012
Published: June 25, 2012
The LHCb collaboration
Abstract: The production of J/ψ mesons accompanied by open charm, and of pairs of
open charm hadrons are observed in pp collisions at a centre-of-mass energy of 7 TeV
using an integrated luminosity of 355 pb−1 collected with the LHCb detector. Model
independent measurements of absolute cross-sections are given together with ratios to the
measured J/ψ and open charm cross-sections. The properties of these events are studied
and compared to theoretical predictions.
Keywords: Hadron-Hadron Scattering
ArXiv ePrint: 1205.0975
Open Access, Copyright CERN,
for the benefit of the LHCb collaboration
doi:10.1007/JHEP06(2012)141
JHEP06(2012)141
Observation of double charm production involving
√
open charm in pp collisions at s = 7 TeV
Contents
1
2 The LHCb detector and dataset
2
3 Event selection
4
4 Signal determination
7
5 Efficiency correction
9
6 Systematic uncertainties
13
7 Results
15
8 Properties of J/ψ C, CC, and CC events
21
9 Conclusion
27
A Contribution from sea charm quarks
27
The LHCb collaboration
31
1
Introduction
Due to the high energy and luminosity of the LHC, charm production studies can be carried
out in a new kinematic domain with unprecedented precision. As the cross-sections of open
charm [1] and charmonium [2] production are large, the question of multiple production of
these states in a single proton-proton collision naturally arises. Recently, studies of double
charmonium and charmonium with associated open charm production have been proposed
as probes of the quarkonium production mechanism [3]. In pp collisions, additional contributions from other mechanisms, such as Double Parton Scattering (DPS) [4–7] or the
intrinsic charm content of the proton [8] to the total cross-section, are possible, though
these constributions may not be mutually exclusive.
In this paper, both the production of J/ψ mesons together with an associated open
+ 1
charm hadron (either a D0 , D+ , D+
s or Λc ) and double open charm hadron production are
studied in pp collisions at a centre-of-mass energy of 7 TeV. We denote the former process
as J/ψ C and the latter as CC. In addition, as a control channel, c¯c events where two open
charm hadrons are reconstructed in the LHCb fiducial volume (denoted CC) are studied.
1
The inclusion of charge-conjugate modes is implied throughout this paper.
–1–
JHEP06(2012)141
1 Introduction
3 < pT
C < 12 GeV/c) are σ J/ψ C + J/ψ C ∼ 18 nb and σ CC + CC ∼ 100 nb, where
C stands for the open charm hadron. The predictions are summarized in table 1. These
LO αs4 perturbative QCD results are affected by uncertainties originating from the selection
of the scale for the αs calculation that can amount to a factor of two.
The DPS contribution can be estimated, neglecting partonic correlations in the proton,
as the product of the cross-sections of the sub-processes involved divided by an effective
cross-section [4–7]
1 σ (C1 ) × σ (C1 )
, for C1 = C2
DPS
2
σeff
σDPS (C1 C2 ) =
(1.1)
σ (C1 ) × σ (C2 )
, for C1 = C2 .
DPS
σeff
Using this equation and the measured single charm cross-sections given in [1, 2] together
DPS = 14.5 ±
with the effective cross-section measured in multi-jet events at the Tevatron σeff
1.7+1.7
−2.3 mb [16], the size of this contribution is estimated (see table 1). However, this
approach has been criticized as being too naive [17].
Extra charm particles in the event can originate from the sea charm quarks of the
interacting protons themselves. Estimates for the possible contribution in the fiducial
volume used here are given in the appendix and summarized in table 1. It should be stressed
that the charm parton density functions are not well known, nor are the pT distributions of
the resulting charm particles, so these calculations should be considered as upper estimates.
2
The LHCb detector and dataset
The LHCb detector [19] is a single-arm forward spectrometer covering the pseudorapidity
range 2 < η < 5, and is designed for the study of particles containing b or c quarks.
The detector includes a high precision tracking system consisting of a silicon-strip vertex
detector surrounding the proton-proton interaction region, a large-area silicon-strip detector located upstream of a dipole magnet with a bending power of about 4 Tm, and three
stations of silicon-strip detectors and straw drift tubes placed downstream. The combined
tracking system has a momentum resolution ∆p/p that varies from 0.4% at 5 GeV/c to 0.6%
at 100 GeV/c, and an impact parameter resolution of 20 µm for tracks with high transverse
momentum. Charged hadrons are identified using two ring-imaging Cherenkov (RICH)
–2–
JHEP06(2012)141
While the production of J/ψ C events have not been observed before in hadron interactions,
evidence for the production of four charmed particles in pion-nuclear interactions has been
reported by the WA75 collaboration [9].
Leading order (LO) calculations for the gg → J/ψ J/ψ process in perturbative QCD
exist and give consistent results [10–12]. In the LHCb fiducial region (2 < yJ/ψ < 4.5,
T
pT
J/ψ < 10 GeV/c), where yJ/ψ and pJ/ψ stand for rapidity and transverse momentum
respectively, the calculated J/ψ J/ψ production cross-section is 4.1±1.2 nb [12] in agreement
with the measured value of 5.1 ± 1.0 ± 1.1 nb [13]. Similar calculations for the gg → J/ψ c¯c
and gg → c¯cc¯c matrix elements exist [14, 15]. The calculated cross-sections for these
processes in the acceptance region considered here (2 < yJ/ψ , yC < 4, pT
J/ψ < 12 GeV/c,
Mode
σgg
[14, 15]
[18]
σDPS
σsea
[nb]
J/ψ D0
10 ± 6
7.4 ± 3.7
146 ± 39
220
J/ψ D+
5±3
2.6 ± 1.3
60 ± 17
100
J/ψ D+
s
J/ψ Λ+
c
1.0 ± 0.8
1.5 ± 0.7
24 ± 7
30
0.8 ± 0.5
0.9 ± 0.5
56 ± 22
[ µb]
2.0 ± 0.5
1.5
D0 D+
1.7 ± 0.4
1.4
D0 D+
s
D0 Λ+
c
D+ D+
0.65 ± 0.15
0.4
1.5 ± 0.5
D+ D+
s
D+ Λ+
c
0.34 ± 0.09
0.3
0.27 ± 0.07
0.2
0.64 ± 0.23
Table 1. Estimates for the production cross-sections of the J/ψ C and CC modes in the LHCb
fiducial range given by the leading order gg → J/ψ c¯c matrix element, σgg [14, 15, 18], the double
parton scattering approach, σDPS and the sea charm quarks from the interacting protons, σsea .
detectors. Photon, electron and hadron candidates are identified by a calorimeter system
consisting of scintillating-pad and pre-shower detectors, and electromagnetic and hadronic
calorimeters. Muons are identified by a muon system composed of alternating layers of
iron and multiwire proportional chambers. The trigger consists of a hardware stage based
on information from the calorimeter and muon systems, followed by a software stage which
applies a full event reconstruction.
Events with a J/ψ → µ+ µ− final state are triggered using two hardware trigger decisions: the single-muon decision, which requires one muon candidate with a transverse momentum pT larger than 1.5 GeV/c, and the di-muon decision, which requires two muon canT
T
didates with transverse momenta pT
pT
1 and p2 satisfying the relation
1 · p2 > 1.3 GeV/c.
The di-muon trigger decision in the software trigger requires muon pairs of opposite
charge with pT > 500 MeV/c, forming a common vertex and with an invariant mass
2.97 < mµ+ µ− < 3.21 GeV/c2 . Events with purely hadronic final states are accepted by
the hardware trigger if there is a calorimeter cluster with transverse energy E T > 3.6 GeV.
The software trigger decisions select generic displaced vertices from tracks with large χ2 of
impact parameter with respect to all primary pp interaction vertices in the event, providing
high efficiency for purely hadronic decays [20].
To prevent a few events with high occupancy from dominating the CPU time in the
software trigger, a set of global event cuts is applied on the hit multiplicities of each subdetector used by the pattern recognition algorithms. These cuts were chosen to reject
events with a large number of pile-up interactions with minimal loss of data.
–3–
JHEP06(2012)141
D0 D0
The data used for this analysis comprises 355 ± 13 pb−1 of pp collisions at a centre-of√
mass energy of s = 7 TeV collected by the LHCb experiment in the first half of the 2011
data-taking period. Simulation samples used are based on the Pythia 6.4 generator [21]
configured with the parameters detailed in ref. [22]. The EvtGen [23] and Geant4 [24]
packages are used to describe hadron decays and for the detector simulation, respectively.
The prompt charmonium production is simulated in Pythia according to the leading-order
colour-singlet and colour-octet mechanisms.
3
Event selection
–4–
JHEP06(2012)141
+
To select events containing multiple charm hadrons, first J/ψ , D0 , D+ , D+
s and Λc candidates are formed from charged tracks reconstructed in the spectrometer. Subsequently,
these candidates are combined to form J/ψ C, CC and CC candidates.
Well reconstructed tracks are selected for these studies by requiring that the χ2tr provided by the track fit satisfy χ2tr /ndf < 5, where ndf represents the number of degrees of
freedom in the fit, and that the transverse momentum is greater than 650 (250) MeV/c
for each muon (hadron) candidate. For each track, the global likelihoods of the muon and
hadron hypotheses provided by reconstruction of the muon system are evaluated, and well
identified muons are selected by a requirement on the difference in likelihoods ∆ ln Lµ/h > 0.
Good quality particle identification by the ring-imaging Cherenkov detectors is ensured
by requiring the momentum of the hadron candidate to be between 3.2 GeV/c (10 GeV/c
for protons) and 100 GeV/c, and the pseudorapidity to be in the range 2 < η < 5. To
select kaons (pions) the corresponding difference in logarithms of the global likelihood
of the kaon (pion) hypothesis provided by the RICH system with respect to the pion
(kaon) hypothesis, ∆ ln LK/π (∆ ln Lπ/K ), is required to be greater than 2. For protons,
the differences in logarithms of the global likelihood of the proton hypothesis provided
by the RICH system with respect to the pion and kaon hypotheses, are required to be
∆ ln Lp/π > 10 and ∆ ln Lp/K > 10, respectively.
Pions, kaons and protons, used for the reconstruction of long-lived charm particles, are
required to be inconsistent with being produced in a pp interaction vertex. Only particles
with a minimal value of impact parameter χ2 with respect to any reconstructed protonproton collision vertex χ2IP > 9, are considered for subsequent analysis. These selection
criteria are summarized in table 2.
The selected charged particles are combined to form J/ψ → µ+ µ− , D0 → K− π+ ,
− + +
+
− +
D+ → K− π+ π+ , D+
s → K K π and Λc → pK π candidates. A vertex fit is made to
all combinations and a selection criterion on the corresponding χ2VX applied. The transverse
momentum, pT , for open charm hadron candidates is required to be larger than 3 GeV/c.
To ensure that the long-lived charm particle originates from a primary vertex, the minimal
value of the charm particle’s χ2IP with respect to any of the reconstructed proton-proton
collision vertices is required to be < 9. In addition, the decay time cτ of long-lived charm
mesons is required to be in excess of 100 µm, and in the range 100 < cτ < 500 µm for
+
Λ+
c candidates. To suppress the higher combinatorial background for Λc candidates, only
pions, kaons and protons with a transverse momentum in excess of 0.5 GeV/c are used in
this case.
Track selection
µ± , h±
χ2tr /ndf < 5
µ±
pT > 650 MeV/c
h±
pT > 250 MeV/c & 2 < η < 5 & χ2IP > 9
π± , K±
3.2 < p < 100 GeV/c
p±
10 < p < 100 GeV/c
Particle identification
∆ ln Lµ/h > 0
π±
∆ ln Lπ/K > 2
K±
∆ ln LK/π > 2
p, p
¯
∆ ln Lp/K > 10 & ∆ ln Lp/π > 10
Table 2. Selection criteria for charged particles used for the reconstruction of charm hadrons.
y
pT
χ2VX
χ2IP
χ2fit /ndf
[GeV/c]
J/ψ
µ+ µ−
D0
K− π +
D+
K− π+ π+
D+
s
(K+ K− )φ π+
Λ+
c
pK− π+
2
< 20
—
<5
2
<9
<9
<5
2
< 25
<9
<5
2
< 25
<9
<5
2
< 25
<9
<5
cτ > 100
cτ < 500
—
—
> 0.5
cτ
[ µm]
—
cτ > 100
cτ > 100
cτ > 100
|cos θ∗ |
mK+ K−
min pT
h±
GeV/c2
[GeV/c]
—
—
—
< 0.9
—
—
—
—
—
—
< 1.04
—
Table 3. Criteria used for the selection of charm hadrons.
A global decay chain fit of the selected candidates is performed [25]. For channels
containing a J/ψ meson it is required that the muons be consistent with originating from
a common vertex and that this be compatible with one of the reconstructed pp collision
vertices. In the case of long-lived charm hadrons, the momentum direction is required to
be consistent with the flight direction calculated from the locations of the primary and
secondary vertices. To remove background from b-hadron decays the reduced χ2 of this
fit, χ2fit /ndf, is required to be < 5. To further reduce the combinatorial background as well
as cross-feed due to particle misidentification, for the decay mode D0 → K− π+ a selection
criterion on the cosine of the angle between the kaon momentum in the D0 centre-of-mass
+ − +
frame and the D0 flight direction in the laboratory frame, θ∗ is applied. For D+
s →K K π
candidates, the invariant mass of the K+ K− system is required to be consistent with the
φ meson mass. These selection criteria are summarized in table 3.
–5–
JHEP06(2012)141
µ±
LHCb
106
dN
dmµ+ µ−
1
1 MeV/c2
J/ψ → µ+ µ−
3
3.05
3.1
mµ+ µ−
3.15
3.2
GeV/c2
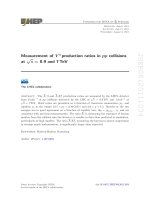
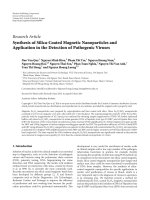
Figure 1. Invariant mass distribution for selected J/ψ candidates. The results of a fit to the model
described in the text is superimposed on a logarithmic scale. The solid line corresponds to the total
fitted PDF whilst the dotted line corresponds to the background component.
J/ψ
D0
D+
D+
s
Λ+
c
µ+ µ−
K− π+
K− π+ π+
(K+ K− )φ π+
pK− π+
S
106
49.57
65.77
33.25
3.59
0.637
fbMC
[%]
1.6
1.7
1.3
2.6
4.5
Table 4. Yields, S, and contamination from b-hadron decays, fbMC , for the prompt charm signal.
+
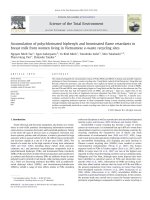
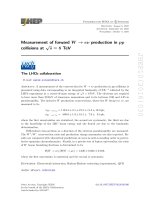
The invariant mass distributions for selected J/ψ , D0 , D+ , D+
s and Λc candidates are
presented in figures 1 and 2 for J/ψ and open charm mesons, respectively. The distributions are modelled by a double-sided Crystal Ball function [13, 26] for the J/ψ → µ+ µ− ,
and a modified Novosibirsk function [27] for the D0 → K− π+ , D+ → K− π+ π+ and
+ − +
+
− +
D+
s → K K π and Λc → pK π signals. In each case the combinatorial background
component is modelled with an exponential function. The signal yields are summarized in
table 4 together with an estimate of the contamination from the decays of b hadrons, fbMC .
The latter has been estimated using simulated events, normalized to the corresponding
measured cross-sections.
The selected charm candidates are paired to form di-charm candidates: J/ψ C, CC and
CC. A global fit of the di-charm candidates is performed [25], similar to that described
above for single charm hadrons, which requires both hadrons to be consistent with originating from a common vertex. The reduced χ2 of this fit, χ2global /ndf, is required to be less
than 5. This reduces the background from the pile-up of two interactions each producing
a charm hadron to a negligible level. The remaining contamination from the pile-up and
decays from beauty hadrons is extracted directly from the data as follows. The distribu-
–6–
JHEP06(2012)141
105
3
3
3500
3000
2000 ×10
a)
1
1 MeV/c2
1
1 MeV/c2
4000 ×10
D0 → K− π+
LHCb
dN
dmKππ
dN
dmKπ
2500
2000
1500
1200
1000
800
600
400
200
250 ×10
1.88
0
1.82
1.9
1.92
2
GeV/c
mK− π+
1.86
1.88
1.9
GeV/c2
60000
+ − +
D+
s →K K π
c)
LHCb
150
100
50000
30000
− +
Λ+
c → pK π
d)
LHCb
40000
20000
50
0
1.9
1.84
mK− π+ π+
1
1 MeV/c2
3
1.86
dN
dmpKπ
1.84
10000
1.95
m(K+ K− )φ π+
0
2.24
2
2.26
GeV/c2
2.28
mpK− π+
2.3
2.32
GeV/c2
+
Figure 2. Invariant mass distributions for selected a) D0 , b) D+ , c) D+
s and d) Λc candidates.
The solid line corresponds to the total fitted PDF whilst the dotted line shows the background
component.
0
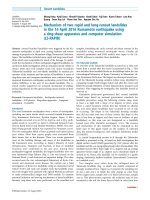
tions of χ2global /ndf for J/ψ D0 , D0 D0 and D0 D events are shown in figure 3. For the region
χ2global /ndf > 5 the distributions are well described by functions of the form2
n
f (x) ∝ (αx) 2 −1 e−
αx
2
,
(3.1)
where α and n are free parameters. Fits with this functional form are used to extrapolate
the yield in the region χ2global /ndf > 5 to the region χ2global /ndf < 5. Based on these studies
we conclude that background from pile-up is negligible.
The mass distributions for all pairs after these criteria are applied are shown in figures 4
to 8 for channels with sufficiently large data samples.
4
Signal determination
The event yields are determined using unbinned extended maximum likelihood fits to the
mass distributions of the di-charm sample. The fit model is based on the probability
2
The functional form is inspired by the χ2 distribution.
–7–
JHEP06(2012)141
0
1.82
1
1 MeV/c2
LHCb
1400
500
dN
dmKKπ
b)
1600
1000
200
D+ → K− π+ π+
1800
Candidates
Candidates
104
a)
3
10
LHCb
102
104
b)
3
10
102
10
10
1
1
0
2
4
log10 χ2global /ndf
6
0
● D0 D
D0 D0
10-1
-2
0
2
4
6
log10 χ2global /ndf
Figure 3. a) Background subtracted distribution of log10 χ2global /ndf for J/ψ D0 events. The solid
line corresponds to the fit result in the region χ2global /ndf > 5 by the function described in the text,
the dashed line corresponds to the extrapolation of the fit results to the χ2global /ndf < 5 region.
0
b) Likewise for D0 D0 (blue squares and red line) and D0 D (black circles and green line).
density functions (PDFs) for single open or hidden charm production described in section 3.
These basic PDFs are used to build the components of the two dimensional mass fit. Let
i and j denote the two resonance species. The reconstructed signal samples consist of the
following components:
• Di-charm signal. This is modelled by a product PDF of the individual signal components for the first and the second particle.
• Combinatorial background. This is modelled by a product PDF of the individual
background components i and j denoted by Bi (mi ) and Bj (mj ).
• Single production of component i together with combinatorial background for component j. This is modelled by a product PDF of the signal component i denoted
Si (mi ) and the background component j denoted Bj (mj ).
• Single production of component j together with combinatorial background for component i. This is modelled by a product PDF of the signal component j denoted
Sj (mj ) and the background component i denoted Bi (mi ).
The total PDF is then
F (mi , mj ) ∝ N Si ×Sj × Si (mi )Sj (mj ) + N Si ×Bj × Si (mi )Bj (mj )
+N Bi ×Sj × Bi (mi )Sj (mj ) + N Bi ×Bj × Bi (mi )Bj (mj ),
(4.1)
where N Si ×Sj , N Si ×Bj , N Bi ×Sj and N Bi ×Bj are the yields of the four components described
above. The correctness of the fitting procedure is evaluated in simulation studies. As
discussed in section 3 both the contribution of pile-up background and b-hadron decays
is small and can be neglected. The goodness of fit is found to be acceptable using the
distance to the nearest neighbour method described in refs. [28, 29].
–8–
JHEP06(2012)141
-2
LHCb
LHCb
a)
400
Candidates
Candidates
LHCb
300
200
100
0
1.92
3.15
3.1
3.05
−
c2
GeV/
1.9
1.88
Kπ
1.86
π
Ge 1.841.82
3
V
20
0
Ge
V/ 1.9
c2
3
3.15
3.1
3.05
−
−
3.2
2
c
GeV/
m µ+ µ
3.2
2
c
GeV/
m µ+ µ
d)
15
10
5
0
2.32
1.95
3.15
3.1
LHCb
c)
2
3.05
/c 2
Candidates
Candidates
100
m
3.2
40
π
200
m µ+ µ
LHCb
KK
300
0
1.92
c2
m
400
m
2.3
pK 2.28
π
2.26
Ge
V/
2.24 3
c2
3.05
3.15
3.1
−
3.2
c2
GeV/
m µ+ µ
+
Figure 4. Invariant mass distributions for a) J/ψ D0 , b) J/ψ D+ , c) J/ψ D+
s and d) J/ψ Λc candidates.
As a cross-check of the results, the signal yields have been determined from the single
charm hadron mass spectra using the technique described in ref. [13]. In this approach, for
each pair of charm species the invariant mass distributions of the first charm candidate are
fitted to obtain the yield in bins of the invariant mass of the second candidate and vice versa.
This technique gives signal yields consistent within 10% of the statistical uncertainty and
also allows the statistical significance of the result to be easily evaluated. This exceeds five
standard deviations for most of the modes considered. The signal yields for J/ψ C, CC and
CC events are presented in tables 5 and 6 together with the estimate of the goodness of fit.
5
Efficiency correction
The yields are corrected for the detection efficiency to obtain the measured cross-sections.
The efficiency for J/ψ C, CC and CC events εtot is computed for each signal event and is
decomposed into three factors
εtot = εreco × εID × εtrg ,
–9–
(5.1)
JHEP06(2012)141
1.9
m 1.88
Kπ
1.86
Ge 1.84
V/ 1.82 3
b)
LHCb
LHCb
a)
b)
Candidates
Candidates
100
60
40
20
0
1.92
/c 2
0
1.9
1.84
1.88
1.86
2
10
5
0
KK
2
π
Ge
V/
1.91.82
c2
1.84
1.88
1.86
m Kπ
1.9
1.86
m Kπ
1.92
c2
GeV/
1.92
1.9
2
c
GeV/
d)
6
4
2
0
2.32
1.95
1.84
1.88
LHCb
c)
15
m
1.84
Ge 1.82
1.82
V/
c2
Candidates
Candidates
LHCb
1.88
Kπ 1.86
π
c
GeV/
m Kπ
m
1.92
1.9
m
2.3
pK 2.28
π
2.26
Ge
V
2.241.82
/c 2
1.84
1.86
m Kπ
1.88
1.9
1.92
2
c
GeV/
Figure 5. Invariant mass distributions for D0 C candidates: a) D0 D0 , b) D0 D+ , c) D0 D+
s and
d) D0 Λ+
.
c
Mode
S
J/ψ D0
4875 ± 86
59
J/ψ D+
3323 ± 71
26
J/ψ D+
s
+
J/ψ Λc
328 ± 22
65
116 ± 14
Sσ
P [%]
7.3σ
98
Table 5. Yields of J/ψ C events, S, statistical significance of the signals, Sσ , determined from fits
based on the technique described in ref. [13], and goodness-of-fit characteristic (χ2 probability), P .
When no significance is quoted, it is in excess of 8σ.
where εreco is the efficiency for acceptance, reconstruction and selection, εID is the efficiency
for particle identification and εtrg is the trigger efficiency. The first term in eq. (5.1), εreco
is factorized into the product of efficiencies for the first and second charm particle and a
correction factor
εreco = εreco
× εreco
× ξ trk ,
1
2
– 10 –
(5.2)
JHEP06(2012)141
1.9
m 1.88
Kπ
1.86
Ge 1.84
V 1.821.82
50
LHCb
LHCb
a)
b)
Candidates
Candidates
10
20
10
0
1.9
m
5
0
1.88
Ge
V/ 1.821.82
c2
1.84
1.86
m Kππ
1.88
m
1.9
2
KK
π
2
c
GeV/
1.95
Ge
V/
1.91.82
c2
LHCb
1.84
1.86
m Kππ
1.88
1.9
2
c
GeV/
c)
Candidates
3
2
1
0
2.32
m
pK
2.3
π
2.28
Ge 2.26 2.24
1.82
V/
c2
1.84
1.86
m Kππ
1.88
1.9
c2
GeV/
+ +
Figure 6. Invariant mass distributions for D+ C candidates: a) D+ D+ , b) D+ D+
s , and c) D Λc .
3
where the efficiencies εreco
(1,2) are evaluated using the simulation, and the correction factor
ξ trk is determined from the J/ψ data using a tag-and-probe method and accounts for relative
differences in the track reconstruction efficiency between data and simulation.
The efficiency εreco
is determined using the simulation in bins of rapidity y and transi
T
verse momentum p of the charm hadron. In the case of the J/ψ meson, the effect of the
∗ |, where θ ∗
unknown polarization on the efficiency is accounted for by binning in | cos θJ/ψ
J/ψ
is the angle between the µ+ momentum in the J/ψ centre-of-mass frame and the J/ψ flight
direction in the laboratory frame.
The efficiency for hadron identification as a function of momentum and pseudorapidity
is determined from the data using samples of D∗+ → D0 → K− π + π + , and Λ → pπ − [30,
31]. The efficiency for dimuon identification, εID
J/ψ is obtained from the analysis of the
+
−
J/ψ → µ µ sample as a function of transverse momentum and rapidity of the J/ψ .
For the J/ψ C sample the J/ψ particle is required to trigger the event whilst for the
CC and CC case either of the two charm mesons could trigger the event. The trigger
efficiency for the di-charm system in the two cases is thus
trg
εtrg
J/ψ C = εJ/ψ
εtrg
CC,CC
3
(5.3a)
= 1 − (1 −
εtrg
C1 )
× (1 −
This is the product of the individual corrections for each track.
– 11 –
εtrg
C2 ).
(5.3b)
JHEP06(2012)141
Kπ 1.86
π
1.84
LHCb
LHCb
a)
b)
Candidates
Candidates
400
300
200
100
0
1.92
/c 2
200
0
1.9
1.84
1.86
m Kπ
1.88
1.88
Kπ 1.86
π
2
c
GeV/
LHCb
m
1.92
1.9
1.84
Ge 1.82
1.82
V/
c2
1.84
1.86
m Kπ
1.88
2
c
GeV/
LHCb
c)
1.92
1.9
d)
Candidates
Candidates
80
60
40
20
0
m
KK
10
0
2.32
2
π
20
1.95
Ge
V/
1.91.82
c2
1.84
1.86
m Kπ
1.88
1.9
m
1.92
2.3
pK 2.28
π
2.26
c2
GeV/
Ge
V
2.241.82
/c 2
1.84
1.86
m Kπ
1.88
1.9
1.92
2
c
GeV/
0
¯ candidates: a) D0 D , b) D0 D− , c) D0 D−
Figure 7. Invariant mass distributions for D0 C
s and
0 ¯−
d) D Λc .
trg
In both cases the trigger efficiency for a single charm hadron εtrg
J/ψ or εC is determined
directly from the data using the inclusive prompt charm sample as a function of y and
pT . This is done using a method that exploits the fact that events with prompt charm
hadrons can be triggered either by the decay products of the charm hadron, or by the rest
of the event [13, 32]. The overlap between the two cases allows the trigger efficiency to
be estimated.
As discussed in section 2, global event cuts are applied in the trigger on the sub-detector
hit multiplicites to reject complex events. The efficiency of these cuts εGEC is studied using
the distributions of hit multiplicity after background subtraction. These distributions have
been extrapolated from the regions unaffected by the cuts into the potentially affected
regions and compared with the observed distributions in order to determine εGEC .
The efficiency-corrected signal yield N corr is determined using the s Plot [33] technique.
Each candidate is given a weight for it to be signal, ωi , based on the result of the fit to
the mass distributions described before. The weight is then divided by the total event
efficiency and summed to give the efficiency-corrected yield
ωi
N corr =
.
(5.4)
εtot
i
i
– 12 –
JHEP06(2012)141
1.9
m 1.88
Kπ
1.86
Ge 1.84
V 1.821.82
400
100
50
0
1.9
m
b)
40
30
20
10
0
1.88
1.84
Ge
V
1.821.82
1.86
1.84
/c 2
m Kππ
1.88
m
1.9
2
KK
π
c2
GeV/
1.95
Ge
V/
1.91.82
c2
LHCb
1.84
1.86
m Kππ
1.88
1.9
2
c
GeV/
c)
10
5
0
2.32
m
2.3
pK 2.28
π
2.26
Ge
V/
2.241.82
c2
1.86
1.84
m Kππ
1.88
1.9
c2
GeV/
+ ¯−
Figure 8. Invariant mass distributions for CC candidates: a) D+ D− , b) D+ D−
s and c) D Λc .
In the case of the D0 C and D0 C final states the corresponding yields have been corrected to take into account the double Cabibbo-suppressed decay (DCS) mode D0 → K+ π − ,
which mixes the D0 C and D0 C reconstructed final states
ND0 C
ND0 C¯
=√
1
1 − r2
1 −r
−r 1
×
NDcorr
0C
NDcorr
0C
¯
,
(5.5)
Γ D0 → K+ π −
= (3.80 ± 0.18)×10−3 [34]. This value of rDCS accounts
Γ (D0 → K− π + )
0
0
also for the effect of D0 -D mixing. For the D0 D0 and D0 D cases the value of r = 2rDCS
is used.
where r is rDCS =
6
Systematic uncertainties
The sources of systematic uncertainty that enter into the cross-section determination in
addition to those related to the knowledge of branching ratios and luminosity are discussed
below. The dominant source of systematic uncertainty arises from possible differences in
the track reconstruction efficiency between data and simulation which are not accounted
– 13 –
JHEP06(2012)141
Kπ 1.86
π
Candidates
LHCb
a)
Candidates
Candidates
LHCb
Mode
S
D0 D0
1087 ± 37
4.5
D0 D
10080 ± 105
33
D0 D+
1177 ± 39
24
D0 D−
11224 ± 112
36
D0 D+
s
111 ± 12
D0 D−
s
859 ± 31
D0 Λ+
c
41 ± 8
¯−
D0 Λ
c
308 ± 19
35
D+ D+
249 ± 19
15
D+ D−
3236 ± 61
67
D+ D+
s
52 ± 9
D+ D−
s
419 ± 22
D+ Λ+
c
21 ± 5
2.5σ
36
¯−
D+ Λ
c
137 ± 14
8σ
7
0
Sσ
8σ
P [%]
10
13
5σ
9
54
59
Table 6. Yields of CC and CC events, S, statistical significance of the signals, Sσ , determined
from fits based on the technique, described in ref. [13], and goodness-of-fit characteristic, P . When
no significance is quoted, it is in excess of 8σ.
for in the per-event efficiency. This includes the knowledge of the hadronic interaction
length of the detector which results in an uncertainty of 2% per final state hadron [32].
An additional uncertainty is due to the statistical uncertainty on the determination of the
per-event efficiency due to the finite size of the simulation and calibration samples. This is
estimated by varying the obtained efficiencies within their corresponding uncertainties. The
unknown polarization of J/ψ mesons affects the acceptance, reconstruction and selection
efficiency εreco
J/ψ [2]. In this analysis the effect is reduced by explicitly taking into account the
∗
dependence of εreco
J/ψ on | cos θJ/ψ | in the efficiency determination. The remaining dependence
results in a systematic uncertainty of 3% for channels containing a J/ψ .
Additional uncertainties are due to differences between data and simulation, uncertainty on the global event cuts, knowledge of the branching fractions of charm hadrons,
Bi . Uncertainties due to the parameterization of the signal and background components
are found to be negligible.
The absolute luminosity scale was measured at specific periods during the data taking,
using both van der Meer scans [35] where colliding beams are moved transversely across
each other to determine the beam profile, and a beam-gas imaging method [36, 37]. For the
latter, reconstructed beam-gas interaction vertices near the beam crossing point determine
the beam profile. The knowledge of the absolute luminosity scale is used to calibrate the
– 14 –
JHEP06(2012)141
5σ
Source
J/ψ D0
J/ψ D+
J/ψ D+
s
J/ψ Λ+
c
εreco
1
1.3
1.3
1.3
1.3
C reconstruction
εreco
2
0.7
0.8
1.7
3.3
Muon ID
εID
J/ψ
1.1
1.1
1.1
1.1
Hadron ID
εID
had
1.1
1.9
1.1
1.5
Tracking
ξ trk
4.9
7.0
7.0
7.0
Trigger
εtrg
J/ψ C
3.0
3.0
3.0
3.0
J/ψ polarization
εreco
J/ψ
3.0
3.0
3.0
3.0
Global event cuts
εGEC
0.7
0.7
0.7
0.7
Luminosity
L
3.7
3.7
3.7
3.7
B(J/ψ → µ+ µ− )
B1
1.0
1.0
1.0
1.0
C branching fractions
B2
1.3
4.3
6.0
26
8
10
11
28
Total
Table 7. Relative systematic uncertainties (%) for the J/ψ C cross-sections.
number of tracks in the silicon-strip vertex detector, which is found to be stable throughout
the data-taking period and can therefore be used to monitor the instantaneous luminosity
of the entire data sample. The dataset for this analysis corresponds to an integrated
luminosity of 355 ± 13 pb−1 .
The sources of systematic uncertainty on the J/ψ C production cross-section measurements are summarized in table 7 and those for open charm in tables 8 and 9.
The total systematic uncertainties have been evaluated taking correlations into account
where appropriate.
7
Results
The model-independent cross-section for double charm production in the fiducial range is
computed as
N corr
σ=
,
(7.1)
L × B1 × B2 × εGEC
where L is the integrated luminosity obtained as described in section 6, B(1,2) stand for the
corresponding branching ratios, εGEC is the efficiency of the global event cuts, and N corr is
the efficiency-corrected event yield, calculated according to eq. (5.4). The branching ratios
used for these calculations are taken from ref. [34].
The cross-sections for the production of J/ψ and associated open charm, σJ/ψ C , are
T
measured in the fiducial volume 2 < yJ/ψ , yC < 4, pT
J/ψ < 12 GeV/c, 3 < pC < 12 GeV/c.
The results are summarized in table 10 and figure 9.
– 15 –
JHEP06(2012)141
J/ψ reconstruction
Source
D0 D0
D0 D+
D0 D+
s
D0 Λ +
c
εreco
× εreco
1
2
1.4
1.4
2.3
3.6
Hadron ID
εID
had
1.2
1.8
1.6
2.4
Tracking
ξ trk
8.5
10.7
10.6
10.6
Trigger
εtrg
CC,CC
1.8
2.5
3.9
5.2
Global event cuts
εGEC
1.0
1.0
1.0
1.0
Luminosity
L
3.7
3.7
3.7
3.7
B(D0 → K− π + )
B1
1.3
1.3
1.3
1.3
C branching fractions
B2
1.3
4.3
6.0
26
10
12
14
30
Total
Table 8. Relative systematic uncertainties (%) for the D0 C cross-sections. The uncertainties for
CC and CC are equal.
Source
D+ D+
D+ D+
s
D+ Λ +
c
D+ C reconstruction
εreco
× εreco
1
2
1.4
2.2
4.0
Hadron ID
εID
had
2.3
2.4
3.0
Tracking
ξ trk
12.8
12.8
12.8
Trigger
εtrg
CC,CC
3.7
5.8
5.0
Global event cuts
εGEC
1.0
1.0
1.0
Luminosity
L
3.7
3.7
3.7
B(D+ → K− π + π + )
B1
4.3
4.3
4.3
C branching fractions
B2
4.3
6.0
26
17
17
31
Total
Table 9. Relative systematic uncertainties (%) for the D+ C cross-sections. The uncertainties for
the CC and CC are equal.
The systematic uncertainties related to the reconstruction and trigger are reduced if
ratios to the cross-sections for prompt J/ψ , σJ/ψ , and prompt open charm production,
σC , with the same fiducial requirements are considered (taking into account correlated
uncertainties) [1, 2]. These ratios are presented in table 11.
The cross-sections for CC and CC events in the fiducial volume 2 < yC < 4, 3 < pT
C <
12 GeV/c are measured and listed in table 12 and figure 9. The table also includes the
ratio of CC and CC production cross-sections, σCC /σCC , and the ratios of the product of
the prompt open charm cross-sections to the CC (CC) cross-sections, σC1 σC2 /σC1 C2 .
– 16 –
JHEP06(2012)141
D0 C reconstruction
Mode
σ [nb]
J/ψ D0
161.0 ± 3.7 ± 12.2
J/ψ D+
56.6 ± 1.7 ± 5.9
J/ψ D+
s
J/ψ Λ+
c
30.5 ± 2.6 ± 3.4
43.2 ± 7.0 ± 12.0
Table 10. Production cross-sections for J/ψ C. The first uncertainty is statistical, and the second
is systematic.
10−3
σJ/ψ C /σC 10−4
σJ/ψ σC /σJ/ψ C [mb]
J/ψ D0
16.2 ± 0.4 ±
6.7 ± 0.2 ± 0.5
14.9 ± 0.4 ± 1.1+2.3
−3.1
J/ψ D+
5.7 ± 0.2 ±
5.7 ± 0.2 ± 0.4
17.6 ± 0.6 ± 1.3+2.8
−3.7
J/ψ D+
s
3.1 ± 0.3 ±
7.8 ± 0.8 ± 0.6
12.8 ± 1.3 ± 1.1+2.0
−2.7
J/ψ Λ+
c
4.3 ± 0.7 ±
1.3+3.4
−2.5
0.6+1.2
−0.9
0.4+0.6
−0.5
1.2+0.9
−0.7
5.5 ± 1.0 ± 0.6
18.0 ± 3.3 ± 2.1+2.8
−3.8
Table 11. Ratios of J/ψ C production cross-section to prompt J/ψ cross-section and prompt open
charm cross-section, and ratios of the product of prompt J/ψ and open charm cross-sections to the
J/ψ C cross-section. The first uncertainty is statistical, the second is systematic, and the third is
due to the unknown polarization of the prompt J/ψ [2].
Several of the estimations given in table 1 are also shown in figure 9 to compare
with our measurements. The expectations from gluon-gluon fusion processes [14, 15, 18]
are significantly below the measured cross-sections while the DPS estimates qualitatively
agree with them. The observed ratio of CC/CC events is relatively large, e.g. compared
with σJ/ψ J/ψ /σJ/ψ = (5.1 ± 1.0 ± 1.1) × 10−4 [13].
For the ratios σJ/ψ σC /σJ/ψ C and σC1 σC2 /σC1 C2 listed in tables 11 and 12, the systematic uncertainties largely cancel. In addition, theoretical inputs such as the choice of the
strong coupling constant and the charm quark fragmentation fractions should cancel allowing a more reliable comparison between theory and data. For the J/ψ C and CC cases these
ratios have a clear interpretation in the DPS approach [4–6] as the effective cross-section of
eq. (1.1) which should be the same for all modes. For the CC case, neglecting the contribution from c¯cc¯c production, this ratio is related by a model-dependent kinematical factor to
the total charm production cross-section and should be independent of the final state under consideration. The values for the effective DPS cross-section (the right-hand column in
table 11, and figure 10) calculated from the J/ψ C cross-section are in good agreement with
DPS = 14.5 ± 1.7+1.7 mb [16].
the value measured in multi-jet production at the Tevatron σeff
−2.3
The effective cross-section extracted from the CC measurements is higher than this by a
factor of typically two to three.
– 17 –
JHEP06(2012)141
σJ/ψ C /σJ/ψ
Mode
σ [nb]
D0 D0
690 ± 40 ± 70
D0 D
0
σCC /σCC [%]
10.9 ± 0.8
6230 ± 120 ± 630
D0 D+
520 ± 80 ± 70
D0 D−
3990 ± 90 ± 500
D0 D+
s
270 ± 50 ± 40
D0 D−
s
1680 ± 110 ± 240
¯−
D0 Λ
c
2010 ± 280 ± 600
D+ D+
80 ± 10 ± 10
D+ D−
780 ± 40 ± 130
D+ D+
s
70 ± 15 ± 10
D+ D−
s
550 ± 60 ± 90
D+ Λ+
c
60 ± 30 ± 20
¯−
D+ Λ
c
530 ± 130 ± 170
σC1 σC2 /σC1 C2 [mb]
2 × (42 ± 3 ± 4)
2 × (4.7 ± 0.1 ± 0.4)
12.8 ± 2.1
47 ± 7 ± 4
6.0 ± 0.2 ± 0.5
15.7 ± 3.4
36 ± 8 ± 4
5.6 ± 0.5 ± 0.6
—
9.6 ± 1.6
9± 2 ±1
2 × (66 ± 11 ± 7)
2 × (6.4 ± 0.4 ± 0.7)
12.1 ± 3.3
59 ± 15 ± 6
7± 1 ±1
10.7 ± 5.9
140 ± 70 ± 20
15 ± 4 ± 2
Table 12. Production cross-sections for CC and CC, ratios of the CC and CC cross-sections and
ratios of the product of prompt open charm cross-sections to the CC (CC) cross-sections. The first
uncertainty is statistical and the second is systematic. The symmetry factor 2 is explicitly indicated
0
for the D0 D0 , D0 D , D+ D+ and D+ D− ratios.
– 18 –
JHEP06(2012)141
Mode
0
D0 D
LHCb
D0 D−
JHEP06(2012)141
D0 D−
s
0
−
¯
D Λc
D+ D−
D+ D−
s
¯−
D+ Λ
c
D0 D0
D0 D+
D0 D+
s
D+ D+
D+ D+
s
D+ Λ+
c
J/ψ D0
J/ψ D+
J/ψ D+
s
J/ψ Λ+
c
10-1
1
102
10
σ
103
104
[nb]
Figure 9. Measured cross-sections σJ/ψ C , σCC and σCC (points with error bars) compared, in
J/ψ C channels, to the calculations in refs. [14, 15] (hatched areas) and ref. [18] (shaded areas). The
inner error bars indicate the statistical uncertainty whilst the outer error bars indicate the sum of
the statistical and systematic uncertainties in quadrature. Charge-conjugate modes are included.
– 19 –
0
D0 D ×
1
2
LHCb
D0 D−
D0 D−
s
¯−
D0 Λ
×
JHEP06(2012)141
c
+
D D−
1
2
D+ D−
s
+
−
¯c
D Λ
D0 D0 ×
1
2
D0 D+
D0 D+
s
D+ D+ ×
1
2
D+ D+
s
D+ Λ +
c
J/ψ D0
J/ψ D+
J/ψ D+
s
J/ψ Λ+
c
102
10
σC1 σC2
σC1 C2
[mb]
Figure 10. Measured ratios σC1 σC2 /σC1 C2 (points with error bars) in comparison with the expectations from DPS using the cross-section measured at Tevatron for multi-jet events (light green
0
shaded area). For the D0 D0 , D0 D , D+ D+ and D+ D− cases the ratios are rescaled with the symmetry factor of one half. The inner error bars indicate the statistical uncertainty whilst the outer
error bars indicate the sum of the statistical and systematic uncertainties in quadrature. For the
J/ψ C case the outermost error bars correspond to the total uncertainties including the uncertainties
due to the unknown polarization of the prompt J/ψ mesons. Charge-conjugate modes are included.
– 20 –
1
500 MeV/c
LHCb
d ln σ
dpT
C
1
500 MeV/c
d ln σ
dpT
J/ψ
a)
10-1
10-2
10-3
J/ψ D0 ❍ J/ψ
J/ψ D+
J/ψ D+
s
J/ψ Λ+
c
10
10-2
10-3
5
pT
J/ψ
LHCb
●
■
▲
▼
10-4
10
[GeV/c]
J/ψ D0
J/ψ D+
J/ψ D+
s
J/ψ Λ+
c
D0
D+
D+
s
4
6
8
pT
C
10
12
[GeV/c]
Figure 11. a) Transverse momentum spectra of J/ψ for J/ψ C and prompt J/ψ events. b) Transverse
momentum spectra for open charm hadrons for J/ψ C and prompt D0 , D+ and D+
s events.
8
Properties of J/ψ C, CC, and CC events
The data samples available also allow the properties of the multiple charm events to be
studied. The transverse momentum spectra for J/ψ and open charm mesons in J/ψ C events
are presented in figure 11.
The transverse momentum spectra of the J/ψ meson in J/ψ C events are similar for all
species of open charm hadrons. The shape of the transverse momentum spectra of open
charm hadrons also appears to be the same for all species. The pT
J/ψ spectra are harder than
T
the corresponding spectrum of prompt J/ψ , while the p -spectra for open charm hadrons
seem to be well compatible in shape with the spectra for prompt charm production. To
allow a more quantitative comparison, each spectrum is fitted in the region 3 < pT <
12 GeV/c with an exponential function. The results are summarized in table 13 and
figure 14. They agree reasonably well within the uncertainties. The transverse momentum
spectra of charm hadrons from CC and CC events are presented in figures 12 and 13.
The fitted slope parameters of an exponential function are summarized in table 14 and
figure 14. The pT -slopes, though similar for CC and CC events, are significantly different
from those for both single prompt charm particles and those found in J/ψ C events.
The correlations in azimuthal angle and rapidity between the two charm hadrons have
also been studied by measuring the distributions of ∆φ and ∆y, where ∆φ and ∆y are the
differences in azimuthal angle and rapidity between the two hadrons. These distributions
for the charm hadrons in J/ψ C events are shown in figure 15. No significant azimuthal
correlation is observed. The ∆y distribution is compared to the triangular shape that is
expected if the rapidity distribution for single charm hadrons is flat and if there are no
correlations.
The azimuthal and rapidity correlations for CC and CC events are shown in figures 16, 17, and 18. In the CC case the ∆φ distribution is reasonably consistent with a flat
distribution. In contrast, for CC events a clear enhancement is seen for ∆φ distributions at
small |∆φ|. This is consistent with c¯c production via the gluon splitting mechanism [38].
– 21 –
JHEP06(2012)141
0
●
■
▲
▼
b)
-1
1
GeV/c
pT -slope
Mode
J/ψ
C
J/ψ D0
−0.49 ± 0.01
−0.75 ± 0.02
J/ψ D+
−0.49 ± 0.02
−0.65 ± 0.02
J/ψ D+
s
J/ψ Λ+
c
−0.60 ± 0.05
−0.68 ± 0.05
−0.46 ± 0.08
−0.82 ± 0.08
J/ψ
−0.633 ± 0.003
−0.77 ± 0.03
D+
−0.70 ± 0.03
D+
s
Λ+
c
−0.57 ± 0.13
−0.79 ± 0.08
1
250 MeV/c
a)
LHCb
10-1
d ln σ ∗
dpT
C
d ln σ ∗
dpT
C
1
250 MeV/c
Table 13. Slope parameters of the transverse momentum spectra in the J/ψ C mode and for
prompt charm particles. These parameters are determined from fits to the spectra in the region
3 < pT < 12 GeV/c.
10-2
b)
10-2
● D0 D0
■ D0 D+
▲ D0 D+
s
4
LHCb
10-1
■ D+ D+
▲ D+ D+
s
6
8
pT
C
10
12
[GeV/c]
10-3
4
6
8
pT
C
10
12
[GeV/c]
Figure 12. Transverse momentum spectra of charm hadrons from CC: a) D0 D0 , D0 D+ , D0 D+
s and
b) D+ D+ and D+ D+
.
s
The CC events suggest some enhancement at small |∆y|, while the CC sample shows no
clear difference from the triangular shape given the present statistics.
Finally, the invariant mass distributions of the pairs of charm hadrons in these events
have been studied. The mass spectra for J/ψ C and CC events are shown in figure 19. The
spectra appear to be independent of the type of the open charm hadron.
The invariant mass spectra for CC events are shown in figure 20. Again, the spectra
are similar and independent of the type of the open charm meson. The enhancement at
small invariant mass is most likely due to the gluon splitting process [38]. For the region
of invariant masses above 6 GeV/c2 the spectra are similar for CC and CC events.
– 22 –
JHEP06(2012)141
D0
1
250 MeV/c
1
250 MeV/c
a)
10-1
d ln σ ∗
dpC
T
d ln σ ∗
dpC
T
LHCb
10-2
10-3
LHCb
10-2
0
D0 D
D0 D−
D0 D−
s
¯−
D0 Λ
c
4
■ D+ D−
▲ D+ D−
s
¯−
▼ D+ Λ
c
6
8
pT
C
10
12
10-3
4
6
8
pT
C
[GeV/c]
10
12
[GeV/c]
0
Figure 13. Transverse momentum spectra of charm hadrons from CC: a) D0 D , D0 D− , D0 D−
s and
0 ¯−
+ −
+ −
+ ¯−
D Λc ; b) D D , D Ds and D Λc .
Mode
pT -slope
1
GeV/c
D0 D0
−0.51 ± 0.02
0
D0 D
−0.48 ± 0.01
D0 D+
−0.40 ± 0.02
D0 D−
−0.46 ± 0.01
D0 D+
s
D0 D−
s
¯−
D0 Λ
c
D+ D+
−0.51 ± 0.05
D+ D−
−0.46 ± 0.01
D+ D+
s
−0.39 ± 0.07
D+ D−
s
+
−
¯
D Λc
−0.42 ± 0.02
−0.44 ± 0.02
−0.41 ± 0.03
−0.48 ± 0.04
−0.38 ± 0.05
Table 14. Slope parameters of transverse momentum spectra for the CC and CC modes.
– 23 –
JHEP06(2012)141
●
■
▲
▼
b)
10-1
0
D0 D
D0 D−
D0 D−
s
¯−
D0 Λ
c
LHCb
prompt
JHEP06(2012)141
D0
D+
D+
s
Λ+
c
J/ψ
CC
D D
D+ D−
s
+ ¯−
D Λc
D0 D0
D0 D+
CC
D0 D+
s
D+ D+
D+ D+
s
+
−
J/ψ D0
J/ψ D+
T
+ pC
J/ψ Ds
J/ψ Λ+
c
J/ψ D0
J/ψ D+
pT
J/ψ
J/ψ D+
s
+
J/ψ Λc
-1
-0.8
-0.6
pT -slope
-0.4
-0.2
1
GeV/c
Figure 14. Slope parameters of the transverse momentum spectra for prompt charm particles [1]
and charm particles from J/ψ C, CC and CC production.
– 24 –