DSpace at VNU: Indirect prediction of surface ozone concentration by plant growth responses in East Asia using mini-open top chambers
Bạn đang xem bản rút gọn của tài liệu. Xem và tải ngay bản đầy đủ của tài liệu tại đây (492.32 KB, 11 trang )
Environ Monit Assess (2013) 185:2755–2765
DOI 10.1007/s10661-012-2746-2
Indirect prediction of surface ozone concentration by plant
growth responses in East Asia using mini-open top chambers
Yoshihisa Kohno & Hideyuki Matsumura &
Makoto Miwa & Tetsushi Yonekura & Keiji Aihara &
Chanin Umponstira & Vo Thanh Le &
Nguyen Thuy Ngoc & Phanm Hung Viet & Ma Wei
Received: 23 January 2012 / Accepted: 14 June 2012 / Published online: 3 July 2012
# Springer Science+Business Media B.V. 2012
Abstract We developed small and mobile open top
chambers (mini-OTC) measuring 0.6 m (W)×0.6 m
(D)×1.2 m (H) with an air duct of 0.6 m (W)×0.23 m
(D)×1.2 m (H). The air duct can be filled with activated charcoal to blow charcoal filtered air (CF) into
the chamber, as opposed to non-filtered ambient air
(NF). Ozone sensitive radish Raphanus sativus cv.
Y. Kohno (*) : H. Matsumura
Central Research Institute of Electric Power Industry (CRIEPI),
1646 Abiko,
Abiko, Chiba 270-1194, Japan
e-mail:
URL:
Red Chime and rosette pakchoi Brassica campestris
var. rosularis cv. ATU171 were exposed to NF and CF
in mini-OTCs at different locations in East Asia. A
total of 29 exposure experiments were conducted at
nine locations, Shanghai, China, Ha Noi, Vietnam,
Lampang, Phitsanulok and Pathumtani, Thailand,
and Hiratsuka, Kisai, Abiko and Akagi, Japan.
K. Aihara
Kanagawa Environmental Research Center (KERC),
1-3-39 Shinomiya,
Hiratsuka, Kanagawa 254-0014, Japan
e-mail:
URL: />en_center.htm
Y. Kohno
e-mail:
H. Matsumura
e-mail:
URL:
M. Miwa : T. Yonekura
Center for Environmental Science in Saitama (CESS),
914 Kamitanedare,
Kazo, Saitama 347-0115, Japan
M. Miwa
e-mail:
URL: />cess_eng.html
T. Yonekura
e-mail:
URL: />cess_eng.html
C. Umponstira
Department of Natural Resources and Environment,
Naresuan University (NU),
Phitsanulok, Thailand 60005
e-mail:
URL: http//www.nu.ac.th/english/
V. T. Le : N. T. Ngoc : P. H. Viet
Center for Environment and Technology for Sustainable
Development (CETASD), Ha Noi University of Science,
334 Nguyen Trai, Thanh Xuan,
Ha Noi, Vietnam
V. T. Le
e-mail:
URL: />+duB3Fyv9m2pL2sErKQhVEiSe3/yx6
+E7qa46VS23e48alvZMwiiaFhT5eGN
2756
Although no significant relationships between the
mean concentrations of ambient O3 during the experimental period and the growth responses were observed for either species, multiple linear regression
analysis suggested a good relationship between the
biomass responses in each species and the O3 concentration, temperature, and relative humidity. The cumulative daily mean O3 (ppb/day) could be indirectly
predicted by NF/CF based on the dry weight ratio of
biomass, mean air temperature, and relative air
humidity.
Keywords Indicator plant . Dose–response
relationship . Multiple linear regression analysis .
East Asia
Abbreviations
AIC
Akaike information criteria
CDMO Cumulative daily mean ozone (ppb/day)
CF
Charcoal filtered air
DW
Dry weight
NF
Non-filtered air
O3
Ozone
OTC
Open-top chamber
ppb
Parts per billion (nL/L)
RH
Relative humidity (%)
T
Temperature in Celsius
VPD
Vapor pressure deficit (kPa)
N. T. Ngoc
e-mail:
URL: />+duB3Fyv9m2pL2sErKQhVEiSe3/yx6
+E7qa46VS23e48alvZMwiiaFhT5eGN
P. H. Viet
e-mail:
URL: />+duB3Fyv9m2pL2sErKQhVEiSe3/yx6
+E7qa46VS23e48alvZMwiiaFhT5eGN?
M. Wei
School of Life Science and Technology, Shanghai Jiao Tong
University (SJTU),
1954 Hua Shan Rd.,
Shanghai 200030, People’s Republic of China
e-mail:
URL: http//en.sjtu.edu.cn/
Environ Monit Assess (2013) 185:2755–2765
Introduction
Tropospheric ozone (O3) has been gradually and steadily increasing worldwide and is thus an environmental
issue of great concern to both scientists and the public
(Akimoto 2003; Emberson et al. 2003; Ashmore et al.
2006). Kohno (2005) reported that the daytime accumulated exposure over a threshold of 40 ppb of ozone
(AOT40 ) for 6 months in 1981 was about 4 ppmh in
Japan; however, it reached 13 ppmh in 2003. Nitrogen
oxide (NOx) emissions in East Asia have rapidly increased in the recent years, surpassing those in North
America and Europe (Akimoto 2003). This will affect
the regional distribution of tropospheric O3 and its potential detrimental effects on vegetation.
Many O3 exposure experiments have suggested that
ground level O3 is a potential threat to agricultural
production, forest tree growth, and natural vegetation.
However, continuous monitoring and impact assessments of O3 in East Asia are far behind those of
developed countries. Heagle et al. (1995) proposed
that a smaller biomass ratio of an O3 sensitive variety
(NC-S) of white clover (Trifolium repens L.) compared with a tolerant variety (NC-R) indicates that
the plants were subject to high O3 stress. However,
Ball et al. (1998) reported that simple linear regression
had a low correlation coefficient for the dose
responses in these cultivars applied in Europe, and
they found that vapor pressure deficit (VPD) and
temperature played important roles in the dose
responses. In contrast, Mills et al. (2000) suggested
that VPD and harvest interval were excluded by multiple linear regression analysis, but that NOx improved
plant responses to O3 dose.
Although white clover is an important forage and
cover crop in relatively cool temperate zones such as
those found in North America and Europe, it is not
native to tropical and warm temperate regions of Asia.
Additionally, white clover develops runners and continues to grow during its life cycle, which makes it difficult
to measure dry matter production by the plant. Therefore, it is necessary to examine alternative indicator
plants to determine if they are applicable for assessment
of the effects of O3 on local vegetation in Asia.
In this study, we described a simple O3 monitoring
system for Asian countries from the Far East to southeastern Asian regions and attempted to generate a
model for prediction of O3 concentrations in the field
using Raphanus and Brassica.
Environ Monit Assess (2013) 185:2755–2765
Methods
Cultivation materials
A total of 29 varieties of four species of plants (Raphanus
sativus, Brassica campestris, Phaseolus vulgaris, and
Lactuca sativa) were exposed to SO2 or O3 in large open
top chamber systems under natural light conditions at the
Akagi Testing Center of the Central Research Institute of
Electric Power Industry (CRIEPI). A large reduction in
the relative biomass during the vegetative stage was
found to be a sensitive indicator of O3 exposure when
compared with clean air. However, some species were
also sensitive to SO2. As a result, we screened, radish
R. sativus cv. Red Chime and rosette pakchoi or Chinese
flat cabbage Brassica campestris var. rosularis cv.
ATU171 as O3 sensitive indicator plants (those were
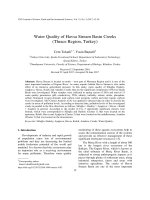
not responsive to SO2) in 2003 (Kohno 2005). Apparent
view of plants grown in OTC was shown in Fig. 1.
Cultivation materials such as seeds (Takii Seed Co.,
Kyoto, Japan), fertilized soil mix (growers potting and
bedding compost, 100 % 0–10 mm peat, N–P2O5–
K2O0192–224–384 g/m3, pH 6.0, Sakata Seed Co.,
Japan imported from William Sinclair Horticulture
Ltd., UK) and 1 L white plastic pots with a drainage
mesh (height011.5 cm, top diameter012.3 cm, bottom diameter08.5 cm) were distributed by CRIEPI to
collaborative institutions to maintain uniformity of the
basic experimental conditions.
Experimental plants were seeded in pots filled with
a fertilized soil mix and then covered with a thin layer
of soil mix to maintain ideal moisture conditions for
Raphanus
2757
germination. Two or three days after seeding, pots
were introduced into mini-OTCs as described below.
Plants were thinned to two per pot at 1 week after
seeding and then to one plant per pot after another
week. Plants were harvested 2–4 weeks after introducing pots to the chambers depending on the different
growing conditions in the locations. After seeding or
germination, a granular insecticide (5 % acephate) was
spread on the surface of the pots.
A total of eight pots for each cultivar were arrayed in
each chamber with three replicates each, giving a total of
24 plants for each experiment. The leaves and edible
roots of R. sativus and the above ground portion of B.
campestris were harvested individually. In this study,
the total dry biomass of R. sativus and top dry biomass
of B. campestris grown in charcoal filtered air (CF) and
those grown in nonfiltered air (NF) were weighed and
their dry weight ratios (NF/CF) were calculated.
A total of 29 experiments were conducted at nine
locations: Japan (4 sites), China (1), Vietnam (1), and
Thailand (3) in 2005 and 2006.
Experimental sites
Experiments in Japan were conducted at the CRIEPI
Abiko campus, Abiko Chiba, and the CRIEPI Akagi
Testing Center, Maebashi, Gunma, as well as at the
campuses of the Kanagawa Environmental Research
Center (KERC), Hiratsuka, Kanagawa and the Center
for Environmental Science in Saitama (CESS), Kazo,
Saitama.
Naresuan University conducted experiments at three
different sites, the campus of Naresuan University at
Phitsanulok, the campus of Rice Research Institute at
Pathumtani, and a site close to a large stationary emission source at Lampang, Thailand. Ha Noi University
(CETASD) and Shanghai Jiao Tong University (SJTU)
conducted experiments on the roofs of buildings at their
institutions due to space limitations and security issues.
The climatic conditions, experimental periods, and
experimental repetitions are summarized in Table 1.
Each location installed six chambers (three charcoal
filtered (CFs) and three non-filtered (NFs) chambers).
Brassica
Mini-open top chamber (mini-OTC) system
Fig. 1 View of Raphanus sativus cv. Red Chime and Brassica
campestris var. rosularis cv. ATU171 grown in OTC
Open-top chamber (OTC) systems are commonly used
to conduct exposure experiments for assessment of the
effects of ambient air quality on plants. Different types
269
Lampang
VPD: vapor pressure deficit
T: temperature in Celsius
–: No data
Pathumthani
45
Phitsanulok
Thailand
4
17
Ha Noi
Vietnam
9
Shanghai
12
Hiratsuka, Kanagawa
(KERC)
China
12
540
Akagi, Gunma
(CRIEPI)
Kazo, Saitama CESS)
21
Abiko, Chiba
(CRIEPI)
Japan
Elevation (m)
Location
Country
2006.03.08.–03.21.
2006.03.21.–04.02.
2
3
2006.03.13.–03.27.
3
2006.02.22.–03.08.
2006.02.28.–03.13.
1
2006.02.15.–02.28.
2
2006.01.31.–02.14.
3
1
2006.01.09.–01.21.
2
2006.03.03.–03.28.
2005.12.14.–12.26.
3
1
2006.02.08.–03.03.
2
2005.10.22.–11.28.
3
2005.09.06.–10.03
2005.09.20.–10.17.
2
1
2005.08.24.–09.15.
2005.09.13.–10.07.
3
1
2005.08.19.–09.09.
2
2005.09.16.–10.05.
4
2005.07.29.–08.19.
2005.09.01.–09.20.
3
1
2005.08.11.–08.31.
2
2005.09.17.–10.05.
4
2005.07.15.–08.02.
2005.08.13.–08.31.
3
1
2005.07.15.–08.02.
2
2005.09.15.–10.13.
3
2005.06.17.–07.05.
2005.08.11.–09.09.
1
2005.07.13.–08.02.
2
Experimental
period
1
Experiment
Table 1 Environmental condition in the experimental sites
12
13
14
14
13
13
13
12
12
25
23
27
37
27
22
24
28
21
25
20
20
18
18
18
18
18
28
29
20
Days
32.9
32.4
31.9
33.0
31.4
29.4
28.0
25.4
23.2
20.8
17.6
29.8
21.8
25.3
27.7
24.3
28.0
30.0
22.1
26.5
27.7
28.0
19.3
24.8
25.0
24.2
21.4
27.8
28.7
Mean
temperature
T (°C)
54.6
68.8
68.7
44.2
47.1
54.1
69.0
55.2
54.8
86.8
82.8
79.0
55.2
59.4
68.7
73.3
76.8
72.9
73.9
73.8
76.1
73.3
83.8
83.4
76.7
85.6
77.2
75.0
73.5
Mean relative
humidity RH
(%)
395
421
447
462
408
382
364
305
278
520
405
805
807
683
609
583
784
630
553
530
554
504
347
446
450
436
599
806
574
T x days
(°C days)
1.66
2.12
2.15
1.34
1.50
1.84
2.46
2.17
2.36
4.17
4.70
2.65
2.53
2.35
2.48
3.02
2.74
2.43
3.34
2.78
2.75
2.62
4.34
3.36
3.07
3.54
3.61
2.70
2.56
RH/T
(%/°C)
4.090
3.434
3.466
4.480
4.268
3.550
2.835
1.669
1.337
0.569
0.477
1.093
1.427
1.307
1.427
0.956
1.421
1.110
0.861
0.814
1.166
1.422
0.396
0.289
0.535
0.938
0.990
1.677
2.495
VPD
kPa
0.3
0.4
1.1
0.2
7.7
1.5
2.0
3.5
0.3
4.0
2.3
2.1
5.1
3.1
2.4
3.8
3.5
4.0
0.4
0.4
0.1
0.2
0.3
0.5
0.8
0.6
0.5
0.3
0.2
Mean SO2
(ppb)
8.9
7.1
14.5
2.9
4.2
3.4
8.9
15.7
8.4
11.1
9.5
22.0
34.2
23.9
21.0
36.4
30.3
24.3
11.6
9.2
8.4
9.8
28
27
48
39
49
33
24
23
24
11
15
21
9
13
11
24
22
29
16
23
20
27
29
36
–
7.5
46
48
–
3.1
18
20
23
Mean O3
(ppb)
17.0
11.0
7.1
Mean NOx
(ppb)
2.33
2.04
3.46
2.76
3.76
2.54
1.85
1.94
2.01
0.44
0.67
0.78
0.25
0.48
0.50
1.01
0.78
1.39
0.65
1.17
0.99
1.51
1.60
1.99
2.56
2.66
0.65
0.70
1.15
Cumulative
mean daily
O3 (ppb/day)
2758
Environ Monit Assess (2013) 185:2755–2765
Environ Monit Assess (2013) 185:2755–2765
120
CF
NF
100
80
Ozone (ppb)
and sizes of OTC systems have been developed in
North American and European countries as well as
in Japan. We developed a mini-OTC modified and
simplified from Aihara's model (Aihara and Takeda
2004) that was mobile and easy to set up. Specifically,
we replaced the DC type wind fan with a high static
pressure electric fan (MRS18V2-D for 200 V or
MRS18V2-B for 100 V; Oriental Motor Co. Ltd.,
Japan) with an adjustable wind speed. The chamber
size was 60 cm (W)×60 cm (D)×120 cm (H), with an
air duct of 22.5 cm (D)×60 cm (W)×120 cm (H). The
air duct of the chamber was separated into three parts.
The top part was 45 cm high for filtering introduced
air by passing it through packed layers of activated
charcoal pellets. The second portion, which was also
45 cm tall, contained a fan. The bottom 30 cm
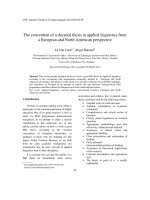
consisted of a mixing and buffering space. The entire
system is shown in Fig. 2.
2759
60
CF= 8.2± 5.9 ppb
NF= 80.6± 13.3 ppb
Removal=89.8%
40
20
0
15 19 23 3
7 11 15 19 23 3
Time
7 11 15 19 23 3
7 11
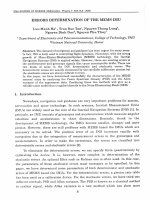
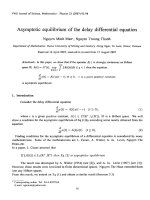
Fig. 3 Comparison of O3 concentration in the charcoal filtered
(CF) and non-filtered (NF) chamber after 7 months of operation
at Abiko, CRIEPI, Chiba, Japan
The volume of the wind fan can be controlled and
the maximum speed is 12 m per second; therefore, the
air exchange rate varied from 3.1 to 5.8 times per
minute. At a wind speed of 9 m per second, the air
exchange rate was 4 times per minute.
The air intake space of the charcoal filter chamber
(CF) was packed with 10 kg of activated charcoal
pellets with a 4 to 6 mesh size. The efficiency for the
removal of O3 after 7 months of operation at the
Abiko, CRIEPI, Japan site was 89.8 % (Fig. 3). No
charcoal filters were added to the NF chambers.
All parts used to build the mini-OTCs, weather
monitoring devices and passive sampling systems
were prepared and distributed by CRIEPI with the
cultivation materials.
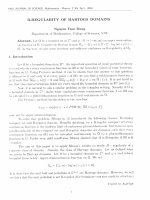
Active O3 (ppb, 24h)
60
50
40
30
20
y = 0.8486x + 1.9583
R² = 0.9283
10
0
0
10
20
30
40
50
60
70
Passive O3 (ppb)
Fig. 2 View of mini-open top chamber system. (1) air intake
duct, (2) activated charcoal filter layer, (3) electric fan. The
arrows indicate air flow
Fig. 4 Relationship between active and passive measurement of
O3 during the experiments
2760
Environ Monit Assess (2013) 185:2755–2765
Table 2 Dry biomass of Raphanus sativus and Brassica campestris grown in mini-OTCs at different locations
Country Location
Japan
China
Elevation Experiment Experimental
(m)
period
Abiko, Chiba
(CRIEPI)
21
Akagi, Gunma
(CRIEPI)
540
Kazo, Saitama
CESS)
12
Hiratsuka,
Kanagawa
(KERC)
12
Shanghai
9
Vietnam Ha Noi
17
Thailand Phitsanulok
45
Lampang
Pathumthani
269
4
1
2
3
1
2
3
4
1
2
3
4
1
2
3
1
2
3
1
2
3
1
2
3
1
2
3
1
2
3
2005.07.13.–08.02.
2005.08.11.–09.09.
2005.09.15.–10.13.
2005.06.17.–07.05.
2005.07.15.–08.02.
2005.08.13.–08.31.
2005.09.17.–10.05.
2005.07.15.–08.02.
2005.08.11.–08.31.
2005.09.01.–09.20.
2005.09.16.–10.05.
2005.07.29.–08.19.
2005.08.19.–09.09.
2005.09.13.–10.07.
2005.08.24.–09.15.
2005.09.20.–10.17.
2005.10.22.–11.28.
2005.09.06.–10.03
2006.02.08.–03.03.
2006.03.03.–03.28.
2005.12.14.–12.26.
2006.01.09.–01.21.
2006.01.31.–02.14.
2006.02.15.–02.28.
2006.02.28.–03.13.
2006.03.13.–03.27.
2006.02.22.–03.08.
2006.03.08.–03.21.
2006.03.21.–04.02.
Days Raphanus sativus
20
29
28
18
18
18
18
18
20
20
25
21
28
24
22
27
37
27
23
25
12
12
13
13
13
14
14
13
12
Brassica campestris
var. rosularis
Dry
NF/
biomass CF
g/plant g/g
p
Dry
NF/
biomass CF
g/plant g/g
p
1.012
0.731
1.877
0.866
1.149
0.415
0.324
0.290
0.056
0.168
0.417
0.696
0.185
0.715
0.472
0.268
0.472
0.444
0.574
0.896
–
–
–
–
–
–
–
–
–
0.396
0.052
0.001
0.968
0.006
0.266
0.702
0.008
0.783
0.098
0.316
0.185
0.575
0.476
0.685
0.270
0.524
0.918
0.423
0.290
–
–
–
–
–
–
–
–
–
0.553
0.551
0.970
0.396
0.379
0.178
0.185
0.221
0.016
0.172
0.238
0.667
0.128
0.538
0.294
0.156
0.205
0.297
0.420
0.504
0.483
0.183
1.428
0.599
0.252
0.252
0.301
0.423
0.095
0.221
0.922
0.692
0.081
0.515
0.309
0.426
0.558
0.002
0.011
0.058
0.128
0.950
0.197
0.401
0.421
0.115
0.324
0.058
0.049
0.001
0.000
0.000
0.000
0.000
0.000
0.000
0.000
0.000
0.954
0.766
0.779
0.996
0.899
0.925
1.019
0.628
0.964
0.923
1.038
0.909
0.935
1.055
1.034
1.090
0.953
0.991
0.963
0.952
–
–
–
–
–
–
–
–
–
0.868
0.987
0.955
0.870
0.929
0.954
0.908
1.059
0.750
0.884
0.920
0.891
0.992
1.095
0.922
1.064
0.883
0.828
0.907
0.870
0.768
0.814
0.798
0.673
0.750
0.813
0.751
0.757
0.526
Cultivar: Red Chime in Raphanus sativus and ATU171 in Brassica campestris var. rosularis
Dry biomass: total of top and hypocotyl for Raphanus and top for Brassica grown in char-coal filtered air (CF)
Chamber replication was 3 with 8 plants in a chamber for each cultivar at any sites
p: Significance between dry biomass in plant grown in char-coal filtered air (CF) and that in non-filtered air (NF)
–: No data
Measurements of climatic conditions and air quality
Temperature and relative humidity were recorded using a data logger (Model TR/72U with a TR-3110
temperature and humidity sensor, T & D Corporation,
Nagano, Japan) inside the chamber during the experiment. The sensor was set in the out-flow air after the fan
in the bottom of the chamber and was protected from
direct solar radiation and water.
An Ogawa passive sampler (Model 3300, Ogawa
Co., Kobe, Japan), which has a holder for two filters at
both ends, was set inside the wall above the plants to
collect air quality data during the experiment. The
O3, SO2, NO, and NOx (NO+NO2) were measured
Environ Monit Assess (2013) 185:2755–2765
in all chambers. All passive sampling filters were collected after the exposure experiments and sent to
CRIEPI for chemical analysis of sulfate and nitrate
by an ion chromatography and nitrite by a spectrophotometry to calculate concentrations of O3, SO2, NO,
and NO2 (Hirano et al. 2002).
The active hourly ozone concentration was monitored with a UV absorption O3 analyzer (Model 12106, Dylec Co., Japan) and passive data was monitored
by an Ogawa passive sampler at Abiko, Akagi, and
Kazo in Japan. The relationship between active and
passive O3 data for the experimental period shown in
Fig. 4 indicated a good correlation (Varns et al. 2001;
Delgado-Saborit and Esteve-Cano 2008). In this study,
the concentrations of O3 from passive samplers in
China, Thailand, and Vietnam were corrected based
on this relationship.
2761
observed in Thailand during the dry and hot season
than at other sites.
Plant responses
As shown in Table 2, plant biomass and responses as
expressed by dry weight ratios of the NF/CF for both
Raphanus and Brassica to ambient O3 varied greatly
under the different weather conditions. The maximum
growth reduction of Raphanus was 37 % at CESS, in
Kazo, Japan, while that of Brassica was 33 % in
Lampang, Thailand.
Significant differences in dry biomass were observed
between NF and CF. However, there were many cases in
which no significant differences were observed. For
1.20
NFDW /CFDW (g/g)
Statistics
Excel add-in statistical software (Esumi Co. Ltd.,
Tokyo, Japan) was used for statistical data analysis.
The significance of differences in dry biomass between CF and NF at the sites was analyzed by Tukey's
t test. Multivariate Statistics ver. 6.0 was applied for
multiple linear regression analysis.
Raphanus sativus cv. Red Chime
1.40
Abiko
1.00
Akagi
0.80
Kisai
Hiratsuka
0.60
Shanghai
Ha Noi
0.40
0.20
0.00
0
10
20
30
40
50
60
Mean O3 (ppb)
Results and discussion
Brassica campestris var. rosularis cv. ATU171
1.40
Ambient conditions
Abiko
The mean temperature (T), relative humidity (RH),
vapor pressure deficit (VPD), and air quality data
including the concentrations of O3, SO2, and NOx
are shown in Table 1. As experimental sites were
distributed from the temperate to the tropical zone,
these variables varied greatly.
The mean concentrations of O3 ranged from 9 to
49 ppb, and Akagi, Japan, and Lampang and Pathumtani, Thailand had higher O3 concentrations than the
other sites.
In contrast, the concentrations of SO2 were below
5 ppb at all sites and presumably had no effect on plant
growth performance (Spranger et al. 2004). The concentrations of NOx at the Shanghai and Ha Noi sites
were higher than those at other sites.
Because high temperatures with low relative humidity caused a large VPD, greater VPD values were
NFDW /CFDW (g/g)
1.20
Akagi
Kisai
1.00
Hiratsuka
0.80
Shanghai
Ha Noi
0.60
Phitsanulok
0.40
Lampang
Pathumthani
0.20
0.00
0
10
20
30
40
50
60
Mean O3 (ppb)
Fig. 5 Plant responses to ozone concentration expressed by dry
biomass weight ratio in Raphanus sativus and Brassica campestris var. rosularis. NFDW: sum of dry weight in the tops and
hypocotyls of Raphanus or tops of Brassica grown in nonfiltered air chambers (NF). CFDW: sum of dry weight in the tops
and hypocotyls of Raphanus or tops of Brassica grown in
activated charcoal-filtered air chambers (CF). DW: dry weight
(g/plant)
2762
Environ Monit Assess (2013) 185:2755–2765
example, at Akagi, only one case of R. sativus and no
cases of B. campestris differed significantly. In contrast,
B. campestris showed significant differences at all locations investigated in Thailand.
Since none of the individual experimental data collected from any locations differed significantly, poor
relationships was observed between the NF/CF ratio
and mean O3 concentration at all sites (Fig. 5). These
findings are similar to those of studies of white clover
conducted in Europe and the United States. These
results likely reflect the fact that the plant response to
O3 can be modified by environmental conditions such as
air temperature and relative humidity (Ball et al. 1998;
Heagle et al. 1995; Heagle and Stefanski 2000).
Multiple linear regression analysis
Since single linear regression analysis failed to show a
good correlation between the mean O3 concentration
during the exposure experiments and plant growth
responses, we applied multiple linear regression analysis to the data set of plant growth responses
expressed by the dry biomass weight ratio of NF/CF
and environmental conditions. Using a round-robin
combination of parameters, we attempted to identify
combinations of parameters showing smaller values of
AIC (Akaike 1974) with higher significance. As
shown in Table 3, increasing the number of parameters
generated a higher correlation coefficient of the equation for predicting the cumulative daily mean O3
(CDMO, ppb/day). In contrast, statistical significance
was reduced as the number of parameters investigated
decreased. Ball et al. (1998) pointed out that VPD was
important; however, Mills et al. (2000) reported the
opposite. Our analysis suggested that RH/T (mean
relative humidity/mean temperature during the cultivation period) could be a simple parameter that could
be used in place of complicated VPD calculations.
Table 3 Results of multiple linear regression analysis
Plant
Cumulative daily mean O3 (CDMO, ppb/day)
AIC R2
p
29.9 0.6448 0.1540
Raphanus 5.5991−0.9503*(NF/CF)−0.0031*(TxDays)−1.1628*(RH/T)−0.0032*NOx(ppb)+0.0091*SO2
(ppb)−0.3468*VPD−0.0559*T+0.0466*RH
6.0702−1.1266*(NF/CF)−0.0028*(TxDays)−0.5838*(RH/T)−0.0076*NOx(ppb)−0.0141*SO2
(ppb)−0.4221*VPD
5.2647−1.0278*(NF/CF)−0.0033*(TxDays)−0.4252*(RH/T)−0.0057*NOx(ppb)+0.0056*SO2
(ppb)
5.2435−1.0193*(NF/CF)−0.0033*(TxDays)−0.4221*(RH/T)−0.0049*NOx(ppb)
27.5 0.5167 0.0386
5.4410−0.6262*(NF/CF)−0.0041*(TxDays)−0.4269*(RH/T)−0.0467*SO2(ppb)
38.2 0.5017 0.0256
6.1019−0.7117*(NF/CF)−0.0035*(TxDays)−0.5660*(RH/T)−0.0704*SO2(ppb)−0.3965*VPD
38.4 0.5445 0.0339
Brassica
28.7 0.5852 0.0818
29.5 0.5168 0.0840
6.1127−1.1465*(NF/CF)−0.0028*(TxDays)−0.5896*(RH/T)−0.0095*NOx(ppb)−0.4170*VPD
26.7 0.5846 0.0390
6.6551−1.0578*(NF/CF)−0.0041*(TxDays)−0.5880*(RH/T)−0.3414*VPD
37.2 0.5268 0.0181
3.7830−1.0447*(NF/CF)−0.0030*(TxDays)−0.0061*VPD
40.7 0.3765 0.0508
5.8903−0.8756*(NF/CF)−0.0044*(TxDays)−0.4557*(RH/T)
36.5 0.4936 0.0107
−0.1797+0.8027*(NF/CF)−0.0034*(TxDays)−0.0513*(RH/T)−0.0184*NOx(ppb)+0.0996*SO2
50.3 0.7944 0.0001
(ppb)+0.1104*VPD+0.1095*T−0.0061*RH
50.2 0.7617 0.0000
3.0841+0.6435*(NF/CF)−0.0028*(TxDays)−0.3558*(RH/T)−0.0228*NOx(ppb)+0.0767*SO2
(ppb)+0.2360*VPD
4.7293+0.0906*(NF/CF)−0.0028*(TxDays)−0.5971*(RH/T)−0.0301*NOx(ppb)+0.0931*SO2(ppb) 50.7 0.7388 0.0000
4.9901+0.0075*(NF/CF)−0.0030*(TxDays)−0.6222*(RH/T)−0.0180*NOx(ppb)
51.3 0.7130 0.0000
5.2408−0.3009*(NF/CF)−0.0040*(TxDays)−0.5180*(RH/T)+0.0233*SO2(ppb)
60.7 0.6372 0.0000
3.3436+0.4594*(NF/CF)−0.0038*(TxDays)−0.2627*(RH/T)+0.0177*SO2(ppb)+0.2482*VPD
60.5 0.6641 0.0001
3.0325−0.6644*(NF/CF)−0.0030*(TxDays)−0.3378*(RH/T)−0.0120*NOx(ppb)+0.2733*VPD
50.1 0.7448 0.0000
3.3285+0.4944*(NF/CF)−0.0037*(TxDays)−0.2668*(RH/T)+0.2515*VPD
58.6 0.6630 0.0000
2.2036+0.4902*(NF/CF)−0.0034*(TxDays)+0.3966*VPD
58.0 0.6466 0.0000
5.2547−0.2682*(NF/CF)−0.0039*(TxDays)−0.5280*(RH/T)
58.9 0.6352 0.0000
AIC: Akaike Information Criteria (Akaike 1974)
Environ Monit Assess (2013) 185:2755–2765
2763
Mills et al. (2000) also introduced NOx into the equation for the dose response of white clover to assess
ambient air quality; however, this was not a significant
factor for the prediction model used in the present
study.
The use of field grown white clover containing
contrasting genotypes with different sensitivities to
O3 is a feasible system for O3 analysis as it does not
require any specific mechanical monitoring devices.
Plants grown in mini-OTCs with charcoal filtered air
and non-filtered air will provide more accurate data
regarding the responses to air quality. If several parameters for air quality and weather conditions are monitored, the system becomes even more effective for
assessing the effects of ambient air quality. Considering
the state of ambient air quality monitoring in developing
Raphanus sativus cv. Red Chime
3.50
Calculated CDMO (ppb/day)
3.00
y = 0.4917x + 0.5655
R² = 0.4936
2.50
2.00
1.50
1.00
0.50
0.00
0.00
0.50
1.00
1.50
2.00
2.50
3.00
Observed CDMO (ppb/day)
Brassica campestris var. rosularis cv. ATU171
3.50
3.00
Calculated CDMO (ppb/day)
Fig. 6 Relationship between
observed and predicted
values of cumulative daily
mean O3 (CDMO, ppb/day)
for Raphanus sativus and
Brassica campestris var.
rosularis
countries, such a simple system could be very useful for
expanding monitoring activities.
The equations provided below generated by multiple linear regression analysis have been simplified as
much as possible and include only the lowest possible
number of parameters. Specifically, they include the
dry weight ratio of plants in the NF to CF, mean
temperature (T) and mean relative air humidity (RH)
during cultivation (Table 3). As shown in Fig. 6, the
correlation coefficient and statistical significance for
the Raphanus was lower than that for Brassica. This
was because there was a smaller number of observed
data for Raphanus, as no data were obtained from
Thailand due to unfavorable growth conditions. Therefore, we omitted the cultivation experiments conducted
in Thailand from the analyses.
2.50
2.00
1.50
1.00
y = 0.6331x + 0.5743
R² = 0.6352
0.50
0.00
0.00
0.50
1.00
1.50
2.00
2.50
Observed CDMO (ppb/day)
3.00
3.50
4.00
2764
Environ Monit Assess (2013) 185:2755–2765
CDMO (ppb/day)
2.00
Brassica campestris
Fig. 7 Correlation between
estimated values of cumulative daily mean O3 (CDMO,
ppb/day) of Raphanus
sativus and those of
Brassica campestris
var. rosularis
1.50
1.00
y = 0.8199x + 0.2039
R² = 0.923
0.50
0.00
0.00
0.50
1.00
1.50
2.00
2.50
Raphanus sativus
CDMO ðppb=dayÞ ¼ 5:8903 À 0:8756 Â ðNFDW =CFDW Þ À 0:0044 Â
ðT Â DayÞ À 0:4557 Â ðRH =T Þ ðR2 ¼ 0:4936; p ¼ 0:0107Þ
for Raphanus sativus cv: Red Chime
ð1Þ
CDMO ðppb=dayÞ ¼ 5:2547 À 0:2682 Â ðNFDW =CFDW Þ À 0:0039 Â
ðT Â DayÞ À 0:5280 Â ðRH =T Þ ðR2 ¼ 0:6352; p ¼ 0:0000Þ
for Brassica campestris var: rosularis cv: ATU171
ð2Þ
where
CDMO (cumulative
daily mean ozone)
NFDW
CFDW
DW
Day
RH
T
daily mean O3 concentration
(ppb)/experimental period
(days)
dry biomass of plants grown
in the non-filtered air chamber
(NF)
dry biomass of plants grown
in the activated charcoalfiltered air chamber (CF)
total dry weight in Raphanus
and top in Brassica
total days after the placement
of pots in the chamber to
harvest
mean relative humidity (%)
for cultivation of plants grown
in the chamber
mean temperature (°C) for
cultivation of plants grown in
the chamber
The values predicted using either the equation from
Raphanus (Eq. 1) or Brassica (Eq. 2) can be converted
to the other using the equation shown in Fig. 7.
To evaluate this simple prediction model, calculation
of CDMO was applied to the data set of white clover
generated by Heagle and Stefanski (2000), assuming
that the maximum temperature would be equivalent to
T and the midday relative humidity equivalent to RH.
The O 3 concentration (ppb) was calculated from
SUM00 (accumulated dose of O3) for 28 days during
the white clover cultivation period, and the forage ratio
(percent) was the same as the dry weight ratio. Multiple
linear regression reproduced similar results for the white
clover and Raphanus or Brassica.
Conclusions
Multiple linear regression analysis generated effective
equations for predicting the O3 concentration from the
mini-OTC experiment using the O3 sensitive cultivars
of R. sativus and B. campestris. The method requires
determination of the dry weights of R. sativus cv. Red
Chime or B. campestris var. rosularis cv. ATU171
grown in a non-filtered air chamber (NF) and an
activated charcoal filtered air chamber (CF) and recording only the mean temperature and relative humidity. Either Eq. (1) for Raphanus or (2) for Brassica
will be able to predict the mean concentration of O3
Environ Monit Assess (2013) 185:2755–2765
from the cumulative daily mean O3 (CDMO) (ppb/day).
However, more extensive evaluation experiments are
necessary to increase the accuracy of the mean O3 concentration predicted by this model.
Acknowledgments This research was conducted with financial support from the Global Environmental Research Fund
(C-7), Ministry of the Environment, Japan. We greatly appreciate the collaboration and arrangements with Dr. Tran Thi Ngoc
Lan, University of Natural Sciences, Ho Chih Minh City, Vietnam, and Dr. Yasuaki Maeda, JICA Expert, Ministry of the
Natural Resources and Environment, Ha Noi, Vietnam. We also
appreciate Mr. Ideta, Techno Systems Co. Ltd., Tokyo, Japan for
his chemical analysis of air quality samples. Additionally, we
thank the students and staff of the universities and CERES Inc.
at Akagi Testing Center, CRIEPI for their support with the
experiments. Finally, we thank Dr. M. Frei, University of Bonn,
for his critical review and editorial suggestions regarding this
manuscript.
References
Aihara, K., & Takeda, M. (2004). Development of portable open
top chamber. Bulletin of Kanagawa Environmental Research Center, 27, 77–81 (in Japanese).
Akaike, H. (1974). A new look at the statistical model identification. IEEE Transactions on Automatic Control, 19(6),
716–723.
Akimoto, H. (2003). Global air quality and pollution. Science,
302, 1716–1719.
Ashmore, M., Toet, S., & Emberson, L. (2006). Ozone—a
significant threat to future world food production? New
Phytologist, 170, 201–204.
Ball, G. R., Benton, J., P-Brown, D., Fuhrer, J., Skarby, K.,
Gimeno, B. S., et al. (1998). Identifying factors which
modify the effects of ambient ozone on white clover
(Trifolium repens) in Europe. Environment Pollution,
103, 7–16.
2765
Delgado-Saborit, J. M., & Esteve-Cano, V. J. (2008). Assessment of tropospheric ozone effects on citrus crops using
passive samplers in western Mediterranean area. Agriculture, Ecosystems and Environment, 124, 147–153.
Emberson, L., Ashmore, M., & Murray, F. (Eds.). (2003). Air
pollution impacts on crops and forests—a global assessment. In: Air pollution reviews (Vol. 4). London: Imperial
College Press.
Heagle, A. S., & Stefanski, L. A. (2000). Relationships between
ambient ozone regimes and white clover forage production
using different ozone exposure indexes. Atmospheric Environment, 34, 735–744.
Heagle, A. S., Miller, J. E., Chevone, B. I., Dreschel, T. W.,
Manning, W. J., McCool, P. M., et al. (1995). Response of
a white clover indicator system to tropospheric ozone at
eight locations in the United States. Water, Air, and Soil
Pollution, 85(3), 173–1378.
Hirano, K., Maeda, H., & Saito, K. (2002). Simultaneous determination method of NO, NO2, SO2, O3 and NH3 in ambient
air by use of diffusional sampling devices for short-term
integrated samplers (in Japanese). Kanagawa: Yokohama
Environmental Science Research Institute.
Kohno, Y. (2005). Study on impacts of acidic and oxidative
substances on vegetation and establishment of tentative
critical level for protecting East Asian vegetation. In Summary report of research results under the GERF (pp. 279–
284). Ministry of the Environment, Japan.
Mills, G., Ball, G., Hayes, F., Fuhrer, J., Skärby, L., Gimeno, B.,
De Temmerman, L., Heagle, A., & Members of the ICP
Vegetation Programme. (2000). Development of a multifactor model for predicting the effects of ambient ozone on
the biomass of white clover. Environment Pollution, 109,
533–542.
Spranger, T., Lorenz, U., & Gregor, H-D. (2004). Manual on
methodologies and criteria for modelling and mapping
critical loads and levels and air pollution effects, risks
and trends, Texte 52-2004, Umweltbundesamt. (UNECE/
ICP Modelling and mapping manual).
Varns, J. L., Mulik, J. D., Sather, M. E., Glen, G., Smith, L., &
Stallings, C. (2001). Passive ozone network of Dallas: a
modeling opportunity with community involvement 1.
Environmental Science and Technology, 35, 845–855.