DSpace at VNU: Initial Stiffness of Reinforced Concrete Columns with Moderate Aspect Ratios
Bạn đang xem bản rút gọn của tài liệu. Xem và tải ngay bản đầy đủ của tài liệu tại đây (681.12 KB, 12 trang )
Initial Stiffness of Reinforced Concrete Columns with
Moderate Aspect Ratios
Cao Thanh Ngoc Tran1 and Bing Li2,*
1Department
of Civil Engineering, International University, Vietnam National University, Ho Chi Minh City, Vietnam
of Civil and Environment Engineering, Nanyang Technological University, Singapore 639798
2School
(Received: 1 December 2010; Received revised form: 17 May 2011; Accepted: 4 June 2011)
Abstract: The estimation of the initial stiffness of columns subjected to seismic
loadings has long been a matter of considerable uncertainty. This paper reports a study
that is devoted to addressing this uncertainty by developing a rational method to
determine the initial stiffness of RC columns when subjected to seismic loads. A
comprehensive parametric study based on a proposed method is initially carried out to
investigate the influences of several critical parameters. A simple equation is then
proposed to estimate the initial stiffness of RC columns. The applicability and
accuracy of the proposed method and equation are then verified with the experimental
data obtained from literature studies.
Key words: reinforced concrete, column initial stiffness, stiffness ratio.
1. INTRODUCTION
In recent years, earthquake design philosophy has shifted
from a traditional force-based approach toward a
displacement-based ideology. The assumed initial
stiffness of reinforced concrete (RC) columns could affect
the estimation of the displacement and displacement
ductility, which are crucial in displacement-based design.
In addition, the assumed initial stiffness properties of
columns also affect the estimation of the fundamental
period and distribution of internal forces of structures.
Therefore, an accurate evaluation of the initial stiffness of
columns becomes an inevitable requirement.
Literature reviews show that there is a considerable
amount of uncertainty regarding the estimation of the
initial stiffness of columns when subjected to seismic
loads. Current design codes often employ a stiffness
reduction factor to deal with this uncertainty. In an
attempt to address these uncertainties, the study
presented within this paper is devoted to developing a
rational method to determine the initial stiffness of RC
columns when subjected to seismic loads. A
comprehensive parametric study based on the proposed
method was carried out to investigate the influences of
several critical parameters. A simple equation to estimate
the initial stiffness of RC columns is also proposed
within this paper. The applicability and accuracy of the
proposed method and equation are then verified with the
experimental data obtained from the literature.
2. DEFINING INITIAL STIFFNESS OF RC
COLUMNS
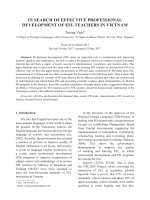
There are two methods as illustrated in Figure 1(a) that are
commonly utilized to determine the initial stiffness of RC
columns (Ki). In the first method, the initial stiffness of RC
columns are estimated by using the secant of the shear
force versus lateral displacement relationship passing
through the point at which the applied force reaches 75%
of the flexural strength (0.75 Vu). In the second method,
the column is loaded until either the first yield occurs in
the longitudinal reinforcement or the maximum
compressive strain of concrete reaches 0.002 at a critical
section of the column. This corresponds to point A in
Figure 1(a). Generally, the two approaches give similar
values. In this study, the later approach was adopted.
*Corresponding author. Email address: ; Tel: +65-6790-5292.
Associate Editor: J.G. Dai.
Advances in Structural Engineering Vol. 15 No. 2 2012
265
Initial Stiffness of Reinforced Concrete Columns with Moderate Aspect Ratios
The stiffness ratio (κ) is defined as follows:
Shear force
Vu
Vy
0.75
Vu
κ=
A'
Ie
× 100%
Ig
(2)
A
where Ig is the moment of inertia of the gross section; Ki
is the initial stiffness of columns and L is the height of
columns and Ec is the elastic modulus of concrete.
Initial stiffness
Lateral displacement
(a)
Vu
0.80
Vmax
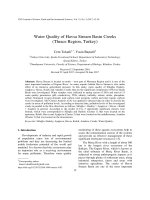
3.2. FEMA 356 (2000)
FEMA 356 (2000) suggests the variation of effective
stiffness values with the applied axial load ratio. The
effective stiffness is taken as 0.50 EIg for members with an
axial load ratio of less than 0.30, while a value of 0.7 EIg
is adopted for members with an axial load ratio of more
than 0.50. This value varies linearly for intermediate axial
load ratios as illustrated in Figure 2.
A
Initial stiffness
Lateral displacement
(b) (Elwood et al. 2009)
Figure 1. Methods to determine initial stiffness
However, the above mentioned definition cannot be
used for columns whose shear strengths do not
substantially exceed its theoretical yield force. For these
columns, defined as those whose maximum measured
shear force was less than 107% of the theoretical yield
force, the effective stiffness was defined based on a
point on the measured force-displacement envelope
with a shear force equal to 0.8 Vmax as illustrated in
Figure 1(b) (Elwood et al. 2009).
Assuming the column is fixed against rotation at both
ends and has a linear variation in curvature over the
height of the column, the measured effective moment of
inertia can be determined as:
3.3. ASCE 41 (2007)
As shown in Figure 2, ASCE 41 (2007) recommends that
the effective stiffness is taken as 0.30 EIg for members
ACI 318-0.8 (a)
ACI 318-0.8 (b)
FEMA 356
ASCE 41
PP92
EE09
1
0.8
Stiffness ratio k (%)
Shear force
Vy
3. REVIEW OF EXISTING INITIAL
STIFFNESS MODELS
3.1. ACI 318-08 (2008)
ACI 318-08 (2008) recommends the following options
for estimating member stiffness for the determination of
lateral deflection of building systems subjected to
factored lateral loads: (a) 0.35 EIg for members with an
axial load ratio of less than 0.10 and 0.70 EIg for
members with an axial load ratio of more than or equal
to 0.10; or (b) 0.50 EIg for all members.
0.6
0.4
0.2
0
− 0.1
0
0.1
0.2
0.3
0.4
0.5
0.6
0.7
Axial load ratio f 'c Ag
Ie =
266
L3 K i
12 Ec
(1)
Figure 2. Relationships between stiffness ratio and axial load ratio
of existing models
Advances in Structural Engineering Vol. 15 No. 2 2012
Cao Thanh Ngoc Tran and Bing Li
with an axial load ratio of less than 0.10, as 0.7 EIg for
members with an axial load ratio of more than 0.50 and
varies linearly for intermediate axial load ratios.
3.4. Paulay and Priestley (1992)
According to Paulay and Priestley’s recommendation
(1992), the effective stiffness is taken as 0.40 EIg for
members with an axial load ratio of less than −0.05, as
0.8 EIg for members with an axial load ratio of more
than 0.50 and varies linearly for intermediate axial load
ratios as illustrated in Figure 2.
3.5. Elwood and Eberhard (2009)
Elwood and Eberhard (2009) recommend the following
equation for estimating the initial stiffness of reinforced
concrete columns subjected to seismic loading:
k=
0.45 + 2.5P / Ag fc′
≤ 1 and ≥ 0.2
d h
1 + 110 b
h a
(3)
where db is the diameter of longitudinal reinforcing
bars; a is the shear span and h is the column depth; Ag is
the gross sectional area of columns and fc′ is the
compressive strength of concrete.
Figure 2 illustrates the variation of stiffness ratio
based on Elwood and Eberhard’s model (2009) versus
the axial load ratio for specimens with db and a equal to
25 mm and 850 mm respectively.
4. EXPERIMENTAL INVESTIGATION ON
INITIAL STIFFNESS OF RC COLUMNS
In this section, the experimental results obtained from
testing of six RC columns conducted by Tran et al. (2009)
are briefly discussed with respect to the initial stiffness of
the test specimens. Four column axial loads of 0.05, 0.20,
0.35, 0.50 fc′ Ag and two aspect ratios of 1.71 and 2.43
were investigated in this experimental program. Table 1
summarizes all the details of the test specimens. It is to be
noted that only a brief summary of important test features
that are relevant to this study are presented within this
paper. Detailed information has been documented in
another publication (Tran et al. 2009).
The relationships between initial stiffness and the
column axial load ratio obtained from all the test
specimens are tabulated in Table 2. The initial stiffness of
SC-1.7 Series specimens enhanced by around 9.8%,
17.6%, and 40.4% as the column axial load was increased
from 0.05 to 0.20, 0.35, and 0.50 fc′ Ag, respectively. An
analogous trend was observed in the specimens of RC-1.7
Series, whose initial stiffness experienced an
enhancement of around 33.9%, 64.3% and 86.1% with an
increase in the column axial load from 0.05 to 0.20, 0.35
and 0.50 fc′ Ag, respectively. As compared to Specimen
SC-2.4-0.20, Specimen SC-2.4-0.50 experienced an
Table 1. Summary of test specimens (Tran et al. 2009)
Specimen
SC-2.4-0.20
SC-2.4-0.50
SC-1.7-0.05
SC-1.7-0.20
SC-1.7-0.35
SC-1.7-0.50
Longitudinal
reinforcement
Transverse
reinforcement
b× h
fc′ (MPa)
(mm × mm)
L
(mm)
1700
8-T20
ρl = 2.05%
2-R6 @ 125
ρv = 0.13%
350 × 350
25.0
1200
P
fc' Ag
0.20
0.50
0.05
0.20
0.35
0.50
Table 2. Experimental verification of the proposed method
K i− exp
K i− exp
K i− exp
K i− exp
K i− exp
K i− exp
K i− exp
Specimen
K i−−exp (kN/mm)
Ki − p
K i− ACI ( a )
K i− ACI ( b)
K i− FEMA
K i− ASCE
K i− PP
K i− EE
SC-2.4-0.20
SC-2.4-0.50
SC-1.7-0.05
SC-1.7-0.20
SC-1.7-0.35
SC-1.7-0.50
12.9
15.5
24.5
26.9
28.8
34.4
0.782
0.572
0.918
0.865
0.653
0.620
0.735
0.141
0.254
0.301
0.319
0.169
0.188
0.220
0.242
0.060
0.355
0.421
0.223
0.236
0.263
0.308
0.301
0.076
0.355
0.301
0.223
0.236
0.239
0.220
0.262
0.054
0.444
0.301
0.372
0.295
0.239
0.220
0.312
0.084
0.305
0.263
0.236
0.203
0.190
0.193
0.232
0.046
0.793
0.525
0.560
0.590
0.553
0.507
0.588
0.104
Mean
Coefficient of Variation
Advances in Structural Engineering Vol. 15 No. 2 2012
267
Initial Stiffness of Reinforced Concrete Columns with Moderate Aspect Ratios
increase in the initial stiffness of 20.2%. The
aforementioned discussion clearly indicated that column
axial load was beneficial to the initial stiffness of test
specimens.
The initial stiffness of Specimens SC-2.4-0.20, SC-1.70.20, SC-2.4-0.50 and SC-1.7-0.50 obtained from the tests
were 12.9 kN/mm, 26.9 kN/mm, 15.5 kN/mm and 34.4
kN/mm respectively. The increase in the initial stiffness
when comparing between Specimens SC-1.7-0.20 and
SC-2.4-0.20 was 108.5%. Similarly, an enhancement in
the initial stiffenss of 121.9% was observed in Specimen
SC-1.7-0.50 as compared to Specimen SC-2.4-0.50.
The initial stiffness of test columns calculated based
on ACI 318-2008 (2008), FEMA 356 (2000), ASCE 41
(2007), Paulay and Priestley (1992), and Elwood and
Eberhard (2009) are also all tabulated in Table 2. All
these models tend to overestimate the initial stiffness of
the test columns. Amongst all of these existing models,
Elwood and Eberhard (2009) provides the best mean
ratio of the experimental to predicted initial stiffness.
However none of these models are accurate.
5. PROPOSED METHOD
5.1. Yield Force (Vy)
The initial stiffness of columns is determined by
applying the second method as described in the previous
section. The yield force (Vy) corresponding to point A in
Figure 1(a) is obtained from the yield moment (My)
when the reinforcing bar closest to the tension edge of
columns has reached its yield strain. Moment-curvature
analysis is adopted to determine this moment.
5.2. Displacement at Yield Force (∆′y)
The displacement of a column at yield force (Vy) can be
considered as the sum of the displacement due to
flexure, bar slip and shear.
∆ ′y = ∆ ′flex + ∆ shear
′
(4)
where ∆′y is the displacement of a column at yield force;
∆′flex is the displacement due to flexure and bar slip at
yield force; and ∆′shear is the displacement due to shear
at yield force
5.2.1. Flexure deformations (∆′flex)
In this proposed method, the simplified concept of an
effective length of the member suggested by Priestley et
al. (1996) was used to account for the displacement due
to bar slip in flexure deformations. Assuming a linear
variation in curvature over the height of the column, the
contribution of flexural deformations and bar slips to the
displacement at the yield force for RC columns with a
fixed condition at both ends can be estimated as follows:
268
∆ ′flex =
(
φ y′ L + 2 Lsp
6
)
2
(5)
where φ′y is the curvature at the yield force determined
by using moment-curvature analysis and L is the clear
height of columns.
The strain penetration length (Lsp) is given by:
Lsp = 0.022 f yl d b
(6)
where fyl is the yield strength of longitudinal reinforcing
bars; and db is the diameter of longitudinal reinforcing
bars.
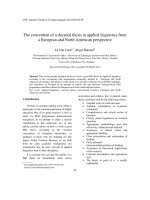
5.2.2. Shear deformations (∆′shear)
The idea of utilizing the truss analogy to model cracked
RC elements has been around for many years. The truss
analogy is a discrete modeling of actual stress fields
within RC members. The complex stress fields within
structural components resulting from applied external
forces are simplified into discrete compressive and
tensile load paths. The analogy utilizes the general idea
of concrete in compression and steel reinforcement in
tension. The longitudinal reinforcement in a beam or
column represents the tensile chord of a truss while the
concrete in the flexural compression zone is considered
as part of the longitudinal compressive chord. The
transverse reinforcement serves as ties holding
the longitudinal chords together. The diagonal concrete
compression struts, which discretely simulate the
concrete compressive stress field, are connected to
the ties and longitudinal chords at rigid nodes to attain
static equilibrium within the truss. The truss analogy is
a very promising way to treat shear because it provides a
visible representation of how forces are transferred in a
RC members under an applied shear force.
Park and Paulay (1975) derived a method to
determine the shear stiffness by applying the truss
analogy for short or deep rectangular beams of unit
length. The shear stiffness is the magnitude of the shear
force, when applied to a beam of unit length that will
cause unit shear displacement at one end of the beam
relative to the other. This model is reliable in estimating
shear deformations of short or deep beams in which the
influences of flexure are negligible. The behaviors of
RC columns under seismic loading are much more
complex because of the interaction between shear and
flexure. The influences of axial strain due to flexure in
estimating shear deformations of RC columns should be
considered to accurately predict the initial stiffness of
RC columns. By applying a method that is similar to
Park and Paulay’s analogous truss model (1975), the
Advances in Structural Engineering Vol. 15 No. 2 2012
Cao Thanh Ngoc Tran and Bing Li
shear stiffness of RC columns is derived in this part of
the paper. The effects of flexure in shear deformations
are incorporated in the proposed model through the axial
strains at the center of columns (ε y,CL).
Assuming that transverse reinforcing bars start
resisting the applied shear force when the shear cracking
starts occurring, the stress in transverse reinforcing bars
at the yield force is calculated as:
fsy =
(
)
Vy − Vcr s
(7)
Ast d tan θ
where d is the distance from the extreme compression
fiber to centroid of tension reinforcement; s is the
spacing of transverse reinforcement; Ast is the total
transverse steel area within spacing s; and θ is the angle
of diagonal compression strut. Hence the strain in
transverse reinforcing bars is:
εx =
fsy
Es
≤ ε yt
(8)
where ε yt is the yield strain of transverse reinforcing
bars; Es is the elastic modulus of steel.
Similar to Park and Paulay’s model (1975), the
concrete compression stress at the yield force is given as:
f2 =
Vy
ε2 =
Ec = 5000 fc
fce =
fc'
≤ fc'
0.8 + 170ε1
ε1 =
ε2 =
ε x + ε y, CL
2
ε x + ε y, CL
2
2
2
γ xy
ε x − ε y, CL
+
+ 2
2
(13)
2
2
γ xy
ε x − ε y, CL
−
+ 2
2
(14)
θ
d
Figure 3. Diagonal strut of RC columns (Park and Paulay1975)
Advances in Structural Engineering Vol. 15 No. 2 2012
γ xy
ε x − ε y, CL
(15)
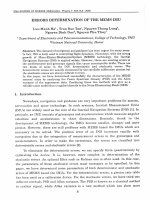
For the axial mean strains, compatibility requires that
the plain sections remain plane. Hence the mean strain
at the center of section C-C is given as:
ε y, CL =
θ
(12)
By applying Mohr’s circle transformation for the
mean strains at the center of Section C-C as shown in
Figure 4, it gives:
Diagonal strut
LCS
(11)
Based on Vecchio and Collins’s model (1986), the
effective compressive strength of concrete is calculated
as follows:
tan 2θ =
where b is the width of columns; Lcs = d sinθ is the
effective depth of the diagonal strut as shown in Figure 3.
Hence the strain in the concrete compression strut is
given as:
(10)
where Ec is the elastic modulus of concrete given as:
(9)
bLcs cosθ
f2
Ec
ε y, top + ε y, bot
2
(16)
where εy, top, εy, bot are the axial strains at the extreme
tension and compression fibers, respectively as shown
in Figure 4(b).
There are six variables, namely εx , εy,CL , γxy, ε1, ε2
and θ ; and six independent Eqns 8, 10, 13, 14, 15 and
16. By solving these six independent equations, the
shear strain (γxy) at the center of section C-C could be
determined.
The column is divided into several segments along its
height of the column to determine the total shear
deformation at the top of the column. The mean axial
strain at the center of the section is determined based on
269
Initial Stiffness of Reinforced Concrete Columns with Moderate Aspect Ratios
(a)
y
(b)
V
(c)
εy,CL
x
εx
C
εy,CL
ε2
ε1
γ xy
εx
ε1
γ xy
C
C
C
εy,CL
ε2
θ
Transverse
reinforcement
Diagonal strut
Tension chord
Compression chord
θ
CL
z
Figure 4. Influences of flexure in estimating shear deformations
the moment-curvature analysis. The shear strains at the
lower and upper section of the segment are calculated
using the above equations. Hence, the total shear
displacement caused by the yield force can be calculated
as follows:
n γ i + γ i +1
xy
xy
∆ shear
= ∑
′
hi
2
i =1
(17)
i and γ i+1 are the shear strains at the lower and
where γ xy
xy
upper section of the segment i; hi is the height of
segment i and n is the number of segments.
5.3. Initial Stiffness
Once the flexural and shear deformations at the top of
columns under yield force are obtained, the initial
stiffness of columns can be determined as:
Ki =
Vy
∆ ′flex + ∆ shear
′
(18)
6. VALIDATION OF THE PROPOSED
METHOD
The proposed method is validated by comparing its
results to the initial stiffness of six columns obtained
from the experimental study previously conducted by
Tran et al. (2009).
It was found that the average ratio of experimental
to predicted initial stiffness by the proposed method
was 0.735 as tabulated in Table 2. It shows a relatively
good correlation between the analytical and
270
experimental results. The initial stiffness of the tested
columns calculated based on ACI 318-2008 (2008),
FEMA 356 (2000), ASCE 41 (2007), Paulay and
Priestley (1992), and Elwood and Eberhard (2009) are
also tabulated in Table 2. The mean ratio of the
experimental to predicted initial stiffness and its
coefficient of variation were 0.242 and 0.060, 0.301
and 0.076, 0.262 and 0.054, 0.312 and 0.084, 0.232
and 0.046, and 0.588 and 0.104 for ACI 318-2008
(2008a), ACI 318-2008 (2008b), FEMA 356 (2000),
ASCE 41 (2007), Paulay and Priestley (1992), and
Elwood and Eberhard (2009) respectively. Comparison
of available models with experimental data indicated
that the proposed method produced a better mean ratio
of the experimental to predicted initial stiffness than
other models. The proposed method may be suitable as
an assessment tool to calculate the initial stiffness of
RC columns.
7. PARAMETRIC STUDIES
A parametric study conducted to improve the
understanding of the effects of various parameters on
the initial stiffness of RC columns is presented within
this section. The parameters investigated are transverse
reinforcement ratios (ρv), longitudinal reinforcement
ratios (ρl), yield strength of longitudinal reinforcing
bars (fyl), concrete compressive strength (fc′ ), aspect
ratio (a/d) and axial load ratio (P/fc′ Ag). In the
parametric study, the effects of the parameters that
were investigated on the initial stiffness of RC columns
are presented by the dimensionless stiffness ratio (k).
Specimen SC-2.4-0.20 with an aspect ratio of 2.4 is
considered as the reference specimen in the parametric
Advances in Structural Engineering Vol. 15 No. 2 2012
Cao Thanh Ngoc Tran and Bing Li
study. An axial load of 0.2 was applied to the
specimen. The concrete compressive strength of the
specimen (fc′ ) at 28 days was 25.0 MPa. The
longitudinal reinforcement consisted of 8-T20 (20 mm
diameter). This resulted in the ratio of longitudinal
steel area to the gross area of column to be 2.05%. The
transverse reinforcement consisted of R6 bars (6 mm
diameter) with 135° bent spaced at 125 mm,
corresponding to a transverse reinforcement ratio of
0.129%.
7.2. Influence of Longitudinal Reinforcement
Ratio
The influence of longitudinal reinforcement ratios on
stiffness ratios is presented in Figure 6 for two different
column axial loads of 0.05 fc′ Ag and 0.20 fc′ Ag. Four types
of longitudinal reinforcement, 8T16, 8T20, 8T22 and
8T25 corresponding to longitudinal reinforcement ratios
ρl of 1.66%, 2.05%, 2.48% and 3.21% respectively,
were considered.
As shown in Figure 6, the stiffness ratios for
columns under an axial load of 0.05 fc′ Ag were
observed to rise slightly with an increase in
longitudinal reinforcement ratio; while for columns
under an axial load of 0.20 fc′ Ag the stiffness ratios
almost remained the same. This suggested that for
simplicity the influence of longitudinal reinforcement
ratio on the initial stiffness of RC columns could be
ignored.
7.3. Influence of Yield Strength of Longitudinal
Reinforcing Bars
Four yield strengths of longitudinal reinforcing bars,
362 MPa, 412 MPa, 462 MPa and 512 MPa were chosen
to investigate the influences of this variable on stiffness
ratios. As shown in Figure 7, with a decrease in yield
strength of longitudinal reinforcing bars from 512 MPa
to 462 MPa, 412 MPa and 362 MPa; the stiffness ratios
increased slightly by approximately 3.1%, 4.3%, and
5.0%, respectively for columns under an axial load of
0.05 fc′ Ag; whereas stiffness ratios almost remains the
same for column under an axial load of 0.20 fc′ Ag. The
25
25
20
20
Stiffness ratio k (%)
Stiffness ratio k (%)
7.1. Influence of Transverse Reinforcement
Ratio
The analyses as illustrated in Figure 5 were conducted to
assess the influence of transverse reinforcement on
effective moment of inertia. Two column axial loads of
0.05 fc′ Ag and 0.20 fc′ Ag were considered. Five types of
transverse reinforcement, R6-125 mm, R8-125 mm, R8100 mm, R10-125 mm and R10-100 which correspond
to five transverse reinforcement ratios ρv of 0.129%,
0.230%, 0.287%, 0.359% and 0.449% respectively,
were investigated.
Figure 5 shows that with an increase in transverse
reinforcement content from 0.129% to 0.230%, 0.287%,
0.359% and 0.449%, stiffness ratios rose slightly by
approximately 3.4%, 4.5%, 5.5%, 6.4%, respectively for
columns under an axial load of 0.20 fc′ Ag. The stiffness
ratios increased by approximately 2.3%, 3.6%, 4.9%,
6.1% for columns under an axial load of 0.05 fc′ Ag with
an increase in transverse reinforcement content from
0.129% to 0.230%, 0.287%, 0.359% and 0.449%,
respectively. This suggested that the effect of transverse
reinforcement ratios on stiffness ratios is insignificant.
In addition, Figure 5 shows a clear indication that
stiffness ratio increases with an increase in column axial
load.
15
10
15
10
5
5
0.20 f ′c Ag
0.05 f ′c Ag
0.20 f 'c Ag
0.05 f 'c Ag
0
0.1
0.2
0.3
0.4
Transverse reinforcement ratio ρv (%)
Figure 5. Influences of transverse reinforcement ratios
on stiffness ratio
Advances in Structural Engineering Vol. 15 No. 2 2012
0.5
0
1.5
2
2.5
3
Longitudinal reinforcement ratio ρl (%)
3.5
Figure 6. Influences of longitudinal reinforcement ratio
on stiffness ratio
271
25
25
20
20
Stiffness ratio k (%)
Stiffness ratio k (%)
Initial Stiffness of Reinforced Concrete Columns with Moderate Aspect Ratios
15
10
5
0
350
15
10
5
0.20 f ′c Ag
0.05 f ′c Ag
0.05 f ′c Ag
0.20 f ′c Ag
0
400
450
500
Yield strength of longitudinal bars fyl (MPa)
550
20
Figure 7. Influences of yield strength of longitudinal reinforcing
bars on stiffness ratio
60
Figure 8. Influences of concrete compressive strength
on stiffness ratio
analytical results suggested that the influences of yield
strength of longitudinal reinforcing bars on stiffness
ratios are negligible.
50
45
40
Stiffness ratio k (%)
7.4. Influence of Concrete Compressive
Strength
Figure 8 illustrates the influence of concrete compressive
strength on stiffness ratios for two different axial loads of
0.05 fc′ Ag and 0.20 fc′ Ag. The concrete compressive
strengths investigated were 25 MPa, 35 MPa, 45 MPa,
and 55 MPa. For both axial loads, with an increase in
concrete compressive strength, no significant changes on
stiffness ratios were observed.
30
40
50
Concrete compressive strength f ′c (MPa)
35
30
25
20
a/h = 1.50
a/h = 1.80
a/h = 2.10
a/h = 2.43
a/h = 2.70
a/h = 3.00
15
10
5
0
0
0.1
0.2
0.3
0.4
0.5
0.6
Axial load ratio f ′c Ag
7.5. Influence of Aspect Ratio
Figure 9 and Table 3 show the influence of aspect ratio
on stiffness ratios of RC columns. Six aspect ratios of
Figure 9. Influences of aspect ratio on
stiffness ratio
Table 3. Stiffness ratio for various aspect ratios and axial load ratios
a/h
P / fc′Ag
0.00
0.05
0.10
0.15
0.20
0.25
0.30
0.35
0.40
0.45
0.50
0.55
0.60
272
1.50
1.80
2.10
2.43
2.70
3.00
11.22
12.27
13.32
14.23
15.17
16.43
17.90
19.78
22.30
24.74
26.82
28.56
30.06
13.30
14.24
15.45
16.54
17.66
19.23
21.83
24.85
27.57
29.70
31.73
33.37
34.74
15.69
16.64
17.78
18.85
20.13
22.56
25.70
28.77
31.27
33.27
35.28
36.82
38.30
18.27
19.24
20.23
21.46
22.83
25.61
29.06
31.91
34.22
36.12
38.14
39.86
41.42
20.60
21.13
22.21
23.37
24.80
27.75
31.30
33.85
36.05
38.01
40.16
41.94
43.66
23.50
23.90
24.20
25.27
26.70
29.76
33.22
35.50
37.73
39.81
42.08
43.95
45.77
Advances in Structural Engineering Vol. 15 No. 2 2012
Cao Thanh Ngoc Tran and Bing Li
1.50, 1.80, 2.10, 2.43, 2.70, and 3.00 were investigated.
In general, the stiffness ratio increased with an increase
in aspect ratio.
Figure 9 shows that with an increase in aspect ratio
from 1.50 to 1.80, 2.10, 2.43, 2.70, and 3.00; the
stiffness ratios of columns without axial loads rose by
approximately 18.5%, 39.8%, 62.8%, 83.6%, 109.4%,
respectively. Similar trends were observed for the
columns with an axial load ratio of 0.20. The stiffness
ratios increased by approximately 15.6%, 27.4%,
37.8%, 45.2% and 52.3% for columns under an axial
load of 0.60 fc′ Ag with an increase in aspect ratio from
1.50 to 1.80, 2.10, 2.43, 2.70, and 3.00, respectively.
This suggested that the aspect ratio significantly
influences the stiffness ratio.
7.6. Influence of Axial Load
It is generally recognized that the presence of column
axial load can effectively increase the flexural strength
of columns and thus lead to larger initial flexural
stiffness, which results in a higher stiffness ratio. The
analyses as illustrated in Figure 10 and tabulated in
Table 3 were carried out to assess the influence of axial
load ratio on stiffness ratio The axial load ratio was
varied from 0 to 0.60.
In general, the stiffness ratio increased with an
increase in axial load ratio. Figure 10 showed that
with an increase in axial load ratio from 0 to 0.20,
0.40, and 0.60; the stiffness ratios for specimens with
an aspect ratio of 1.5 rose by approximately 35.2%,
98.7% and 167.9%, respectively. Similar trends were
observed for other aspect ratios. It can thus be
concluded that the axial load ratio significantly affects
the stiffness ratio.
50
45
Stiffness ratio k (%)
40
35
30
25
20
15
0.00 f ′c Ag
0.15 f ′c Ag
0.30 f ′c Ag
0.45 f ′c Ag
0.60 f ′c Ag
10
5
0
1.5
1.8
0.05 f ′c Ag
0.20 f ′c Ag
0.35 f ′c Ag
0.50 f ′c Ag
2.1
2.4
Aspect ratio a /h
0.10 f ′c Ag
0.25 f ′c Ag
0.40 f ′c Ag
0.55 f ′c Ag
2.7
Figure 10. Influences of axial load ratio on stiffness ratio
Advances in Structural Engineering Vol. 15 No. 2 2012
3
8. PROPOSED EQUATION FOR EFFECTIVE
MOMENT OF INERTIA OF RC COLUMNS
It is observed that the stiffness ratio apparently
increased with an increase in aspect ratios (Ra) and
axial load ratio (Rn). The transverse and longitudinal
reinforcement ratios, yield strength of longitudinal
bars and concrete compressive strength insignificantly
influenced the stiffness ratio of RC columns. For
simplicity, the influences of these factors were
ignored. Based on the results of the parametric study,
the stiffness ratio (κ) is given by the following
equation:
(
)
κ = 2.043 Rn2 + 2.961Rn + 1.739 ( 3.023 Ra + 2.573) (19)
Berry et al. (2004) collected a database of 400 tests of
RC columns, which contained the hysteretic response,
geometry, column axial load and material properties of
test specimens. This database provided the data needed
to evaluate the accuracy of the proposed equation for the
stiffness ratio. The verification was limited to the range
of the parametric study. The axial load was limited from
0 to 0.60 fc′ Ag, and the aspect ratio was limited from 1.5
to 3.0. Only rectangular columns tested in the doublecurvature configuration under unidirectional quasi-static
cyclic lateral loading were chosen. Details of the chosen
RC columns are tabulated in Table 4.
It was found that the average ratio of the
experimental to predicted stiffness ratio by the proposed
equation is 0.945 as shown in Figure 11 and Table 4,
showing a good correlation between the proposed
equation and experimental data. Therefore, the proposed
equation may be suitable as an assessment tool to
calculate the stiffness ratio of RC columns within the
range of the parametric study.
The stiffness ratio of columns calculated based on ACI
318-2008 (2008), FEMA 356 (2000), ASCE 41 (2007),
Paulay and Priestley (1992), and Elwood and Eberhard
(2009) are also shown in Table 4. The mean ratio of the
experimental to predicted stiffness ratio and its coefficient
of variation were 0.406 and 0.136, 0.409 and 0.095, 0.399
and 0.097, 0.571 and 0.151, 0.380 and 0.096, and 0.855
and 0.202 for ACI 318-2008 (2008a), ACI 318-2008
(2008b), FEMA 356 (2000), ASCE 41 (2007), Paulay and
Priestley (1992), and Elwood and Eberhard (2009)
respectively. Comparison of available models with
experimental data indicated that the proposed equation
produced a better mean ratio of the experimental to
predicted stiffness ratio than other models. It is to be noted
that the proposed equation gives slightly conservative
estimation of stiffness ratio in some cases and acceptable
small underestimation in other cases.
273
274
Esaki et al. (1985)
Priestley et al. (1994)
Ohno et al. (1984)
Umehara et al. (1982)
Bett et al. (1985)
Pujol et al. (2002)
Arakawa et al. (1989)
Ohue et al. (1985)
Tran et al. (2009)
Ra
2.43
2.43
1.71
1.71
1.71
1.71
1.50
2.00
2.00
1.50
1.96
1.50
2.25
2.25
2.25
2.25
2.25
2.25
2.25
2.25
2.25
2.25
2.25
2.25
2.25
2.25
2.00
2.00
1.50
2.00
2.00
2.00
2.00
Mean
Coefficient of Variation
SC-2.4-0.20
SC-2.4-0.50
SC-1.7-0.05
SC-1.7-0.20
SC-1.7-0.35
SC-1.7-0.50
No. 102
2D16RS
4D13RS
CA025C
CUW
No. 1-1
No. 10-2-3N
No. 10-2-3S
No. 10-3-1.5N
No. 10-3-1.5S
No. 10-3-3N
No. 10-3-3S
No. 10-3-2.25N
No. 10-3-2.25S
No. 20-3-3N
No. 20-3-3S
No. 10-2-2.25N
No. 10-2-2.25S
No. 10-1-2.25N
No. 10-1-2.25S
R1A
R3A
R5A
H-2-1/5
HT-2-1/5
H-2-1/3
HT-2-1/3
Specimen
0.200
0.500
0.050
0.200
0.350
0.500
0.333
0.143
0.153
0.257
0.162
0.104
0.085
0.085
0.089
0.089
0.096
0.096
0.105
0.105
0.158
0.158
0.082
0.082
0.078
0.078
0.054
0.059
0.063
0.200
0.200
0.334
0.333
Rn
23.9
37.0
14.6
18.7
23.4
28.9
20.9
19.0
19.3
18.7
19.3
14.7
18.8
18.8
18.9
18.9
19.1
19.1
19.4
19.4
21.2
21.2
18.7
18.7
18.6
18.6
16.4
16.6
13.7
20.8
20.8
25.5
25.4
κp
17.8
21.1
11.2
11.8
13.1
15.4
16.7
14.5
15.2
14.4
16.2
11.2
17.9
19.6
18.6
21.2
19.4
20.4
21.4
20.6
22.7
25.0
18.8
20.2
18.8
19.5
20.0
20.3
17.1
23.6
19.6
28.1
26.1
0.945
0.202
κ exp
0.745
0.570
0.767
0.631
0.560
0.533
0.799
0.763
0.788
0.770
0.839
0.762
0.952
1.043
0.984
1.122
1.016
1.068
1.103
1.062
1.071
1.179
1.005
1.080
1.011
1.048
1.22
1.223
1.248
1.135
0.942
1.102
1.028
0.406
0.136
κp
κ ixp
0.254
0.301
0.319
0.169
0.188
0.220
0.426
0.349
0.389
0.394
0.374
0.16
0.511
0.56
0.531
0.606
0.554
0.583
0.306
0.294
0.324
0.357
0.537
0.577
0.537
0.557
0.571
0.580
0.489
0.337
0.280
0.401
0.373
0.409
0.095
κ ACI ( a )
κ ixp
0.355
0.421
0.223
0.236
0.263
0.308
0.596
0.488
0.544
0.552
0.524
0.224
0.358
0.392
0.372
0.424
0.388
0.408
0.428
0.412
0.454
0.500
0.376
0.404
0.376
0.390
0.400
0.406
0.342
0.472
0.392
0.562
0.522
0.399
0.097
κ ACI ( b)
κ ixp
Table 4. Experimental verification of the proposed equation
κ ixp
0.355
0.301
0.223
0.236
0.239
0.220
0.559
0.488
0.544
0.552
0.524
0.224
0.358
0.392
0.372
0.424
0.388
0.408
0.428
0.412
0.454
0.500
0.376
0.404
0.376
0.390
0.400
0.406
0.342
0.472
0.392
0.526
0.489
0.571
0.151
κ FEMA
κ ixp
0.444
0.301
0.372
0.295
0.239
0.220
0.559
0.713
0.795
0.604
0.724
0.368
0.597
0.653
0.62
0.707
0.647
0.680
0.713
0.687
0.634
0.698
0.627
0.673
0.627
0.650
0.667
0.677
0.570
0.590
0.490
0.526
0.489
0.380
0.096
κ ASCE
κ ixp
0.305
0.263
0.236
0.203
0.19
0.193
0.441
0.569
0.634
0.443
0.473
0.257
0.359
0.394
0.371
0.423
0.383
0.403
0.417
0.402
0.412
0.454
0.379
0.407
0.381
0.396
0.42
0.424
0.355
0.405
0.337
0.414
0.384
0.855
0.202
κ PP
κ ixp
0.793
0.525
0.560
0.590
0.553
0.507
0.493
0.725
0.76
0.591
0.81
0.56
0.895
0.98
0.93
1.06
0.97
1.02
1.07
1.03
1.087
1.197
0.94
1.01
0.94
0.975
0.928
0.922
0.855
1.116
0.922
0.982
0.914
κ EE
Initial Stiffness of Reinforced Concrete Columns with Moderate Aspect Ratios
Advances in Structural Engineering Vol. 15 No. 2 2012
Cao Thanh Ngoc Tran and Bing Li
REFERENCES
40
Proposed stiffness ratio (%)
35
30
25
20
15
10
5
0
0
5
10
15
20
25
30
Experimental stiffness ratio (%)
35
40
Figure 11. Comparisons between experimental and proposed
stiffness ratio
9. CONCLUSIONS
This paper presents an analytical method to estimate the
initial stiffness of RC columns. A comprehensive
parametric study is carried out based on the proposed
method to investigate the influences of several critical
parameters. A simple equation to estimate the initial
stiffness of RC columns is also proposed. The following
provides specific findings of the paper:
Comparisons made between the analytical results
and the experimental results of the six specimens tested
in Tran et al.’s study (2009) show relatively good
agreement. This shows the applicability and accuracy
of the proposed method to estimate initial stiffness of
RC columns.
The parametric study based on the proposed
method shows that the stiffness ratio (κ) increases
along with aspect ratios (Ra) and axial load ratio (Rn).
The transverse and longitudinal reinforcement ratios,
yield strength of longitudinal bars and concrete
compressive strength showed a negligible impact on
the stiffness ratio.
It was found that by the proposed equation, the
average ratio of the experimental to predicted stiffness
ratio is 0.945, showing a good correlation between the
proposed equation and the experimental data. The
proposed equation may be suitable as an assessment
tool to calculate the stiffness ratio of RC columns
within the range of the parametric study, where the
axial load was limited from 0 to 0.60 fc′ Ag, and the
aspect ratio limited from 1.5 to 3.0. Only rectangular
columns tested in the double-curvature configuration
under unidirectional quasi-static cyclic lateral loading
were chosen.
Advances in Structural Engineering Vol. 15 No. 2 2012
ACI 318 (2008). Building Code Requirements for Structural
Concrete (ACI 318-08) and Commentary, American Concrete
Institute, Farmington Hills, Michigan, USA.
ASCE 41 (2007). Seismic Rehabilitation of Existing Buildings,
American Society of Civil Engineers, Reston, VA, USA.
Arakawa, T., Arai, Y., Mizoguchi, M. and Yoshida, M. (1989).
“Shear resisting behavior of short reinforced concrete columns
under biaxial bending-shear”, Transactions of the Japan
Concrete Institute, Vol. 11, pp. 317–324.
Bett, B.J., Klingner, R.E. and Jirsa J.O. (1985). Behavior of
Strengthened and Repaired Reinforced Concrete Columns Under
Cyclic Deformations, PMFSEL Report No. 85-3, Department of
Civil Engineering, University of Texas at Austin, Austin, Texas,
USA.
Berry, M.P., Parrish, M. and Eberhard, M.O. (2004). PEER
Structural Performance Database User’s Manual, Pacific
Earthquake Engineering Research Center, University of
California, Berkeley, USA.
FEMA 356 (2000). Prestandard and Commentary for the Seismic
Rehabilitation of Buildings, Federal Emergency Management
Agency, Washington DC, USA.
Elwood, K. and Eberhard, M.O. (2009). “Effective stiffness of
reinforced concrete columns”, ACI Structural Journal, Vol. 106,
No. 4, pp. 476–484.
Esaki, F. (1996) “Reinforcing effect of steel plate hoops on ductility
of R/C column”, Proceedings of the 11th World Conference on
Earthquake Engineering, Acapulco, Mexico, June.
Ohno, T. and Nishioka, T. (1984). “An experimental study on energy
absorption capacity of columns in reinforced concrete structures”,
Proceedings of the JSCE: Structural Engineering/Earthquake
Engineering, Vol. 1, No. 2, pp. 137–147.
Ohue, M., Morimoto, H.F.S. and Morita, S. (1985). “The behavior of
RC short columns failing in splitting bond-shear under dynamic
lateral loading”, Transactions of the Japan Concrete Institute,
Vol. 7, pp. 293–300.
Park, R. and Paulay, T. (1975). Reinforced Concrete Structures,
John Willey & Sons, New York, USA.
Paulay, T. and Priestley, M.J.N. (1992). Seismic Design of
Reinforced Concrete Masonry Buildings, John Willey & Sons,
New York, USA.
Priestley, M.J.N., Seible, F., Xiao, Y. and Verma, R. (1994). “Steel
jacket retrofitting of reinforced conrete bridge columns for
enhanced shear strength - Part II: test results and comparison with
theory”, ACI Structural Journal, Vol. 91, No. 5, pp. 537–551.
Priestley, M.J.N., Seible, F. and Calvi, G.M. (1996). Seismic Design
and Retrofit of Bridge Structures, John Willey & Sons, New
York, USA.
Pujol, S. (2002). Drift Capacity of Reinforced Concrete Columns
Subjected to Displacement Reversals, PhD Thesis, Purdue
University, USA.
275
Initial Stiffness of Reinforced Concrete Columns with Moderate Aspect Ratios
Tran, C.T.N. (2010). Experimental and Analytical Studies on the
Seismic Behavior of RC Columns with Light Transverse
Reinforcement, PhD Thesis, Nanyang Technological University,
Singapore.
Umehara, H. and Jirsa, J.O. (1982). Shear Strength and
Deterioration of Short Reinforced Concrete Columns Under
276
Cyclic Deformations, PMFSEL Report No. 82-3, Department of
Civil Engineering, University of Texas at Austin, Austin, Texas,
USA.
Vecchio, F.J. and Collins, M.P. (1986). “The modified compressionfield theory for reinforced concrete elements subjected to shear”,
ACI Journal Proceedings, Vol. 83, No. 2, pp. 219–231.
Advances in Structural Engineering Vol. 15 No. 2 2012