DSpace at VNU: Properties of PbS nanocrystals synthesized by sonochemical and sonoelectrochemical methods
Bạn đang xem bản rút gọn của tài liệu. Xem và tải ngay bản đầy đủ của tài liệu tại đây (1.06 MB, 5 trang )
e-Journal of Surface Science and Nanotechnology
27 December 2011
Conference - IWAMN2009 -
e-J. Surf. Sci. Nanotech. Vol. 9 (2011) 494-498
Properties of PbS Nanocrystals Synthesized by Sonochemical and
Sonoelectrochemical Methods∗
Le Van Vu,† Sai Cong Doanh, Le Thi Nga, and Nguyen Ngoc Long
Center for Materials Science, Hanoi University of Science,
Vietnam National University, Hanoi, 334 Nguyen Trai, Thanh Xuan, Hanoi, Vietnam
(Received 22 November 2009; Accepted 18 March 2011; Published 27 December 2011)
Lead sulfide nanocrystals have been synthesized via sonochemical and sonoelectrochemical methods from precursors such as lead acetate (Pb(Ac)2 : Pb(CH3 COO)2 ·3H2 O), thioacetamide (TAA: CH3 CSNH2 ) and cetyltrimethyl
ammonium bromide (CTAB: C19 H42 BrN). The samples were characterized by X-ray diffraction, high resolution
transmission electron microscopy, selected area electron diffraction and ultraviolet-visible absorption spectroscopy.
The results showed that the samples prepared by sonoelectrochemical technique have a cluster-like form composed
of the small nanocrystals with the size of 6-10 nm, while the samples prepared by sonochemical technique constituted of the nanoparticles with the size of about 20 nm, mixed with the nanorods of 20 nm in width and 80 nm
in length. All the PbS nanocrystals have a face-centered cubic crystal structure. The optical absorption spectra
exhibit a strong blue-shift due to the quantum size effect. [DOI: 10.1380/ejssnt.2011.494]
Keywords: Nanocrystals; Lead sulfide; Sonochemical; Sonoelectrochemical methods
I.
INTRODUCTION
Lead sulfide (PbS) is an important IV-VI semiconductor compound. Bulk PbS has a cubic (rock salt) crystal
structure and a narrow direct band gap (0.4 eV) at the
L point of the Brillouin zone [1]. PbS is used for fabricating infrared detectors, Pb2+ ion-selective sensors. In
the past decades, there has been much interest in synthesis and characterization of nanoscale PbS because of
its large exciton Bohr radius (∼18 nm). Indeed, it is relatively easy to prepare particles of ∼18 nm size and it could
be expected that these PbS nanoparticles will exhibit a
strong quantum confinement effect. It was reported that
the band gap of PbS can be widened to the visible region
by forming nanoparticles [2–6]. PbS nanoparticles are
hence promising materials in electroluminescent devices
such as light-emitting diodes and luminescent display devices. PbS nanostructures with different morphologies
have been prepared including particles [3–5], wires [7],
rods [6, 8], tubes [9], and hollow spheres [10] by different methods such as wet chemistry [4, 6, 7], solvothermal [11], thermal decomposition [12], microwave irradiation [5], electrodeposition [13], sonochemical [5, 9, 10],
and photochemical using UV- or γ- irradiation [3, 14].
Sonochemistry is the application of ultrasound to chemical reactions and processes. In the past decades, sonochemistry was applied in materials science as a very useful synthetic method. It was discovered as early as 1934
that the application of ultrasonic energy could increase
the rate of electrolytic water cleavage. The effects of ultrasonic radiation on chemical reactions are due to the
very high temperatures (∼5000 K) and pressures (∼1800
atm), which develop in and around the collapsing bubble [15, 16]. However, only recently the potential benefit of combining sonochemistry with electrochemistry has
been increasingly studied. Some of these beneficial effects
∗ This
paper was presented at the International Workshop on Advanced Materials and Nanotechnology 2009 (IWAMN2009), Hanoi
University of Science, VNU, Hanoi, Vietnam, 24-25 November, 2009.
† Corresponding author:
include acceleration of mass transport, cleaning and degassing of the electrode surface, and an increased reaction
rate [17, 18].
In this paper we report the synthesis of PbS nanocrystals by both sonochemical and sonoelectrochemical methods. X-ray diffraction (XRD), high resolution transmission electron microscopy (HRTEM) and selected area electron diffraction (SAED) analyses showed that the prepared PbS samples possess a cubic rock salt crystal structure. Ultraviolet-visible (UV-vis) absorption spectra indicated a strong blue-shift in the PbS nanocrystals due to
the quantum confinement effect.
II.
A.
EXPERIMENTAL
Synthesis of PbS nanocrystals
In our experiment, all reagents were of analytical grade
and were used without any further purification. Preparation of precursor solutions was as follows: Solution
of 0.2 M lead acetate (Pb(Ac)2 : Pb(CH3 COO)2 ·3H2 O)
and solution of 0.2 M thioacetamide (TAA: CH3 CSNH2 )
were mixed in a certain mole ratio. An appropriate amount of 0.2 M cetyltrimettyammonium bromide
(CTAB: C19 H42 BrN) solution was added to the mixture.
The solution mixture was sonicated for 5 min. The asprepared mixture was transferred to a glass vessel for executing sonochemical or sonoelectrochemical process. The
sonochemical or sonoelectrochemical process was carried
out at room temperature for 60 min under flowing nitrogen gas to remove oxygen. When the reaction finished, a
black precipitate occurred. The precipitate was separated
by centrifugation at the rate of 15000 rpm, washed repeatedly with distilled water and absolute ethanol to remove
the residue of organic solvents. The final products were
dried in air at 60◦ C for 6 h.
B.
Instruments
The schematics of the experimental setup assembled
for sonochemical and sonoelectrochemical experiments are
c 2011 The Surface Science Society of Japan ( />ISSN 1348-0391 ⃝
494
e-Journal of Surface Science and Nanotechnology
Volume 9 (2011)
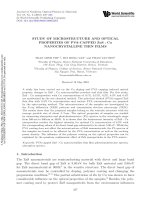
FIG. 1: Experimental setup for (a) sonochemical and (b) sonoelectrochemical experiments, (c) Schematic representation of
(above) the current and (below) the ultrasonic pulse forms.
shown in Fig. 1. A VCX 750 ultrasonic generator (Tihorn 20 kHz, 1.3 cm diameter and 15 cm long) worked
as the ultrasound source. Ti-horn was immersed by 1.5
cm in the reaction solution. In the sonochemical experiment, the ultrasonic pulse had the duration of 5 s and the
repetition period of 10 s.
In the case of sonoelectrochemistry, two platinum plates
(1 cm × 1 cm × 0.05 cm) were used as electrodes. The
current pulse possessed the duration te ∼ 0.3 s and the
repetition period T ∼ 1.3 s. The ultrasonic pulse had the
length ts ∼ 0.2 s and was on right at the moment the
current pulse was off (see Fig. 1(c)).
C.
Characterization of the samples
The crystal structure of the PbS samples was analyzed by using an x-ray diffractometer (SIEMENS D5005,
Bruker, Germany) with Cu-Kα1 (λ = 0.154056 nm) irradiation. The morphology of the samples was characterized
by using a high resolution transmission electron microscope (FEI Tecnai TF20 FEG TEM). The composition of
the samples was determined by an energy dispersive Xray (EDX) spectrometer (EDS, OXFORD ISIS 300) attached to the JEOL-JSM 5410 LV scanning electron microscope. UV-vis absorption spectra of the nanoparticle
containing solutions were collected with a Shimadzu UV
2450 PC spectrometer. Diffuse reflection spectroscopy
measurements of the PbS powders were carried out on
an UV-VIS-NIR Cary 5G spectrophotometer. Spectra
were recorded at room temperature. Absorption spectra of the samples were obtained from the diffuse reflectance values by using the Kubelka-Munk function [19]:
F (R) = (1 − R)2 /2R = K/S where R, K and S are the
reflection, the absorption and the scattering coefficient,
respectively.
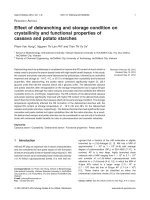
III.
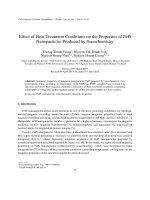
FIG. 2: (a) XRD pattern and (b) energy dispersive x-ray
spectrum of the PbS samples prepared by sonoelectrochemical method.
constant determined from XRD pattern is a = 5.933 ˚
A in
good agreement with the value of 5.936 ˚
A in JCPDSICDD 1993, No.5-592. The crystal size of about 6 nm
has been obtained from the following Debye - Scherrer
relations [20]:
RESULTS AND DISCUSSION
L=
A.
The PbS samples prepared by
sonoelectrochemical method
XRD pattern of the PbS nanoparticles is shown in Fig.
2(a). Diffraction peaks at 25.7◦ , 29.8◦ , 42.7◦ , and 50.6◦
correspond to the (111), (200), (220), and (311) lattice
planes of the PbS face-centered cubic structure. Lattice
0.9λ
β cos θ
where β is the full width at half maximum (FWHM) in
radians of the diffraction peaks, θ is the Bragg’s diffraction angle and λ is the wavelength for the Kα1 component
of the employed copper radiation (1.54056 ˚
A). The EDX
spectrum showed in Fig. 2(b) indicated that there are
only elements Pb and S in the prepared PbS samples.
(J-Stage: />
495
Vu, et al.
Volume 9 (2011)
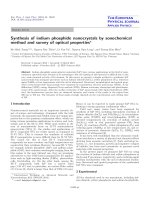
FIG. 3: (a) TEM image, (b) HRTEM image, and (c) SAED image of the PbS nanocrystals prepared by sonoelectrochemical
method. The inset in Fig. 3(a) is a low magnified image of the PbS samples. The inset in Fig. 3(b) is the fast Fourier transform
pattern of the (111) planes.
FIG. 4: UV-vis absorption spectrum of the PbS nanocrystals
dispersed in water. The inset is the plot of (αhν)2 as a function
of photon energy hν.
from the XRD analysis. The fast Fourier transform (FFT)
pattern of the HRTEM image shown in the inset of Fig.
3(b) also confirmed a face-centered cubic structure. The
SAED image depicted in Fig. 3(c) consisted of diffraction
rings, which indicates that the PbS nanocrystals arrange
in random manner without priority direction. In particular, one can observe more diffraction rings in the SAED
pattern than these in XRD pattern. To measure UV-vis
absorption, the PbS nanocrystals were dispersed in water. A typical UV-vis absorption spectrum of the PbS
nanocrystals is presented in Fig. 4.
The PbS nanocrystals start strong absorption from
the wavelength of 600 nm, in agreement with previous
work [14]. The relation between the absorption coefficients (α) and the incident photon energy (hν) for the
case of allowed direct transition is written as [21]:
αhν = A(hν − Eg )1/2
where A is a constant and is the bandgap of the material.
The plot of the (αhν)2 versus hν for the PbS nanocrystals
is represented in the inset of Fig. 4. By extrapolating the
straight portion of the graph on hν axis at α = 0, we
found the bandgap of the PbS to be 2.79 eV, which is
much larger than that of bulk PbS. This indicates that
the PbS nanocrystals exhibit the quantum confinement
effect due to the decrease of the crystal size.
B.
FIG. 5: Typical XRD pattern of the PbS nanocrystals prepared by sonochemical method.
Typical TEM, HRTEM images and SAED pattern of
the PbS samples are shown in Fig. 3. It can be seen
from Fig. 3(a) and the inset in it, the nanoparticles agglomerate, forming nanoclusters with the size of about 50
nm. Figure 3(b) represents the magnified HRTEM image of the PbS nanoparticles with the lattice fringes of
the (111) planes. The spacing of the adjacent (111) lattice planes in the HRTEM image is found to be 3.35 ˚
A,
which is in agreement with the value of 3.45 ˚
A obtained
496
The PbS samples prepared by sonochemical
method
XRD pattern depicted in Fig. 5 points out that the
PbS nanocrystals prepared by sonochemical method also
possess face-centered cubic structure. Diffraction peaks
correspond to the (111), (200), (220), (311), (222), (400),
and (331) lattice planes. Lattice constant calculated from
XRD pattern is a = 5.962 ˚
A. The size of PbS nanocrystals
determined according to Debye-Scherrer formula is about
10 nm.
Representative TEM, HRTEM images and SAED pattern of the PbS samples are shown in Fig. 6. As can be
seen from Fig. 6(a), the nanoparticles are clearly separated each from other, (some of them have a cubic form
with the size of 10 nm), and mixed with PbS nanorods
(J-Stage: />
e-Journal of Surface Science and Nanotechnology
Volume 9 (2011)
FIG. 6: (a) TEM image, (b) HRTEM image, and (c) SAED image of the PbS nanocrystals prepared by sonochemical method.
The inset in Fig. 6(b) is the fast Fourier transform pattern of the (111) planes.
water. From the plot of the (αhν)2 as a function of hν,
one found the value of the bandgap to be 3.22 eV, which
is lower than the value of 3.49 eV obtained by previous
paper [5]. To verify the blue-shift of the absorption edge,
we measure diffuse reflection spectra of the PbS nanopowders. Absorption spectra of the samples were obtained
from the diffuse reflectance values by using the KubelkaMunk function. Typical spectrum is presented in Fig.
7(b). The spectrum exhibits a sharp absorption edge and
an onset of absorption at the wavelength of 365 nm. From
the plot of the (αhν)2 as a function of hν, one found the
value of the bandgap to be 3.26 eV, which is in good agreement with the results in the case of the PbS nanoparticles
dispersed in water.
IV.
FIG. 7: (a) UV-vis absorption spectrum of the PbS nanocrystals dispersed in water, (b) UV-vis absorption spectrum of the
PbS nanopowders obtained from the data of diffuse reflection
measurement. The insets are the plots of (αhν)2 versus photon
energy hν.
with the width approximate to the size of particles and
fairly long length. Aspect ratio (length-to-width ratio)
has the values from 4 to 5. The distance between the
adjacent (111) lattice planes in the HRTEM image (see
Fig. 6(b)) is found to be 3.45 ˚
A, which is in good agreement with the value of 3.45 ˚
A obtained from the XRD
analysis. The SAED image presented in Fig. 6(c) consisted of diffraction rings, which indicates that the PbS
nanocrystals arrange in random manner.
Figure 7(a) shows the UV-vis absorption spectrum at
room temperature of the PbS nanoparticles dispersed in
CONCLUSION
PbS nanocrystals have been synthesized via sonochemical and sonoelectrochemical methods from precursors
such as lead acetate (Pb(Ac)2 : Pb(CH3 COO)2 ·3H2 O),
thioacetamide (TAA: CH3 CSNH2 ) and cetyltrimethyl
ammonium bromide (CTAB: C19 H42 BrN). The results of
XRD, HRTEM, and SAED analysis indicated that all the
PbS nanocrystals possess a face-centered cubic structure.
The samples prepared by sonoelectrochemical technique
are the nanoclusters with the size of ∼50 nm and composed of the small nanocrystals with the size of 6 - 10
nm, while the samples prepared by sonochemical technique constituted of the nanoparticles with the size of
about 20 nm, mixed with the nanorods of 20 nm in width
and 80 nm in length. The UV-vis optical absorption spectra exhibit a strong blue-shift due to the quantum size
effect. The bandgap of the samples prepared by sonoelectrochemical and sonochemical methods are determined to
be 2.79 eV and 3.26 eV, respectively.
Acknowledgments
This work is financially supported by Ministry of Science and Technology of Vietnam (Project No 103.02.51.09
from NAFOSTED) and Vietnam National University,
Hanoi (TRIG A project No. QGTD 10.24). The authors
thank Dr Ngo Duc The for HRTEM and SAED measurements, Dr Nguyen Hoang Nam for diffuse reflection mea-
(J-Stage: />
497
Vu, et al.
Volume 9 (2011)
surement.
[1] Landolt-Bornstein, Group III Condensed Matter, Volume 41C, Non-Tetrahedrally Bonded Elements and Binary
Compounds I (Springer-Verlag, 1998), p. 1.
[2] Y. Wang, A. Suna, W. Mahler, and R. J. Kasowski, J.
Chem. Phys. 87, 7315 (1987).
[3] N. B. Egorov, L. P. Eremin, V. F. Usov, and A. M. Larionov, High Energy Chem. 41, 251 (2007).
[4] J. H. Warner, E. Thomsen, A. RWatt, N. R. Heckenberg, and H. Rubinsztein-Dunlop, Nanotechnology 16,
175 (2005).
[5] Y. Zhao, X. H. Liao, J. M. Hong, and J. J. Zhu, Mater.
Chem. Phys. 87, 149 (2004).
[6] W. P. Lim, H. Y. Low, and W. S. Chin, J. Phys. Chem.
B 108, 13093 (2004).
[7] D. Yu, D. Wang, Z. Meng, J. Lu, and Y. J. Qian, J. Mater.
Chem. 12, 403 (2002).
[8] S. Wang, and S. Yang, Langmuir 16, 389 (2000).
[9] S. F. Wang, F. Gu, M. K. Lu, G. J. Zhou, and A. Y.
Zhang, J. Cryst. Growth 289, 621 (2006).
[10] S. F. Wang, F. Gu, and M. K. Lu, Langmuir 22, 398
(2006).
[11] L. Xu, W. Q. Zhang, Y. W. Ding, W. C. Yu, J. Y. Xing, F.
498
Q. Li, and Y. T. Qian, J. Cryst. Growth 273, 213 (2004).
[12] S. M. Lee, Y. W. Jun, S. N. Cho, and J. W. Cheon, J.
Am. Chem. Soc. 124, 11244 (2002).
[13] M. Sharon, K. S. Ramaiah, M.l. Kumar, M. NeumannSpallart, and C. Levy-Clement, J. Electroanal. Chem.
436, 49 (1997).
[14] X. Changqi, Z. Zhicheng, W. Hailong, and Y. Qiang,
Mater. Sci. Engin. B 104, 5 (2003).
[15] E. B. Flint and K. S. Suslick, Science 253, 1397 (1991).
[16] K. S. Suslick, S. B. Choe, A. A. Cichowlas, and M. W.
Grinstaff, Nature 353, 414 (1991).
[17] T. J. Mason, J. P. Walton, and D. J. Lorimer, Ultrasonics
28, 333 (1990).
[18] F. Marken and R. Compton, Ultrasonics Sonochem. 3,
S131 (1996).
[19] N. N. Yamashita, J. Phys. Soc. Jpn. 35, 1089 (1973).
[20] B. E. Warren, X-ray Diffraction (Dover publications, Inc.,
New York, 1990), p. 253.
[21] J. I. Pankove, Optical Processes in Semiconductors
(Prentice-Hall Inc., 1971), p. 36.
(J-Stage: />