DSpace at VNU: The optical properties and energy transition process in nanocomposite of polyvinyl-pyrrolidone polymer and Mn-doped ZnS
Bạn đang xem bản rút gọn của tài liệu. Xem và tải ngay bản đầy đủ của tài liệu tại đây (857.11 KB, 13 trang )
Opt Quant Electron (2013) 45:147–159
DOI 10.1007/s11082-012-9611-y
The optical properties and energy transition process in
nanocomposite of polyvinyl-pyrrolidone polymer and
Mn-doped ZnS
Thi Tran Minh · Ben Pham Van · Thai Dang Van ·
Hien Nguyen Thi
Received: 22 February 2012 / Accepted: 4 August 2012 / Published online: 15 August 2012
© Springer Science+Business Media, LLC. 2012
Abstract This study has been carried out on the optical properties of polyvinyl-pyrrolidone
(PVP), the energy transition process in nanocomposite of PVP capped ZnS:Mn nanocrystalline and the influence of the PVP concentration on the optical properties of the PVP
capped ZnS:Mn nanocrystalline thin films synthesized by the wet chemical method. The
microstructures of the samples were investigated by X-ray diffraction, the atomic absorption
spectroscopy, and transmission electron microscopy. The results showed that the prepared
samples belonged to the sphalerite structure with the average particle size of about 2–3 nm.
The optical properties of samples are studied by measuring absorption, photoluminescence
(PL) spectra and time-resolved PL spectra in the wavelength range from 200 to 700 nm at
300 K. From data of the absorption spectra, the absorption edge of PVP polymer was found
about of 230 nm. The absorption edge of PVP capped ZnS:Mn nanoparticles shifted from 322
to 305 nm when the PVP concentration increases. The luminescence spectra of PVP showed
a blue emission with peak maximum at 394 nm. The luminescence spectra of ZnS:Mn–PVP
exhibits a blue emission with peak maximum at 437 nm and an orange–yellow emission of
ion Mn2+ with peak maximum at 600 nm. While the PVP coating did not affect the microstructure of ZnS:Mn nanomaterial, the PL spectra of the PVP capped ZnS:Mn samples were
found to be affected strongly by the PVP concentration.
Keywords
Nanocomposite · Time-resoled PL spectra · Absorption spectra · PVP
1 Introduction
Despite intensive research on conductivity, local domain orientation and molecular order
in organic semiconductor thin films (McNeill 2011), the relationship between morphology,
T. Tran Minh (B) · H. Nguyen Thi
Faculty of Physics, Hanoi National University of Education, Hanoi, Vietnam
e-mail:
B. Pham Van · T. Dang Van
Faculty of Physics, College of Science, Hanoi National University, Hanoi, Vietnam
123
148
T. Tran Minh et al.
chain structure and conductivity of the polymer is still poorly understood. Recently, researchers over the world have worked on the improvement of electrical conductivity, investigated
the charge transport and the energy band of a variety of polymers (polyazomethine, aliphatic–
aromatic co-polyimides). All determined parameters of the electrical conductivity and the
energy band have been found to be related to the influence of the polymer chain structure
(Jarzabek et al. 2002, 2008).
During the last few years, extensive experimental and theoretical studies of the luminescence, non-linear optical and electrical properties of a variety of polymers have been performed (Jarzabek et al. 2006, 2008) directed towards understanding the polymers’ material
science for use in electronic devices and displays (Hajduk et al. 2008; Cihaner and Algi 2009).
New progress has been made in the area of thermoelectric (TE) applications of conducting
polymers and related organic–inorganic composites (Dubey and Leclerc 2011; Sparavigna
et al. 2011). Others research efforts aimed to identify the role of additives in optimizing
the morphology of organic solar cells and discuss the role of bimolecular recombination in
limiting the efficiency of solar cells based on a small optical gap polymer (Agostinelli et al.
2011; Miller et al. 2011).
Recently, methods have been developed to cap the surfaces of the nanoparticles with
organic or inorganic groups, so that the nanoparticles are stable against agglomeration.
Among the inorganic semiconductor nanoparticles, zinc sulfide ZnS is an important II–
VI semiconductor, which has been researched extensively because of its broad spectrum of
potential applications, such as in catalysis and electronic and optoelectronic nanodevices.
Furthermore, luminescent properties of ZnS can be controlled using various dopants such as
Ni, Fe, Mn, Cu etc. (Yang et al. 2002, 2003; Hattori et al. 2005; Soni et al. 2009; Sharma et al.
2009; Huang et al. 2009; Pouretedal et al. 2009). They not only give luminescence in various
spectral regions, but also enhance the excellent properties of ZnS. In order to cap the ZnS
nanoparticles, some particular passivators of ZnS have been used, such as polyvinylalcohol
(PVA) (Sharif et al. 2010), and polyvinyl-pyrrolidone (PVP) (Wang et al. 2006; Maity et al.
2006; Ghosh et al. 2006; Panda et al. 2007; Pattabi et al. 2007). Understanding the effect
of capping on nanoparticles is one of the most important topics now-a-days. The influence
of surface passivation on luminescence quantum efficiency of ZnS:Mn2+ , ZnS:Cu2+ nanoparticles has been discussed when using sodium hexametaphosphate (SHMP), PVP, PVA
as capping agents (Murugadoss 2010; Manzoor et al. 2003; Murugadoss et al. 2010). The
capping agents of PVP and prevention of agglomeration for the ZnS:Mn nanoparticles were
shown clearly not only with low Mn concentration from 0.1 to 1 % (Porambo and Marsh
2009), but also at high Mn concentration from 10 to 40 % (Karar et al. 2004). But, the optical
properties and influence of PVP on the PL spectra of ZnS:Mn nanoparticles still were not
interested appropriately in these papers.
Despite this, there are only a few papers reporting the optical properties of PVP-capped
ZnS nanocomposite materials, and the energy transfer process from an organic surface adsorbate such as PVP to dopant ions such as Cu+ or Mn+ (Manzoor et al. 2003, 2004). Furthermore, the increase in optical intensity with PVP capping of ZnS:Mn nanoparticles has still
not yet been systematically investigated.
Thus, in this work we report the optical properties of PVP and the influence of the
PVP concentration on the optical properties of the PVP capped ZnS:Mn nanocrystalline
thin films synthesized by the wet chemical method with the optimal nominal Mn concentration (Thuy et al. 2008). Further, the influences of PVP concentration on the general features of the PL spectra and the process of energy transfer from the PVP to the
Mn2+ luminescent centers in doped ZnS as well as the optical band gap variation are also
discussed.
123
The optical properties and energy transition process
149
2 Experiments
The previous researching results on the optical properties of ZnS:Mn showed that the luminescence intensity increased considerably with the optimal nominal Mn concentration about
9–10 % (Thuy et al. 2008). So, in order to research a role and an effect of PVP on the optical
properties of ZnS:Mn, the PVP caped ZnS:Mn nanoparticles were synthesized with a constant nominal Mn concentration of 9 % atom, but different polymer-capped concentrations.
The initial chemical substance with high purity (99.9 %) was prepared as follows:
–
–
–
–
Polymer polyvinyl-pyrrolidone
Solution I: Zn(CH3 COO)2 .2H2 O 0.1M;
Solution II: Mn(CH3 COO)2 .4H2 O 0.1M and
Solution III: Na2 S.9H2 O 0.1M.
The solvent in both solutions I and II was a CH3 OH:H2 O mixture (1:1 by volume) whereas
water was used as the solvent in solution III.
2.1 Preparation of thin films from polymer capped ZnS:Mn nanocrystals
Firstly, ZnS nanoparticles were synthesized by the wet chemical method. Solutions I, II and
III were mixed at an optimal pH level and in an appropriate ratio in order to create the ZnS:Mn
material with 9 % nominal Mn concentration. The pH level being crucial to the formation of
ZnS:Mn precipitates, we derived and applied, by theoretical calculation, the optimal value of
pH = 5 where ZnS:Mn precipitates in mixed solutions while Zn(OH)2 does not. The reactions
are as follows:
Zn(CH3 COO)2 + Na2 S → ZnS + 2CH3 COONa
Mn(CH3 COO)2 + Na2 S → MnS + 2CH3 COONa
This precipitated ZnS, MnS nanoparticles was filtered by filtering system, then washed in
distilled water and ethanol several times. After washing, 0.5 g formed ZnS:Mn precipitates
were dispersed into 5 ml of CH3 OH:H2 O (1:1) solvent. This mixture was called solution A.
Similarly, 0.5 g of PVP was dissolved in 5 ml of C2 H5 OH:H2 O (1:1) solvent, and was called
solution B. After that these two solutions A and B were mixed with each other at various
volume ratios of (5:0), (5:1), (5:2), (5:3) and (5:4) under continuous stirring for 1 h at speed of
3,000 rpm. The PVP-capped Mn doped ZnS thin films were produced by spin-coating method
on glass substrate at a centrifugation speed of 3,000 rpm, then was heated at 80◦ C and cooled
to room temperature. By this way, the PVP-capped ZnS:Mn thin films with the difference
PVP concentrations were named respectively as ZnS:Mn–PVP (5:0), ZnS:Mn–PVP (5:1),
ZnS:Mn–PVP (5:2), ZnS:Mn–PVP (5:3) and ZnS:Mn–PVP (5:4).
2.2 Research methods
The real Mn2+ concentration in the ZnS:Mn was determined using the technique atomic
absorption spectroscopy AAS-600. The microstructure of these samples was investigated by
X-ray diffraction (XRD) using XD8 Advance Brukeding Diffractometer with CuKα radiation
of λ = 1.5406 Å and transmission Electron Microscopy (TEM) JEM 1010. Photoluminescence (PL) spectra, photoluminescence exciting (PLE) spectra and the absorption spectra
of these samples at room temperature were recorded by Fluorolog FL3-22, HP340-LP370
Fluorescence Spectrophotometer with an excitation wavelength of 325, 337 nm, xenon lamp
123
T. Tran Minh et al.
260
240
220
200
180
160
140
120
100
80
60
40
20
0
-20
-40
111
(a)
(b)
111
Lin (Cps)
Relative Intensity
150
ZnS
ZnS:Mn-1%
220
311
(b)
(a)
20
30
220
40
50
2 θ (degree)
60
70
80
311
b
a
a. ZnS:Mn-PVP(5:2)
b. ZnS:Mn-PVP(5:4)
20
30
40
50
2 θ (degree)
60
70
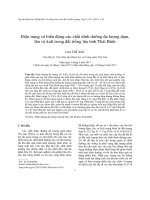
Fig. 1 The X-ray diffraction spectra of samples. a ZnS:Mn–PVP (5:2) and ZnS:Mn–PVP (5:4); b the ZnS:Mn,
pure ZnS nano-powders (inset)
XFOR-450 and JASCO-V670 spectrophotometer, respectively. The time-resoled PL spectra
of samples were measured by GDM-100 spectrophotometer using Boxca technique.
3 Results and discussion
3.1 Analysis of microstructure by XRD patterns, atomic absorption spectroscopy, TEM
Using the technique of atomic absorption spectroscopy, the real Mn2+ concentration
was determined about 0.94 % atom and much smaller than the initial nominal Mn2+
concentration. This issue can be explained by the small amount of Mn2+ ions taking part in the reaction to create precipitates. Opposite of this, other large amount of
Mn2+ can be lost in the centrifuging and washing process to receive ZnS and MnS
precipitates.
Figure 1 shows X-ray diffraction spectra of the ZnS:Mn, pure ZnS nano-powders (inset),
ZnS:Mn–PVP (5:2) and ZnS:Mn–PVP (5:4). The analyzed results show that all samples have
a sphalerite structure. The three peaks with strong intensity correspond to the diffraction
peaks of (111), (220) and (311). The quality of the samples is good with the lattice constant
a = 5.4 Å. The average size of the Mn-doped ZnS grains of about 3 nm was calculated by
Scherrer formula.
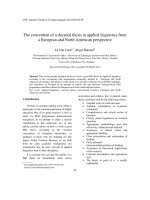
Alternatively, the average particle size in ZnS:Mn–PVP (5:4) sample is about 3 nm, as
measured in TEM (Fig. 2a). Figure 2a shows that these grains are ZnS:Mn nanoparticles
coated by polymer covers. Figure 2b gives the molecule structure and formula of PVP with
both N and C=O groups. In PVP, nitrogen is conjugated with adjacent carbonyl groups. Thus,
the role of PVP consists of (a) controlling the size of the particles by forming passivating
layers around the ZnS:Mn core due to coordination bond formation between the nitrogen
atom of PVP and Zn2+ , and (b) preventing agglomeration of the particles by the repulsive
force acting among the polyvinyl groups (Ghosh et al. 2006).
123
The optical properties and energy transition process
151
Fig. 2 a TEM image of
ZnS:Mn–PVP (5:4). b The
structure and formula of PVP
3.2 Photoluminescence spectra, absorption spectra of ZnS:Mn–PVP
For the ZnS:Mn nanoparticles with low nominal Mn concentration from 0 to 15 %, two PL
bands were observed and attributed to the defect-related emission of ZnS host and the Mn2+
emission (Peng et al. 2005; Thuy et al. 2008). Both the blue emission of ZnS host and the
orange emission of Mn2+ ions increase with the increase of Mn concentration, but the PL
intensity of Mn2+ centers has a substantial enhancement with Mn2+ ions as the effective
luminescence centers while the PL intensity of ZnS host only shows a slow increase. The
observations of these samples suggests that the PL spectra of Mn2+ centers is related to the
d-d excitation transition of Mn2+ ions in ZnS host and the energy transfer from ZnS host
(Peng et al. 2005).
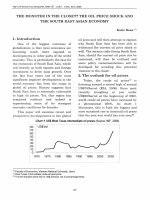
However, in Fig. 3, the luminescence peak maximum positions of PVP uncapped ZnS:Mn
sample (curve a) are at 437 and 601 nm which are the same as in PVP-capped ZnS:Mn
samples excited by excitation wavelength of 325 nm. This clearly shows that the luminescence peak maximum positions are unchanged, but their intensities increase rather strongly
with increasing of PVP concentrations. The orange emission band is attributable to 4 T1 –6 A1
or A2 –A1 transitions of Mn2+ ions in the crystal field of the ZnS nanoparticles. The blue
emission band is attributable to the intrinsic emission of defects, vacancy and an incorporation of trapped electron by defects at donor level under conduction range when doped Mn
was added into hot ZnS semiconductor. Both the blue emission and the orange one increase
with the increase of PVP concentration, which suggests that the increase of Mn2+ emission
related to the hot lattice emission. But noticeably, the base difference in comparision with
the above ZnS:Mn samples shows that the blue emission of PVP-capped ZnS:Mn samples
has the stronger enhancement than the orange emission with the PVP concentration increase
while the constant Mn concentration. Table 1 shows the intensity of the peaks at 437 and
601 nm for samples with different PVP concentrations.
It can be seen clearly from Table 1 that the intensity of PL peak at 437 nm increases
stronger than that of the peak at 601 nm, when the PVP concentration increases.
123
152
T. Tran Minh et al.
Photoluminescence intensity (a.u)
40000
35000
a. ZnS:Mn-PVP(5:0)
b. ZnS:Mn-PVP(5:1)
c. ZnS:Mn-PVP(5:2)
d. ZnS:Mn-PVP(5:3)
e. ZnS:Mn-PVP(5:4)
437 nm
30000
25000
601 nm
e
20000
d
15000
c
10000
b
5000
a
0
350
400
450
500
550
600
650
700
750
Wavelength (nm)
Fig. 3 The PL spectra of the ZnS:Mn–PVP excited by excitation wavelength of 325 nm with different content
of PVP
Table 1 The intensities for the 437 nm peak, 601 nm peak and their intensity ratio
Sample
ZnS:Mn–PVP
(5:0)
ZnS:Mn–PVP
(5:1)
ZnS:Mn–PVP
(5:2)
ZnS:Mn–PVP
(5:3)
ZnS:Mn–PVP
(5:4)
I437 nm (a.u.)
1,443
6,277
13,517
17,313
32,170
I601 nm (a.u.)
5,687
9,838
15,026
17,667
24,105
I437 /I601
0.2537
0.638
0.8995
0.9799
1.335
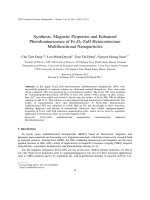
The absorption spectra of PVP, ZnS:Mn and ZnS:Mn–PVP with different PVP concentrations are shown in Fig. 4. The absorption edges are at 230, 322 and 305 nm for PVP (curve a),
uncapped ZnS:Mn (curve b) and ZnS:Mn–PVP (5:4) (curve f) samples, respectively. For the
curvers b, c, d, e, f, their right shoulders in range about of 350–400 nm heaped up by absorption lines that characterized by donor-acceptor absorption transition of vacancies or defects in
ZnS when doped Mn was added into hot ZnS semiconductor (Wang et al. 2008). The decreasing of the band gap of ZnS:Mn in comparison with that of pure ZnS is possible attributed to
the band-edge tail constitution of state density in band gap, by the s-d exchange interaction
between 3d5 electrons of Mn2+ and s conduction electrons in ZnS crystal (Twardowski et
al. 1983; Levy et al. 1996). On the contrary to the decreasing of the band gap of ZnS:Mn (in
comparison with that of pure ZnS), the absorption edge of PVP capped ZnS:Mn is shifted
toward to shorter wavelength from 322 to 305 nm when the PVP concentration increases.
Because of ZnS:Mn nanoparticles were formed in produced process before they dispersed
into PVP matrix, therefore, PVP polymer do not effect to size of nanoparticles. However the
PVP play an important role as the protective layer, against agglomeration ZnS:Mn nanoparticles and contribute to increasing optical properties of material. The absorption edge and right
shoulder of PVP (in Fig. 4) showed in range from 230 to 400 nm, while the absorption edges
and right shoulders of PVP coated ZnS:Mn samples in range about of 305–450 nm showed
clearly the shift toward to short wavelength when increasing of PVP concentration. Due to
the PVP absorb the photons in wavelength range from 230 to 400 nm, thus the blue shift of the
absorption edge in range 320–400 nm can be explained by increasing of PVP concentration
123
The optical properties and energy transition process
0.8
Absorption (a.u)
0.7
153
322 nm
b
305 nm
c
230 nm
d
0.6
e
0.5
f
0.4
a. PVP
b. ZnS:Mn
c. ZnS:Mn-PVP(5:1)
d. ZnS:Mn-PVP(5:2)
e. ZnS:Mn-PVP(5:3)
f. ZnS:Mn-PVP(5:4)
a
0.3
0.2
0.1
0.0
200
300
400
500
600
Wavelength (nm)
Fig. 4 The absorption spectra of PVP and ZnS:Mn–PVP with different contents
of the PVP coated ZnS:Mn samples. These similar results for PVP coated ZnS:Ni samples
also received in our paper (Thi et al. 2012).
The above discussion shows that PVP does not affect the microstructure of ZnS:Mn PL,
but plays an important role to improve the optical properties of ZnS:Mn nanoparticles.
3.3 Photoluminescence excitation (PLE) spectra of PVP and ZnS:Mn–PVP
In order to examine the process of energy transfer in the PVP capped ZnS:Mn nanoparticles,
Fig. 5 shows the photoluminescence PL spectra of the PVP and typical ZnS:Mn–PVP (5:4)
samples. It is interesting to see that the PVP is emissive with peak maximum at 394 nm
when using the exciting wavelength of 325 nm. Beside that, the PL spectrum of PVP is
unsymmetrical, thus its right shoulder heaped up by luminescence lines in range about of
390–470 nm. The PLE spectrum recorded at 394 nm emission of PVP shows peak maximum
at 332 nm in Fig. 5(inset). This excitation band is attributed to the electronic transitions in
PVP molecular orbitals. Alternatively the blue emission band of PVP at 394 nm is attributed
to the radiative relaxation of electrons from the lowest energy unoccupied molecular orbital
(LUMO) to the highest energy occupied molecular orbital (HOMO) levels in PVP (Manzoor
et al. 2004). The PL spectrum of ZnS:Mn–PVP (5:4) sample under excitation wavelength
of 338 nm shows two peak maxima at 434 and 598 nm. These peak maxima are rather close
to the corresponding peaks (two peak maxima at 437 and 601 nm) of other ZnS:Mn–PVP
samples excited by excitation wavelength of 325 nm in Fig. 3. These issues express the effect
of PVP to the optical properties of ZnS:Mn nanoparticles in polymer matrix.
The PLE spectra of samples were measured in Fig. 6. As seen in Fig. 6, the PLE band of
PVP monitored at 394 nm (Fig. 6a) has a peak maximum at 332 nm, while the PLE band of
ZnS:Mn–PVP (5:4) monitored at 430 nm shows a peak maximum at 340 nm. The distance
between these two PLE peak is about 8 nm. But the distance between the blue emission peak
maxima (394 and 430 nm) of the PVP and ZnS:Mn–PVP (5:4) samples is rather large (about
46 nm). On the other hand, the PLE band of ZnS:Mn–PVP (5:4) sample monitored at 598 nm
(orange emission of Mn2+ ) shows a peak maximum at 338 nm, which is rather close with
the peaks of curves (a) and (b) in Fig. 6. From the above results, it is reasonable to suppose
123
154
T. Tran Minh et al.
PL intensity (a.u.)
PL intensity (a.u)
PL of ZnS:Mn-PVP(5:4)
598 nm
Exc. 338nm
332 nm
30.0M
800.0k
25.0M
20.0M
15.0M
10.0M
PLE spectrum of PVP
Monitored at 394nm
5.0M
0.0
600.0k
240
260
280
300
320
340
360
380
Excitation wavelength (nm)
394 nm
434 nm
400.0k
200.0k
PL of PVP polymer, Exc. 325nm
0.0
250
300
350
400
450
500
550
600
650
700
Wavelength (nm)
PL intensity (a.u.)
Fig. 5 The PL spectra of the PVP and ZnS:Mn–PVP (5:4) samples
4.5x10
6
4.0x10
6
3.5x10
6
3.0x10
6
2.5x10
6
2.0x10
6
1.5x10
6
1.0x10
6
5.0x10
5
340 nm
332 nm
PLE spectrum
of PVP monitored
at 394nm
PLE spectrum
of ZnS:Mn-PVP(5:4)
monitored at 430 nm
338 nm
a
b
c
PLE spectrum of ZnS:Mn-PVP(5:4)
monitored at 598 nm
240 260 280 300 320 340 360 380 400 420 440
Excitation wavelength (nm)
Fig. 6 The PLE spectra of the PVP and ZnS:Mn–PVP (5:4) samples
that: (i) the high energy band in the PLE spectrum of ZnS:Mn–PVP arises from the surface
PVP molecules; (ii) the energy transfer occurs between the energy levels of surface PVP
molecular orbitals and the luminescence centers of ZnS:Mn; (iii) the energy transition from
surface PVP molecules to the Mn2+ centers occurs via hot ZnS. Thus, the intensity of the
blue luminescence increases stronger than the intensity of the orange luminescence when
increasing of PVP concentration.
3.4 Time-resolved PL spectra and luminescence decay curves
The investigation of the kinetic decay process of electrons in energy bands is very important
to the study of luminescence. It can provide a scientific basis for the improvement of the
luminescence efficiency of optical materials. Figure 7 shows the time-resolved PL spectra
of PVP at 300 K excited by pulse N2 laser with 337 nm wavelength, pulse width of 7 ns,
frequency of 10 Hz.
123
The optical properties and energy transition process
155
Fig. 7 The time-resolved PL spectra of PVP at 300 K excited by pulse N2 laser with 337 nm wavelength,
pulse width of 7 ns, frequency of 10 Hz. The delay times after the excitation pulse are 33, 37, 40, 44 and 50 ns,
respectively
400
436 nm
350
60 ns
64 ns
67 ns
73 ns
80 ns
Intensity (a.u.)
300
250
200
150
100
50
452 nm
0
350
400
450
500
550
Wavelength (nm)
Fig. 8 The time-resolved PL spectra of ZnS:Mn–PVP (5:3) at 300 K excited by pulse N2 laser with 337 nm
wavelength, pulse width of 7 ns, frequency of 10 Hz. The delay times after the excitation pulse are 60, 64, 67,
73 and 80 ns, respectively
The peaks of these spectra are shifted toward longer wavelength from 428 to 437 nm with
increasing of the delay time from 33 to 50 ns. Thus, the peaks of these spectra belong to
the broad PL bands about of 390–470 nm of PVP excited by laser wavelength of 325 nm (in
Fig. 5). Beside that, the PL peak intensity decrease, while the spectral width of the PL band
(full-width at half-maximum) decrease with increasing of the delay time. These PL properties
are attributed to electron transition from LUMO to HOMO levels in PVP molecules.
Figure 8 shows the time-resolved PL spectra of ZnS:Mn–PVP (5:3) at 300 K excited by
pulse N2 laser with 337 nm wavelength. It is clearly that the peaks of PL spectra of ZnS:Mn–
123
156
T. Tran Minh et al.
Intensity (a.u.)
a 400
b
350
The PL decay curve
300
ZnS:Mn-PVP(5:3)
at 450 nm
λ ex = 337 nm
250
200
150
100
50
0
0
20
40
60
80
100
Time (ns)
Fig. 9 a The PL decay curve of ZnS:Mn–PVP (5:3). b The PL decay curve of PVP
PVP (5:3) are shifted toward longer wavelength from 436 to 452 nm with increasing of the
delay time from 60 to 80 ns (in Fig. 8). Furthermore the PL peak intensity decrease, while the
spectral width of the PL band (full-width at half-maximum) also decrease with increasing
of the delay time. The PL peak shift with delay time of ZnS:Mn–PVP (5:3) sample is one
of typical characteristics of donor-acceptor recombination in semiconductor material (Ishi
zumi et al. 2005). Thus this blue emission band is attributable to the intrinsic emission of
defects, vacancy of sulphur VS , trapped electron by defects at donor level under conduction
range and vacancy of zinc VZn at acceptor level up valence range.
Figure 9a, b show the PL decay curves of ZnS:Mn–PVP (5:3) at 450 nm and PVP at
428 nm when using exciting wavelength 337 nm, respectively. The decay curves show that
the number of free photoelectrons in exciting energy bands (corresponding to 450, 428 nm
wavelengths) showed exponential attenuation and is given by: n ∝ e−t/τ , where τ is the
lifetime of electrons in exciting energy band. From those PL decay curves, the lifetime of
free photoelectrons calculated about of τ1 = 21.5 ns for ZnS:Mn–PVP (5:3) at 450 nm and
τ2 = 15.5 ns for PVP at 428 nm. The lifetime τ1 is more smaller than that in ZnS:Mn,Cu
samples sintered at high temperatures (Guoyi et al. 2003). On the other hand, the lifetime τ2
is very short, thus it is characteristic of the radiative relaxation of electrons from the lowest energy unoccupied molecular orbital (LUMO) to the highest energy occupied molecular
orbital (HOMO) levels in PVP. From above optical results of PVP, the blue luminescence of
PVP may be attributed to the radiative relaxation of electron from LUMO to HOMO levels
as in Fig. 11a.
3.5 On the energy transfer from surface PVP molecules to the Mn2+ centers
The PVP is a conjugated polymer with both N and C=O groups. So with the ZnS:M-PVP
samples (M: transition metal ion), it is believed that the bond between metal ions and PVP
can give rise to overlapping of molecular orbitals of PVP with atomic orbitals of metal ions
in surface regions (Ghosh et al. 2006; Manzoor et al. 2004). Thus, from the above results,
we believe that the PVP passivating layers around the ZnS:Mn core described in Fig. 10 are
formed by coordination bond between the nitrogen atom of PVP and Zn2+ (Manzoor et al.
2004). Figure 10 shows the incomplete coverage with low concentration of PVP (Fig. 10a)
and the complete coverage with higher concentrations of PVP (Fig. 10b).
From above analyzed results on the PL peaks of 437, 601 nm (in Table 1, Fig. 3), the
PLE spectra, the time-resolved PL spectra and the luminescence decay curves of PVP and
123
The optical properties and energy transition process
Fig. 10 The PVP coverage of
ZnS:Mn grains. a Incomplete
coverage. b Complete coverage
Fig. 11 Schematic illustration of
various electronic transition and
energy transfer process in
ZnS:Mn–PVP. a (PVP),
b ZnS:Mn
157
a
a
b
b
LUMO
Conduction band
4
Green
emission
Mn
2+
T1
Orange
emission
6
A1
Valence band
HOMO
ZnS:Mn–PVP samples, the energy transition process from surface PVP molecules to the
Mn2+ centers occurs via hot ZnS illustrated as in Fig. 11a, b.
4 Conclusion
The above experimental results show that the absorption edge of PVP is about of 230 nm.
The absorption edge of PVP capped ZnS:Mn nanoparticles shifted from 322 to 305 nm when
the PVP concentration increases. The luminescence spectra of PVP showed a blue emission
with peak maximum at 394 nm. While the PVP coating did not affect the microstructure of
ZnS:Mn nanomaterial, the PL spectra of PVP capped ZnS:Mn nanoparticles samples were
found to be affected strongly by the PVP concentration. The mechanism of energy transition
process from the surface PVP molecules to the Mn2+ centers in ZnS:Mn nanoparticles was
explained.
Acknowledgments This work was supported by Vietnam’s National Foundation for Science and Technology
Development (NAFOSTED) (Code 103.02.2010.20).
References
Agostinelli, T., Ferenczi, T.A.M., Pires, E., Foster, S., Maurano, A., Muller, C., Ballantyne, A., Hampton, M.,
Lilliu, S., Campoy-Quiles, M., Azimi, H., Morana, M., Bradley, D.D.C., Durrant, J., Macdonald, J.E.,
Stingelin, N., Nelson, J.: The role of alkane dithiols in controlling polymer crystallization in small band
gap polymer:fullerene solar sells. J. Polym. Sci. Part B Polym. Phys. 49, 717–724 (2011)
Cihaner, A., Algi, F.: Electrochemical and optical properties of an azo dye based conducting copolymer. Turk.
J. Chem. 33, 759–767 (2009)
Dubey, N., Leclerc, M.: Conducting polymers: efficient thermoelectric materials. J. Polym. Sci. Part B Polym.
Phys. 49, 467–475 (2011)
Ghosh, G., Naskar, M.K., Patra, A., Chatterjee, M.: Synthesis and characterization of PVP-encapsulated ZnS
nanoparticles. Opt. Mater. 28, 1047–1053 (2006)
Guoyi, D., Xiaowei, L., Zhiren, W., Shaopeng, Y., Guangsheng, F.: Measurement of the time-resolved spectrum of photoelectrons from ZnS:Mn, Cu luminescent material. J. Phys. Condens. Matter 15, 1495–
1503 (2003)
123
158
T. Tran Minh et al.
Hajduk, B., Weszka, J., Cozan, V., Kaczmarczyk, B., Jarzabek, B., Domanski, M.: Optical properties of
polyazomethine with oxygen atom in the backbon. Arch. Mater. Sci. Eng. 32(2), 85–88 (2008)
Hattori, Y., Isobe, T., Takahashi, H., Itoh, S.: Luminescent properties of ZnS:Mn2+ nanocrystals/SiO2 hybrid
phosphor synthesized by in situ surface modificationco-precipitation. J. Lumin. 113, 69–78 (2005)
Huang, C.M., Chen, L.C., Pan, G.-T., Yang, T.C.K., Chang, W.S., Cheng, K.W.: Effect of Ni on the growth
and photoelectrochemical properties of ZnS thin films. Mater. Chem. Phys. 117, 156–162 (2009)
Ishi zumi, A., White, C.W., Kanemitsu, Y.: Photoluminescence properties of impurity-doped ZnS nanocrystals
fabricated by sequential ion implantation. Physica E 26, 24–27 (2005)
Jarzabek, B., Schab-Balcerzak, E., Chamenko, T., Sek, D., Cisowski, J., Volozhin, A.: Optical properties of
new aliphatic-aromatic co-polyimides. J. Non-Cryst. Solids 299(302), 1057–1061 (2002)
Jarzabek, B., Weszka, J., Domanski, M., Jurusik, J., Cisowski, J.: Optical properties of amorphous polyazomethine thin films. J. Non-Cryst. Solids 352, 1660–1662 (2006)
Jarzabek, B., Weszka, J., Domanski, M., Jurusik, K., Cisowski, J.: Optical studies of aromatic polyazomethine
thin films. J. Non-Cryst. Solids 354, 856–862 (2008)
Karar, N., Singh, F., Mehta, B.R.: Structure and photoluminescence studies on ZnS:Mn nanoparticles. J. Appl.
Phys. 95(2), 656–660 (2004)
Levy, L., Hochepied, J.F., Pileni, M.P.: Control of the size and composition of three dimensionally diluted
magnetic semiconductor clusters. J. Phys. Chem. 100(47), 18322–18326 (1996)
Maity, R., Maiti, U.N., Mitra, M.K., Chattopadhyay, K.K.: Synthesis and optical characterization of polymercapped nanocrystalline ZnS thin films by chemical process. Physica E 33, 104–109 (2006)
Manzoor, K., Vadera, S.R., Kumar, N., Kutty, T.R.N.: Synthesis and photoluminescent properties of ZnS
nanocrystals doped with copper and halogen. Mater. Chem. Phys. 82, 718–725 (2003)
Manzoor, K., Vadera, S.R, Kumar, N., Kutty, T.R.M.: Energy transfer from organic surface adsorbate-polyvinyl pyrrolidone molecules to luminescent centrers in ZnS nanocrystals. Solid State Commun. 129, 469–
473 (2004)
McNeill, C.: Imaging the domain structure of organic semiconductor films. J. Polym. Sci. Part B Polym.
Phys. 49, 909–919 (2011)
Miller, N.C., Gysel, R., Miller, C.E., Verploegen, E., Beiley, Z., Heeney, M., McCulloch, I., Bao, Z., Toney,
M.F., McGehee, M.D.: The phase behavior of a polymer-fullerene bulk heterojunction system that contains bimolecular crystals. J. Polym. Sci. Part B Polym. Phys. 49, 499–503 (2011)
Murugadoss, G.: Synthesis and optical characterization of PVP and SHMP-encapsulated Mn2+ -doped ZnS
nanocrystals. J. Lumin. 130, 2207–2214 (2010)
Murugadoss, G., Rajamannan, B., Ramasamy, V.: Synthesis and photoluminescence study of PVA-capped
ZnS:Mn2+ nanoparticles. Dig. J. Nanomater. Biostruct. 5(2), 339–345 (2010)
Panda, S.K., Datta, A., Chaudhuri, S.: Nearly monodispersed ZnS nanospheres: synthesis and optical properties. Chem. Phys. Lett. 440, 235–238 (2007)
Pattabi, M., Saraswathi Amma, B., Manzoor, K., Sanjeev, G.: Effect of 8 MeV electron irradiation on the optical
properties of PVP capped CdS nanoparticles in PVA matrix. Sol. Energy Mater. Solar Cells 91, 1403–
1407 (2007)
Peng, W.Q., Qu, S.C., Cong, G.W., Zhang, X.Q., Wang, Z.G.: Optical and magnetic properties of ZnS nanoparticles doped with Mn2+ . J. Cryst. Growth 282, 179–185 (2005)
Porambo, M.W., Marsh, A.L.: Synthesis and photoluminescent properties of doped ZnS nanocrystals capped
by poly(vinylpyrrolidon). Opt. Mater. 31, 1631–1639 (2009)
Pouretedal, H.R., Norozi, A., Keshavarz, M.H., Semnani, A.: Nanoparticles of zinc sulfide doped with
manganese, nickel and copper as nanophotocatalyst in the degradation of organic dyes. J. Hazard.
Mater. 162, 674–681 (2009)
Sharif, N.S.A., Ridhuan, N.S., Ahmad, Z.A., Hutagalung, S.D.: Structural analysis of zinc sulphide nanopartiles synthesized via wet chemical route. Solid State Sci. Technol. 18(1), 91–95 (2010)
Sharma, R., Bhatti, H.S., Kyhm, K.: Enhanced oscillator strengths and optical parameters of doped ZnS bulk
and nanophosphors. Appl. Phys. B 97, 145–155 (2009)
Soni, H., Chawda, M., Bodas, D.: Electrical and optical characteristics of Ni doped ZnS clusters. Mater.
Lett. 63, 767–769 (2009)
Sparavigna, A.C., Florio, L., Avloni, J., Henn, A.: Polypyrrole coated PET fabrics for thermal applications. Mater. Sci. Appl. 1, 253–259 (2011)
Thi, T.M., Tinh, L.V., Van, B.H., Ben, P.V., Trung, V.Q.: The effect of polyvinylpyrrolidone on the optical
properties of the Ni-doped ZnS nanocrystalline thin films synthesized by chemical method. J. Nanomater.
vol. 2012, Article ID 528047, 8 p. (2012). doi:10.1155/2012/528047
Thuy, N.M., Sam, D.T., Thi, T.M., Khoi, N.T.: Synthesis of Mn-Doped ZnS and the dopant-induced photoluminescence properties. J. Nonlinear Opt. Phys. Mater. 17(2), 1–8 (2008)
123
The optical properties and energy transition process
159
Twardowski, A., Dietl, T., Demianiuk, M.: The study of the s-d type exchange interaction in Zn1−x Mnx Se
mixed crystals. Solid State Commun. 48(10), 845–848 (1983)
Wang, L., Tao, X.-T., Yang, J.-X., Ren, Y., Liu, Z., Jiang, M.-H.: Preparation and characterization of the ZnS
nanospheres with narrow size distribution. Opt. Mater. 28, 1080–1083 (2006)
Wang, W., Huang, F., Xia, Y., Wang, A.: Photophysical and photoluminescence properties of co-activated
ZnS:Cu,Mn phosphors. J. Lumin. 128, 610–614 (2008)
Yang, P., Lü, M., Xü, D., Yuan, D., Chang, J., Zhou, G., Pan, M.: Strong green luminescence of Ni2+ -doped
ZnS nanocrystals. Appl. Phys. A 74, 257–259 (2002)
Yang, P., Lu, M., Xu, D., Yuan, D., Song, C., Liu, S., Cheng, X.: Luminescence characteristics of ZnS nanoparticlesco-doped with Ni2+ and Mn2+ . Opt. Mater. 24, 497–502 (2003)
123