DSpace at VNU: Farmland loss, nonfarm diversification and inequality among households in Hanoi's peri-urban areas, Vietnam
Bạn đang xem bản rút gọn của tài liệu. Xem và tải ngay bản đầy đủ của tài liệu tại đây (9.38 MB, 24 trang )
IDPR, 36 (3) 2014 doi: 10.3828/idpr.2014.20
Tran Q u a n g Tuyen, Steven Lim, M ic h a e l R C a m e ro n and Vu Van H u o n g
Farmland loss, nonfarm diversification and
inequality among households in Hanoi's
peri-urban areas, Vietnam
U sin g a n o ve l d a ta se t fro m a 2 0 1 0 h o u s e h o ld survey in v o lv in g 4 7 7 h o u s e h o ld s , th is study p ro v id e s the
first e c o n o m e tric e vid e n ce fo r th e im p a cts o f fa rm la n d loss (du e to u rb a n is a tio n ) o n n o n fa rm d iv e rs ific a
tio n a m o n g h o u s e h o ld s in H a n o i's p e ri-u rb a n a re a s in V ie tn a m . The results fro m fra c tio n a l lo g it a n d
fra c tio n a l m u ltin o m ia l lo g it m o d e ls in d ic a te th a t fa rm la n d loss has a n e g a tiv e e ffe c t o n th e share o f fa rm
in c o m e b u t a p o sitive e ffe ct o n th e s h a re o f v a rio u s n o n fa rm in c o m e s , n o ta b ly in fo rm a l w a g e in c o m e .
W e a lso in ve stig a te th e re la tio n s h ip b e tw e en v a rio u s in c o m e so u rce s a n d in c o m e in e q u a lity u sin g a
G in i d e c o m p o s itio n a n alysis. W h ile in c o m e fro m in fo rm a l w a g e w o rk a n d fa rm w o rk a re in e q u a lity d e c re a s in g , o th e r in c o m e so u rce s a re in e q u a lity -in c re a s in g . T hus, th is suggests th a t fa rm la n d loss has
in d ire c t m ixed e ffects o n in c o m e in e q u ality.
K e y w o rd s : fa rm la n d loss, in fo rm a l w a g e in c o m e , fo rm a l w a g e in c o m e , G in i d e c o m p o s itio n , V ie tn a m
International experience indicates that rapid urbanisation and economic growth
coincide with the conversion of land from the agricultural sector to industry, infra
structure and residential uses (Ramankutty, Foley and Olejniczak, 2002). In devel
oping countries, land beyond the urban fringe is in huge demand for various purposes,
including the construction of public infrastructure, factories, commercial centres and
housing. These demands for peri-urban land can bring about considerable changes
in peri-urban livelihoods, for better or worse (Mattingly, 2009). According to Gregory
and Mattingly (2009), urbanisation on the one hand leads to intense competition for
land, deterioration and loss of access to natural resources, and these in turn have a
detrimental effect on natural resource-based livelihoods. On the other hand, urban
isation offers a greate choice of jobs, better transport availabilty to markets, an expan
sion of services and trade, and the competitive advantage of proximity for fruit and
vegetable products. These factors can help peri-urban households diversify their liveli
hoods and mitigate their dependence on natural resources (Gregory and Mattingly,
2009).
Over the past two decades in Vietnam, a large area of farmland has been taken
to provide space for urbanisation and industrialisation. As calculated by Le (2007), at
Tran Quang Tuyen (corresponding author) is affiliated with Faculty of Political Economy, University of Economics
and Business, Vietnam National University, Room 100, Building E 4 ,144 X uan Thuy Road, Cau Giay District, Hanoi,
Vietnam; Steven Lim, Michael P. Cameron and Vu Van Huong are affiliated with the Department of Economics,
University of Waikato, Hamilton Campus, Gate 1, Knighton Road, Private Bag 3105, Hamilton 3240, New Zealand;
email: ; ; ; ;
Paper submitted August 2013; revised paper accepted October 2013.
Tran Q u a n g Tuyen, Steven Lim, M ich a e l R C a m e ro n an d Vu Van H uong
358
a national scale from 1990 to 2003, 697,417 ha of land were compulsorily acquired
by the state for the construction of industrial zones, urban areas and infrastructure,
and other national use purposes. Furthermore, in 2000 to 2007 it was estimated
that approximately 500,000 ha of agricultural land were converted to nonfarm use,
accounting for 5 per cent of the country’s land (VietNamNet/TN, 2009). Increasing
urban population and rapid economic growth, particularly in the urban areas of
Vietnam’s large cities, have resulted in a great demand for urban land. This has led to
an intensive conversion of agricultural land into higher-value nonagricultural land,
particularly within the urban fringe. In order to satisfy this demand for land in the
northern key economic region, the state has conducted many farmland acquisitions
in the Red River Delta, which has a large area of fertile agricultural land, a prime
location and high population density (Hoang, 2008).' Such farmland acquisitions have
major effects on poor households in Vietnam’s rural and peri-urban areas (ADB,
2007).
In the context of accelerating loss of farmland for urbanisation and industrialisa
tion in the urban fringe of Vietnam’s large cities, a number of studies have examined
the impacts of farmland loss on households’ livelihood adaptation (Do, 2006; Le,
2007; Nguyen, Vu and Philippe, 2011; Nguyen, 2009). The studies indicate that, while
farmland loss causes the loss of traditional agricultural livelihoods and food insecurity,
it also expands the space for urbanisation and industrialisation, which in turn result
in improvements in local infrastructure, new industrial zones and urban areas. Such
changes offer a wide range of nonfarm livelihood opportunities for local people.
As in Vietnam, negative impacts of farmland loss have been found in China (Deng
et al., 2006) and India (Fazal, 2000; 2001). In contrast, other studies show positive
effects of farmland loss on rural livelihoods in China (Parish, Zhe and Li, 1995; Chen,
1998) and Bangladesh (Toufique and Turton, 2002). In addition, varying results from
farmland loss on peri-urban livelihoods have been reported in Ghana and India
(Mattingly and Gregory, 2006). Although much has been discussed about the mixed
effects of farmland loss on household livelihoods, to date no econometric evidence
of these impacts exists. Thus, this study applies econometric methods to answer the
key research question: how and to what extent has farmland loss affected household
nonfarm diversification, as measured by household income shares by source?
Another important contribution of this study is that we examine whether farmland
loss has any impact on income inequality. Income sources have been found to be closely
associated with income inequality in Vietnam (Adger, 1999; Cam and Akita, 2008;
i
Compulsory land acquisition is applied to cases in which land is acquired for national or public projects; for
projects with ioo per cent contribution from foreign funds (including FDI (Foreign Direct Investment) and ODA
(Official Development Assistance)); and for the implementation of projects with special economic investment
such as building infrastructure for industrial and services zones, hi-tech parks, urban and residential areas and
projects in the highest investment fund group (World Bank, 2011).
Farm land loss, no n fa rm d ive rsifica tio n and in e q u a lity a m o n g households in H a n o i
Gallup, 2002). If farmland loss has a major impact on household income sources,
then it may cause changes in income inequality. O ur study confirms this hypoth
esis: farmland loss has a significant impact on household income sources, particularly
through nonfarm income diversification, and it also has indirect mixed impacts on
inequality.
B a c k g ro u n d o f th e case stu d y
Research site
The research was carried out in Hoai Due, a peri-urban district located on the north
west side of Hanoi, 19 km from the Central Business District. O f the districts of
Hanoi, Hoai Due holds the largest number of farmland-acquisition projects (Huu
Hoa, 2011). Over the period 2006 to 2010, around 1,560 ha of farmland were compul
sorily acquired by the state for 85 projects (Ha Noi Moi, 2010). The district covers an
area of 8,247 ha of land, of which agricultural land accounts for 4,272 ha, and 91 per
cent of this area is used by households and individuals (Hoai Due District People’s
Committee, 2010). Hoai Due has 20 administrative units, including 19 communes
and one town. There are around 50,400 households with a population of 193,600
people living in the district. In the whole district, the share of agricultural employ
ment dropped around 23 per cent over the past decade. However, a considerable share
of employment has still remained in agriculture, making up around 40 per cent of the
total employment in 2009 (Statistics Department of Hoai Due District, 2010).
Compensation for land-losing households
According to our household survey, each household on average received a total
compensation of VND 98,412,000. The minimum and maximum amounts were VND
4,000,000 and VND 326,000,000, respectively.2 An adequate compensation for land
loss was proposed as a possibility that might help households switch to an alternative
livelihood in the peri-urban areas of Kumasi, Ghana (Mattingly, 2009). Unfortunately
for Vietnamese households, there has been a large gap between the compensation
level defined by the government guidelines, and the real value of the land determined
by market principles (Han and Vu, 2008). Although the compensation has been well
below the fair market value of the land, it would however have provided households
with a significant amount of capital with which they can initiate a new income earning
activity or invest more in existing activities. However, most households have used
this valuable source for non-production purposes rather than production purposes.3
a
USD 1 equated to about VND 18,000 in 2009.
3
According to the surveyed data, about 60 per cent of land-losing households used the compensation for daily
359
Tran Q uang Tuyen, Steven Lim, Michael R Cameron and Vu Van Huong
360
This trend is also evident in other districts of Hanoi as described by Do (2006) and
Nguyen (2009). Therefore, this suggests that compensation might have little impact on
nonfarm diversification in our sample.
Also, H a Tay Province People’s Committee issued the Decision 1098/2007/
QD-UB and Decision 371/2008/QD-UB, which state that a plot of commercial land
(dat dich vu) will be granted to households which lose more than 30 per cent of their
agricultural land. Each household receives an area of dat dich vu equivalent to 10 per
cent of the area of farmland taken for each project (Hop Nhan, 2008). Dat dich vu is
located close to industrial zones or residential land in urban areas (World Bank, 2009).
Thus, it can be used as a business premises for nonfarm activities such as opening a
shop or a workshop, or for renting to others. While this compensation policy with
‘land for land’ has been successfully implemented in some provinces, this solution is
believed to be unsuitable for other provinces due to insufficient land for this purpose
(World Bank, 2009).
D ata and methods
Data
Adapted from the General Statistical Office (GSO) (2006), a household questionnaire
was constructed to collect quantitative data on household characteristic and assets,
income-earning activities (working time allocation) and household economic welfare
(income and consumption expenditure). A disproportionate stratified sampling method
was employed with two steps as follows. First, 12 communes that lost their farmland (due
to the state’s compulsory land acquisition) were divided into three groups based on their
employment structure. The first group consisted of three agriculture-based communes;
the second group was represented by five communes based on both agricultural and
non-agricultural production; the third group included four non-agriculture-based
communes. From each group, two communes were randomly chosen. Second, from
each of these six communes, 80 households, including 40 households with farmland
loss and 40 households without farmland loss, were randomly chosen for a target sample
size of 480. The survey was implemented from April to June 2010; 477 households were
successfully interviewed, of which 237 households lost some or all of their farmland.
O f the 237 households with farmland loss, 113 households had farmland acquired in
early 2009 and 124 households had farmland acquired in the first half of 2008. In the
remainder of this paper, households whose farmland was lost partly or totally by the
state’s compulsory acquisition of land will be referred to as ‘land-losing households’.
living expenses, and about a quarter of them purchased furniture and appliances, while a similar proportion of
land-losing households spent this money in repairing or building houses. By contrast, only 4 per cent among them
used this resource for investing in nonfarm production.
F arm land loss, n o n fa rm d ive rsifica tio n a nd in e q ua lity a m o n g households in Flanoi
Methods
Classification of livelihood strategies
Partition cluster analysis was used to group households into distinct livelihood catego
ries. Proportions of time allocated for different economic activities (before farmland
acquisition) were used as variables for clustering past livelihood categories (the liveli
hood strategies that households pursued before farmland acquisition). Similarly,
proportions of income by various sources were used as variables for clustering
current livelihood categories (the livelihood strategies after farmland acquisition). The
two-stage procedure suggested by Punj and Stewart (1983) was applied for cluster
analysis, which identified various livelihood strategies that households pursued before
and after farmland acquisition.
Specification o f econometric models
Econometric methods were then to quantify the impact of farmland loss on household
income shares by source. Because the share of farm income is a proportion, the deter
minants of farm income share were modeled using a fractional logit model (FLM),
which was proposed by Papke and Wooldridge (1996). FLM has similarities with the
standard logit model, with the difference that the response variable is a continuous
variable bounded between zero and one instead of being a binomial variable. This
model is estimated using a quasi-maximum likelihood procedure (Jonasson, 2011).
As demonstrated by Wagner (2001), the fractional logit approach is the most appro
priate approach because this model overcomes many difficulties related to other more
commonly used estimators such as ordinary least squares (OLS) and TOBIT.
To quantify factors affecting the share of nonfarm incomes, a set of simultaneous
equations was estimated with the share of farm, informal wage, formal wage, nonfarm
self-employment and other income as dependent variables. Because each of these
dependent variables is a fraction and the shares from this set of dependent variables
for each observation add up to one, a fractional multinomial logit model (FMLM),
as proposed by Buis (2008), was employed. As Buis (2008) notes, the FMLM is a
multivariate generalisation of the FLM developed by Papke and Wooldridge (1996) to
deal with the case where the shares add up to one. Similar to the FLM, the FMLM
is estimated by using a quasi-maximum likelihood method, which includes robust
standard errors (Buis, 2008). There have been a growing number of studies applying
the FMLM to handle models containing a set of fractional response variables with
shares that add up to one (Kala, Kurukulasuriya and Mendelsohn, 2012; Winters et
al., 2010).
Following the framework for micro-policy analysis of rural livelihoods proposed
by Ellis (2000), income shares by source were assumed to be determined by household
livelihood assets (including natural, physical, human, financial and social capital).
In addition, other factors, in this case past livelihood strategies, farmland loss and
361
Tran Quang Tuyen, Steven Lim, Michael R Cameron and Vu Van Huong
362
commune dummy variables, were included as regressors in the models. Summary
statistics for the included variables are available in Appendix i.
In the present study, the loss of farmland of households is an exogenous variable,
resulting from the state’s compulsory land acquisition.4 The farmland acquisition by
the state took place at different times; therefore, land-losing households were divided
into two groups, namely (i) those that lost their farmland in 2008 and (ii) those lost
their farmland in 2009. The reason for this division is that the length of time since
farmland acquisition was expected to be highly associated with the changes in income
sources. In addition, the level of farmland loss was quite different among households.
Some lost little, while others lost all their land. As a consequence, the level of farmland
loss, as measured by the proportion of farmland acquired by the state in 2008 and in
2009, was used as the variable of interest. In general, households with a higher level
of land loss were hypothesised to have a lower share of farm income after land loss
and, conversely, were expected to raise the proportion of nonfarm income sources.
Household size and dependency ratio (calculated by the number of household
members under 15 and over 59, divided by the total members aged 15 to 59) were
included in the models as measures of human capital, along with the number of male
working household members, gender and age of the household head, and average
education of the working members of the household. In rural Vietnam, men are
more likely than women to participate in non-agricultural wage work (Pham, Bui and
Dao, 2010), so having more male working members was expected be associated with a
higher wage income share. Households with better human capital, as measured by the
average years of formal schooling of household working members, were expected to
receive a higher percentage of formal wage income. Older working members tend to
be more involved in farming as their main income-earning activity. Therefore, the age
of household heads and of working members (those who worked in the last 12 months)
was also expected to be positively linked with the share of farm income.
Owning more farmland per adult (100 m2) is indicative of households that
specialise in farming and thus households with more farmland were hypothesised to
have a greater share of farm income. Residential land can be used as collateral for
credit. Therefore, households with a larger size of residential land were expected to
have greater financial resources for productive activity. Consequently, a larger size of
residential land was hypothesised to be associated with a higher share of farm and
nonfarm self-employment income. Furthermore, a higher percentage of income from
nonfarm self-employment was also expected for households owning a house or a plot
of residential land in a prime location.5
4
5
According to Wooldridge (2013), an exogenous event is often a change in the state’s policy that affects the environ
ment in which individuals and households operate.
A prime location is defined as: the location of house or the location of a plot of residential land situated on the
main road of a village or at the crossroads or very close to local markets or to industrial zones, and to a highway
F arm land loss, n o n fa rm d ive rsifica tio n a nd in e q u a lity a m o n g households in H a n o i
Households with a higher number of group memberships (a proxy for social
capital) may benefit from access to information, technology and credit for production.
Therefore, social capital was expected to be associated with income shares by source.
Financial capital is represented by two dummy variables, namely access to formal
and informal credit, and was hypothesised to be positively linked with the proportion
of farm and nonfarm self-employment income. In addition, higher shares of these
income sources were also expected for households with higher physical capital as
measured by the natural log of the value of all productive assets per working member.
Livelihood strategies may change year to year, but they generally change slowly
because of irreversible investments in human and social capital that are requirements
for switching to a new income-generating strategy. Due to this path dependence, past
livelihood choices are thought to considerably determine the present livelihood choices
(Pender and Gebremedhin, 2007). This implies that households’ current income shares
by source might be largely determined by their past livelihood strategies. Hence, we
included the past livelihood strategy variable as an important explanatory predictor.
Finally, commune dummy variables were also included to control for unobserved
differences between communes in terms of farmland fertility, educational tradition,
local infrastructure development and geographic attributes, and other unobserved
community level factors that may affect households’ income sources.
Measuring income inequality
The Gini coefficient is popularly used to measure the disparity in the distribution of
income, consumption and other welfare indicators (Lopez-Feldman, 2006). Following
Lanjouw, Murgai and Stern (2013), we examine the relationship between income
sources and income inequality using Gini decomposition analysis by income source
(Lerman and Yitzhaki, 1985; Shorrocks, 1982). According to Lerman and Yitzhaki
(1:985), the Gini coefficient of total income inequality (G) can be denoted as:
^ ~Zk=l^k^k^k
(1)
where S ^ represents for the share of income source k in total income, Gfc is the
Gini coefficient of the income distribution from source k , and R ^ is the correlation
coefficient between income from source k and with total income Y Babatunde (2008)
shows the share or contribution of income source k to total income inequality can be
expressed as:
or new urban areas. Such locations enable households to use their house for opening a shop, a workshop or for
renting.
363
364
Tran Q u a n g T uyen, Steven Lim , M ic h a e l R C a m e ro n a n d Vu V an H u o n g
■Sfc GkRk / G
(2)
As shown by Stark, Taylor and Yitzhaki (1986), the income source elasticity of
inequality indicates the percentage change in the overall Gini coefficient resulting
from a 1 per cent change in income from source k , and can be expressed as:
(Sk Gk Rk / G ) - S k
^
where G is the overall Gini coefficient prior to the income change. As noted by Van
Den Berg and Kumbi (2006), Equation (3) is the difference between the share of
source k in the overall Gini coefficient and its share of total income (Y). It should be
noted that the sum of income source elasticities of inequality should be zero, which
means that if all the income sources changed by same percentage, the overall Gini
coefficient (G) would remain unchanged.
R e s u lts a n d d is c u s s io n
H ousehold in co m e -g e n e ra tin g activities and incom e com position
Based on our own fieldwork experience and survey data, and combined with the
definition of the Vietnamese informal sector introduced by Cling et al. (2010), five
types of income sources are identified at the household level: (1) farm income (income
from household agriculture, including crop and livestock production and other related
activities); (2) nonfarm self-employment income (income earned from own house
hold businesses in nonfarm activities); (3) informal wage income (income from wage
work that is often casual, low paid and requires little or no education, often involving
manual labour without formal labour contracts); (4) formal wage income (wage work
that is regular and relatively stable in factories, enterprises, state offices and other
organisations with formal labour contracts, and often requires skills and higher levels
of education); and (5) other income (such as remittances, rental and pensions).
Table 1summarises the income shares by source for the sample. The overwhelming
majority of surveyed households (83 per cent) derived some income from farming, but
this was shown to account for only about 28 per cent of total income on average. This
suggests that farming has remained important in terms of food security and cash
income to some extent in Hanoi’s peri-urban areas. A similar trend was also observed
in the peri-urban areas of India and Ghana by Mattingly and Gregory (2006). Almost
all surveyed households (90 per cent) participated in at least one nonfarm activity,
Farmland loss, nonfarm diversification and inequality among households in Hanoi
365
and income from nonfarm activities contributed about two-thirds of total income on
average. Formal wage work and nonfarm self-employment offer much higher levels of
income per hour compared to those of farm work and informal wage work.
T able 1
C om position o f h ou seh o ld incom e a n d p a rtic ip a tio n in a n d re tu rn s fro m d iffe re n t
activities
In c o m e a n d its c o m p o n e n ts
In co m e p e r
Annual
Annual
S hare o f
P a rticip a tio n
w o rk in g h o u r
in c o m e p e r
in c o m e
to ta l
rate
h o u s e h o ld
p e r c a p ita
in c o m e
(% )
(%)
Total in c o m e
1 4 .2 2
6 0 ,6 4 2
1 3 ,5 1 3
SD
9 .5 0
3 3 ,0 3 4
7 ,0 9 1
N o n fa rm in co m e
1 2 .8 0
4 2 ,8 0 1
9 ,5 3 7
7 .1 2
3 3 ,5 7 1
7 ,1 4 0
A . In fo rm a l w a g e in c o m e
1 0 .0 6
1 1 ,5 5 9
2 ,5 7 6
SD
4 .1 0
1 7 ,7 0 3
3 ,9 7 3
B. F o rm a l w a g e in c o m e
1 4 .7 0
1 4 ,4 3 1
3 ,2 1 6
SD
8 .6 0
2 9 ,7 6 2
6 ,2 3 2
1 4 .5 2
1 6 ,8 1 1
3 ,7 4 6
SD
8 .5 7
2 7 ,8 0 3
6 ,2 3 1
D. Farm in c o m e
1 1 .2 5
1 4 ,4 3 2
3 ,2 1 6
SD
7 .3 0
SD
C . N o n fa rm s e lf-e m p lo y m e n t
1 6 ,1 6 9
3 ,6 2 1
N o n - la b o u r in c o m e (E)
3 ,4 0 9
760
SD
8 ,6 7 6
2 ,4 1 0
6 5 .9 0
9 0 .0 0
2 3 .2 0
4 0 .3 5
1 6 .9 5
2 7 .3 0
2 5 .7 4
4 3 .2 8
2 7 .6 9
8 3 .0 4
6 .4 1
3 1 .8 8
N o t e : SD (sta n d a rd d e v ia tio n s ). Estim ates in c o lu m n s 3 - 6 a re a d ju s te d fo r s a m p lin g w e ig h ts. N = 4 7 7 . in c o m e
a n d its c o m p o n e n ts m e a su re d in V N D 1 ,0 0 0 . U SD 1 e q u a te d to a b o u t V N D 1 8 ,0 0 0 in 2 0 0 9 . N o n fa rm
in c o m e = ( A + B + C ) .
Table 2 presents the four main types of labour income-based strategies (liveli
hoods A to D) that households pursued before and after farmland acquisition, which
were classified using cluster analysis. Cluster analysis also identified 21 households that
pursued the non-labour income-based strategy (livelihood E) after farmland loss, as
compared to io households that followed this strategy before farmland loss. House
hold livelihood strategies have dramatically changed after farmland loss. Prior to
farmland loss, the proportion of households pursuing livelihood D used to be predom
inant, accounting for nearly half of the total households. This share, however, almost
halved to around one-fifth of total households after farmland loss. Simultaneously,
an increase is observed in all other types of livelihoods. This suggests that the loss of
farmland has had a considerable effect on the choice of household livelihood strategy.
Tran Q u a n g Tuyen, Steven Lim , M ic h a e l R C a m e ro n a n d Vu V an H u o n g
366
T a b le 2
H o u s e h o ld s ' p a s t a n d c u r r e n t liv e lih o o d s tr a te g ie s
C h a n g e s in liv e lih o o d strate g ie s o f h o u s e h o ld s
L iv e lih o o d strate g y
W h o le sa m p le
L a n d -lo s in g h o u s e h o ld s
N o n -la n d -lo s in g h o u s e
h olds
Past
Past
C u rre n t
In fo rm a l w a g e w o rk (A)
99
1 25
46
77
53
48
F orm al w a g e w o rk (B)
84
100
26
42
58
58
N o n fa rm s e lf-e m p lo y m e n t (C)
73
128
27
62
46
67
211
103
131
41
80
62
10
21
7
15
3
6
477
477
237
237
240
240
Farm w o rk (D)
N o n -la b o u r in c o m e (E)
Total
C u rre n t
Past
C u rre n t
N o t e : Ten h o u s e h o ld s th a t d e p e n d e d la rg e ly o r to ta lly o n n o n -la b o u r in c o m e w e re e x c lu d e d fro m clu ste r
a n a lysis o f th e past liv e lih o o d strategy b e ca use they h a d n o o r little tim e a llo c a tio n to la b o u r a ctivitie s.
Determinants of household income shares by source
Table 3 and Table 4 report the estimation results from the fractional logit and
fractional multinomial logit models. Note that RPRs (Relative Proportion Ratios)
are the exponentials of coefficients to measure the change in the relative proportion
of income shares due to a unit increase in the explanatory variable, while keeping
all other variables constant. Both sets of the results show that many coefficients are
statistically significant, with the pattern of signs as expected. As shown in Table 3, the
coefficients on the land loss variables in both years are highly statistically significant
and negative, suggesting that a higher level of land loss is closely linked with a lower
proportion of farm income. Holding all other variables constant, if the land loss in
2009 and land loss in 2008 rises by 10 percentage points the relative proportion of
farm income share decreases 12 per cent and 18 per cent, respectively.
As indicated in Table 4, the coefficients on the land loss variables in both years are
statistically significant and positive, suggesting that land loss is positively associated
with the share of all nonfarm income sources except for nonfarm self-employment
income, where the coefficient on land loss in 2009 is not significant. Among nonfarm
income sources, land loss is found to be most positively related to the share of informal
wage income. Holding all other variables constant, a 10 percentage-point increase in
land loss in 2009 and in 2008 corresponds with around a 17 per cent and a 32 per cent
increase respectively in the relative proportion of the informal wage income share.
The corresponding figures for the increases in the share of formal wage income are 16
and 18 per cent. For the case of the share of nonfarm self-employment income, only
land loss in 2008 is statistically significant with a 14 per cent increase in the relative
proportion. This implies that there may be some potentially high entry barriers to
Farmland loss, nonfarm diversification and inequality among households in Hanoi
367
adopting nonfarm self-employment, and simultaneously easier access to informal
wage work, which makes this type of employment the most popular choice among
land-losing households. A similar trend was also observed in a peri-urban village of
Hanoi by Do (2006), and in some urbanising communes in Hung Yen, a neighboring
province of Hanoi by Nguyen et al. (2011).
Table 3 Fractional logit estimates for determinants of farm income share
Farm in c o m e share
E x p la n a to ry v a ria b le s
RPRs
SE
C o e ffic ie n ts
SE
(0 .5 3 0 )
Land loss 2 0 0 9
0 .2 7 8 0 * *
( 0 .1 4 7 )
- 1 .2 7 8 * *
Land loss 2 0 0 8
0 .1 3 2 * **
( 0 .0 5 5 )
- 2 .0 2 4 * * *
(0 .4 1 9 )
H o u s e h o ld size
1 .1 7 2 * * *
( 0 .0 6 7 )
0 .1 5 9 * **
(0 .0 5 8 )
D e p e n d e n c y ra tio
0 .8 1 6
(0 .1 0 8 )
- 0 .2 0 4
(0 .1 3 2 )
N u m b e r o f m a le w o rk in g m em b e rs
0 .9 3 9
( 0 .1 0 1 )
- 0 .0 6 3
(0 .1 0 8 )
1 .5 8 0 * *
(0 .3 0 9 )
0 .4 5 7 * *
(0 .1 9 5 )
0 .9 9 5
( 0 .0 0 8 )
- 0 .0 0 5
(0 .0 0 8 )
H o u s e h o ld h e a d 's g e n d e r
H o u s e h o ld h e a d 's a g e
A g e o f w o rk in g m em b e rs
1 .0 3 6 * ’ *
(0 .0 1 2 )
0 .0 3 5 * **
(0 .0 1 2 )
E d u c a tio n o f w o rk in g m em b e rs
0 .8 7 6 * **
(0 .0 3 1 )
- 0 .1 3 3 * * *
(0 .0 3 5 )
S o cia l c a p ita l
F a rm la n d p e r a d u lt
R esidential la n d size
0 .9 6 5
(0 .0 5 0 )
- 0 .0 3 6
(0 .0 5 2 )
1 .1 4 9 * * *
(0 .0 4 7 )
0 .1 3 9 * **
(0 .0 4 1 )
1 .0 01
(0 .0 0 5 )
(0 .0 0 5 )
0 .0 0 1
0 .6 2 7 * * *
(0 .1 0 0 )
- 0 .4 6 8 * * *
(0 .1 6 0 )
0 .9 4 3
(0 .1 6 3 )
- 0 .0 5 9
(0 .1 7 3 )
In fo rm a l c re d it
1 .4 7 0 * *
(0 .2 8 6 )
0 .3 8 5 * *
(0 .1 9 5 )
P ro d u ctive a ss e ts /w o rk in g m e m b e rs (Ln)
1 .1 8 0 * *
(0 .0 8 4 )
0 .1 6 5 **
(0 .0 7 1 )
H o u se lo c a tio n
F o rm a l c re d it
Past in fo rm a l w a g e w o rk
0 .3 0 3 * **
(0 .0 6 9 )
- 1 .1 9 3 * * *
(0 .2 2 7 )
Past fo rm a l w a g e w o rk
0 .2 8 3 * **
(0 .0 7 2 )
- 1 .2 6 1 * * *
(0 .2 5 4 )
Past n o n fa rm s e lf-e m p lo y m e n t
0 .1 7 4 * * *
(0 .0 4 2 )
- 1 .7 5 1 * * *
(0 .2 4 3 )
0 .0 5 3 * * *
(0 .0 5 0 )
- 2 .9 3 0 * * *
(0 .9 4 2 )
C o m m u n e d u m m y (in clu d e d )
In te rce p t
O b s e rv a tio n s
Log p se u d o lik e lih o o d
457
- 1 0 4 0 9 .8 6 3 5 7
N o te : Estim ates a re a d ju ste d fo r s a m p lin g w e ig h ts. RPRs a re re la tiv e p ro p o r tio n ra tio s. SE: ro b u s t sta n d a rd
e rro rs. *, * * , * * * m e a n sta tistica lly s ig n ific a n t a t 1 0 % , 5% a n d 1%, respectively.
Tran Q uang Tuyen, Steven Lim; Michael R Cameron and Vu Van Huong
368
Table 4
Fractional multinomial logit estimates for determinants of nonfarm income shares
Explanatory variables
Informal wage income share
Formal wage income share
RPRs
Coefficients
RPRs
Coefficients
Land loss 2009
4.984**
1.606”
4.309*
1.461*
(3.177)
(0.638)
(3.365)
(0.781)
Land loss 2008
15.937**’
2.769***
5.400***
1.686***
(8.778)
(0.551)
(3.299)
(0.611)
Household size
0 .788***
-0.238***
0.920
-0.084
(0.059)
(0.075)
(0.087)
(0.095)
Dependency ratio
Number of male working members
Household head's gender
Household head's age
Age of working members
Education of working members
Social capital
Farmland/adult
Residential land size
House location
Formal credit
Informal credit
Productive assets/working members (Ln)
Past informal wage work
Past formal wage work
Past nonfarm self- employment
1.134
0.125
1.007
0.006
(0.194)
(0.171)
(0.302)
(0.300)
1.486***
0 .3 96 ’ **
1.259
0.231
(0.214)
(0.144)
(0.264)
(0.210)
0.831
-0.185
0.714
-0.338
(0.251)
(0.301)
(0.266)
(0.372)
0.999
-0.001
0.998
-0.002
(0.011)
(0.011)
(0.015)
(0.015)
0.948***
-0.0 5 4 **’
0.949***
-0.052***
(0.016)
(0.017)
(0.017)
(0.018)
1.009
0.009
1.339***
0 .292***
(0.064)
(0.063)
(0.090)
(0.067)
1.034
0.033
1.148*
0.138*
(0.081)
(0.078)
(0.092)
(0.080)
0.866***
-0.144***
0.879***
-0.128***
(0.046)
(0.053)
(0.043)
(0.049)
1.002
0.002
1.006
0.006
(0.006)
(0.006)
(0.011)
(0.011)
0.805
-0.217
1.147
0.137
(0.198)
(0.246)
(0.373)
(0.326)
0.906
-0.099
0.688
-0.373
(0.214)
(0.236)
(0.211)
(0.306)
0.794
-0.231
0.598
-0.515
(0.215)
(0.270)
(0.197)
(0.330)
0.697***
-0.361***
0.711***
-0.3 4 1 *’ *
(0.063)
(0.091)
(0.084)
(0.118)
6.605***
1.888***
2.812**
1.034”
(1.819)
(0.275)
(1.360)
(0.483)
0.858
-0.153
13.329***
2.590***
(0.499)
(0.582)
(4.959)
(0.372)
0.656
-0.422
1.994
0.690
(0.301)
(0.460)
(1.105)
(0.554)
263.401***
5.574***
3.743
1.320
(349.737)
(1.328)
(6.578)
(1.757)
Commune dummy (included)
Intercept
Observations
457
457
Wald chi2(96)
1185.30
Prob> chi2
0.0000
Note: Robust standard errors in parentheses. RPRs are relative proportion ratios. Estimates are adjusted for
sampling weights. *, ” , *** mean statistically significant at 10%, 5% and 1% respectively. The farm income
share is the excluded category.
Farmland loss, nonfarm diversification and inequality among households in Hanoi
369
Table 4 (continued)
Explanatory variables
Nonfarm self-employment
Other income share
income share
Land loss 2009
Land loss 2008
Household size
Dependency ratio
RPRs
Coefficients
RPRs
Coefficients
1.889
0.636
8.2 83 *’ *
2 .114***
(1.251)
(0.662)
(6.688)
(0.807)
3 .874***
1.354***
6 .7 7 6 ”
1.913**
(2.025)
(0.523)
(5.391)
(0.796)
0.937
-0.065
0.702***
-0.354***
(0.086)
(0.092)
(0.075)
(0.107)
1.269
0.239
1.926’ **
0 .6 55 *’ *
(0.201)
(0.159)
(0.365)
(0.190)
Number of male working members
0.671**
-0.400**
0 .416***
-0.876***
(0.123)
(0.183)
(0.122)
(0.293)
Household head's gender
0.510**
-0.673**
0.592*
-0.524*
(0.140)
(0.274)
(0.179)
(0.303)
1.002
0.002
1.036’ **
0.036***
(0.012)
(0.012)
(0.012)
(0.011)
0.984
-0.016
1.013
0.013
(0.015)
(0.015)
(0.021)
(0.021)
1.110**
0.104**
1.332***
0.287***
(0.056)
(0.050)
(0.087)
(0.065)
0.966
-0.035
1.062
0.060
(0.075)
(0.078)
(0.108)
(0.102)
0.839***
-0.176***
0.923
-0.080
(0.050)
(0.060)
(0.109)
(0.118)
Household head's age
Age of working members
Education of working members
Social capital
Farmland/adult
Residential land size
House location
Formal credit
Informal credit
Productive assets/working members (Ln)
Past informal wage work
Past formal wage work
Past nonfarm self- employment
0.987
-0.013
0.998
-0.002
(0.009)
(0.009)
(0.007)
(0.007)
2.936***
1.077***
0.980
-0.020
(0.649)
(0.221)
(0.281)
(0.287)
1.524*
0.421*
1.211
0.191
(0.372)
(0.244)
(0.381)
(0.315)
0.542**
-0.613**
0.587
-0.532
(0.131)
(0.241)
(0.232)
(0.395)
1.107
0.102
0.792**
-0.233**
(0.114)
(0.103)
(0.094)
(0.118)
0.639
-0.448
2.149*
0.765*
(0.221)
(0.346)
(0.939)
(0.437)
0.443**
-0.815**
5.965***
1.786***
(0.179)
(0.403)
(2.624)
7.408***
2 .002***
5 .741***
(0.440)
1.748***
(2.088)
(0.282)
(2.372)
(0.413)
-3.248*
Commune dummy (included)
Intercept
Observations
0.757
-0.279
0.039*
(1.006)
(1.329)
(0.076)
457
(1.962)
457
Wald chi2(96)
1185.30
Prob> chi2
0.0000
Note: Robust standard errors in parentheses. RPRs are relative proportion ratios. Estimates are adjusted for
sampling weights. *, **, *** mean statistically significant at 1 0%, 5% and 1% respectively. The farm income
share is the excluded category.
370
Tran Q uang Tuyen, Steven Lim, Michael R Cameron and Vu Van Huong
As expected, age of working members is positively linked to the share of farm
income but negatively related to the share of informal and formal wage income.
Schooling of working members is negatively associated with the share of farm
income, but positively correlated with that of nonfarm self-employment income and
formal wage income. The findings were also similar in Shandong Province, China,
where younger and more educated working members are more likely to participate in
off-farm activities (Huang, Wu and Rozelle, 2009).
Male-headed households were more likely to have a higher share of farm income
than female-headed households. Having more working members who are male is
associated with a higher proportion of informal wage income, but with a lower propor
tion of nonfarm self-employment income and other income. This may be because the
majority of nonfarm self-employment activities are small trades and because of the
provision of local services, which may be relatively more suitable for women. This
finding is consistent with that of Pham, Bui and Dao (2010), who found that in rural
Vietnam women are more likely than men to engage in nonfarm self-employed jobs,
while men are more likely to be wage earners in nonfarm activities. These findings are
also partly in line with Mattingly and Gregory (2006), who found that men have more
opportunities to take up paid jobs in nonfarm activities in Kumasi, Ghana, Kolkata
and Hubli Dharwad, India. However, in contrast to Mattingly and Gregory (2006),
we find that lucrative nonfarm self-employment activities are not more restricted for
women.
Farmland per adult has a negative association with every share of nonfarm labour
income. While the size of residential land is not related to any of the income shares
by source, house location is positively associated with the percentage of nonfarm selfemployment income. The relative proportion of the share of nonfarm self-employ
ment income is around three times higher for households with a conveniently situated
house than those without it, holding all other variables constant. This implies that
having a house in a prime location might allow many households to actively seize new
nonfarm opportunities. A similar phenomenon was also observed in a peri-urban
Hanoi village by Nguyen (2009) and in some rapidly urbanising areas of Hung Yen
Province by Nguyen et al. (2011), where houses with a suitable location were utilised
for nonfarm businesses such as restaurants, small shops, bars, coffee shops or beauty
salons.
Access to financial capital is related to shares of farm income and nonfarm selfemployment income, whereas each share of other income sources is not signifi
cantly related to financial capital. However, there are some interesting points to note.
Access to formal credit has a positive association with the proportion of nonfarm
self-employment income, but a similar relationship it is not observed for the case of
farm income share. In addition, while access to informal credit is positively linked
with the farm income share, it is negatively related to the nonfarm self-employment
F arm land loss, n o n fa rm d ive rsifica tio n a nd in e q u a lity a m o n g households in H a n o i
income share. Formal loans may be used for nonfarm production rather than farm
production, whereas informal loans may be used more often for farm production than
nonfarm production.6
Physical capital has a positive relationship with farm income share, but that is
not the case for nonfarm self-employment income share. This may be because the
majority of nonfarm self-employment activities are small-scale units, specialising
in small trades and the provision of local services, which may not require a large
amount of productive assets. Finally, social capital, as measured by the num ber of
group memberships, is positively associated with the formal wage income share, but a
similar association is not found for other income shares.
G in i d e co m p o sitio n by in co m e sources
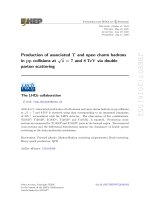
Figure i presents the distribution of income sources by income quintile. As compared
to households in the higher-income quintiles (4 and 5), the lower-income quintile
households (1 and 2) have a higher share of farm income and lower shares of nonfarm
self-employment and formal wage income. This suggests that income shares by source
are closely associated with the income distribution; specifically there is a positive associ
ation between the nonfarm self-employment income share, formal wage income share
and per capita income, but a negative correlation between the farm and informal
wage income shares and per capita income.
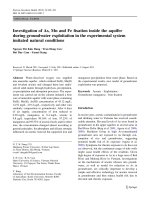
Figure 2 shows the distribution of income sources by the size of farmland
holdings. As revealed in this figure, households in the higher landholding quintiles
have a much higher percentage of farm income but a lower share of nonfarm selfemployment, formal wage income and other income. By contrast, households in the
lower landholding quintiles receive more income from nonfarm self-employment
and informal wages, which implies that households with limited farmland might be
pushed into these activities as a way to complement their income. Finally, the share of
formal wage income appears not to be associated with the distribution of farmland,
This suggests that this income source may be associated with other factors, such as
education, and the availability of formal employment provided by proximity to indus
trial zones, commercial centres and new urban areas.
6
As revealed by the surveyed households, about 45 per cent of borrowing households said that one of their purposes
of borrowing formal loans was for nonfarm production, while the corresponding figure for farm production was
only about 10 per cent. By contrast, 40 per cent answered that one of the purposes of borrowing informal loans
was for farm producuon, while the corresponding figure for nonfarm production was only around 12 per cent.
371
Tran Q uang Tuyen, Steven Lim, Michael R Cameron and Vu Van Huong
372
■Non-farm
Informal wage
■ Other income
*>Farm
100%
2
o
£
3
4
Incom e quintiles
(income per capita)
Figure 1
Income shares by source and income quintiles
i Non-farm
Formal wage ■Informal wage ■ Other income »Farm
.100%
80 %
60 %
40%
0%
2
3
4
Farm land holding quintiles
(farmland size per household)
Figure 2
Income shares by source and farmland holding quintiles
Table 5 presents the Gini decomposition of income inequality by income source.
The overall Gini coefficient for the sample households was 0.267, which is much lower
than the Gini coefficient of 0.434 f°r the whole country and 0.411 for the Red River
Delta reported by GSO (2008). This indicates a quite low degree of income inequality
among the sample households. Lower measures of inequality can be expected for
smaller geographical areas, due to the fact that households in a small region are likely
to have more similarities than households across the whole country or region (Minot,
Baulch and Epprecht, 2006).
F arm land loss, n o n fa rm d ive rsifica tio n a nd in e q ua lity a m o n g households in H a n o i
373
In previous studies on the decomposition of income inequality in Vietnam,
household income has been often disaggregated into various sources, including wage
income, nonfarm self-employment income, agricultural income and other income
(Adger, 1999; Cam and Akita, 2008; Gallup, 2002). Our paper is the first to further
break down wage income into two sub-categories, namely informal wage income and
formal wage income. The results reveal that nonfarm self-employment, formal wage
income and other income are the major contributors to overall income inequality
among the sample households. Taken together, they account for 93 per cent of the
total income inequality. By contrast, farm and informal wage income are inequalityreducing; the pseudo-Gini coefficients of these income sources are much lower than
the total Gini coefficient, whereas the pseudo-Gini coefficients for nonfarm selfemployment income, formal wage income and other income are much higher than
the total Gini coefficient. Specifically, 10 per cent increases in income from farm and
informal wage activities are associated with 1.7 per cent and 1.9 per cent declines in
the overall income inequality, respectively. In contrast, the same increase in nonfarm
self-employment, formal wage income and other income is associated with a 1.4 per
cent, 1.6 per cent and 0.57 per cent increase in the overall income inequality, respec
tively.
T a b le 5
G in i d e c o m p o s itio n o f in c o m e in e q u a lit y b y in c o m e s o u rc e
Income
Income share
Gini
source
Farm
Correlation with
Pseudo-Gini
Share to
Source elasticity
the distribution
total income
of total
of total income
inequality
inequality
Sk
Gk
Rk
GkRk
(RkGkSk)/G
(RkGkSk)/G-Sk
0.232
0.606
0.121
0.073
0.064
-0.168
0.271
0.757
0.534
0.404
0.409
0.138
0.197
0.727
0.012
0.009
0.007
-0.191
0.219
0.818
0.572
0.468
0.383
0.164
0.082
0.876
0.518
0.454
0.138
0.057
1.000
0.267
Nonfarm
self-employment
Informal
wage
Formal wage
Other
income
Total
1.000
Note: Estimates are based on annual per capita incomes. N = 477.
Looking at the third and fourth column in Table 5, the results show that the
inequality of farm and informal wage incomes among households is lower than
the inequality of nonfarm self-employment, formal wage income and other income
among households. In addition, as compared with nonfarm self-employment income,
374
Tran Q u a n g T uyen, Steven Lim , M ic h a e l R C a m e ro n a n d Vu V an H u o n g
formal wage income and other income, farm and informal wage incomes each have
a much lower correlation with the distribution of total income. Consequently, the
incomes from farm and informal wage work have had an equalising effect on the
income distribution. This finding is partly in accordance with Gallup (2002) and Cam
and Akita (2008), who found that while agricultural income reduced the inequality
of income distribution, it was nonfarm self-employment income and other income
sources that mainly contributed to inequality in Vietnam.
C on clusio n a n d p o licy im p lic a tio n s
Under the impact of farmland loss due to urbanisation and industrialisation, land
losing households have diversified into nonfarm activities. Among the sources of
nonfarm income, the income share from informal wage jobs is found to be most
positively associated with land loss, which suggests that such low-skilled, paid jobs
have been emerging as the most common choice of land-losing households in or
near Hanoi’s peri-urban areas. Possibly, this is also indicative of a high availability of
manual labour jobs in Hanoi’s peri-urban areas. According to Cling et al. (2010), the
informal sector in Hanoi offers the greatest job opportunities for unskilled workers.
Such job opportunities are also often found in Hanoi’s rural and peri-urban areas, and
those working in this sector have much a lower level of education than those in other
sectors (Cling, Razafindrakoto and Roubaud, 2011). Consequently, such job opportu
nities might allow many land-losing households to supplement a shortfall of income
with informal wage income, which in turn might mitigate the negative effects of land
loss and improve household welfare.
The results suggest an important role for natural capital in shaping peri-urban liveli
hoods. Having more farmland is associated positively with farming, but negatively with
nonfarm activities. A house or plot of residential land in a prime location is emerging
as a crucial asset that is closely linked with nonfarm household businesses. In addition,
the results indicate that there are also other important asset-related variables that are
positively related to diversifying into lucradve nonfarm activities. Access to formal
credit has a positive relationship to the share of nonfarm self-employment income.
As a result, government assistance in access to formal credit may help households
diversify into nonfarm household businesses. Better education is found to be positively
linked with shifting away from farming and diversifying toward highly remunerative
jobs. This implies that investment in children’s education may be a way to take advan
tage of opportunities for well-paid jobs for the next generation.
The results indicate that farmland loss has a negative effect on the share of farm
income, which is one of two income sources that had a reducing effect on income
inequality. Given the context of shrinking farmland due to rapid urbanisation in
Hanoi’s peri-urban areas, a declining share of farm income will be inevitable. Conse-
F arm land loss, no n fa rm d ive rsifica tio n a nd in e q ua lity a m o n g households in H a n o i
quently, increasing inequality might seemingly be difficult to avoid without restricting
farmland conversion for industrialisation and urbanisation. Nevertheless, farmland
loss has a positive effect on the share of informal wage income, which is the only
source among nonfarm income sources that had an equalising effect on the income
distribution. Thus, land loss seems to have indirect mixed impacts on the income
distribution.
This study has contributed to the understanding of the impacts of farmland loss
on nonfarm diversification and inequality, but still has several limitations that offer
possibilities for future work. First, given the loss of land due to urbanisation, peri
urban households have adapted by intensively farming small plots of land and moving
towards high value agricultural products with a ready urban market (Mattingly, 2009).
This suggests that future studies should examine the impact of land loss on agricultural
intensification and transition towards highly profitable farming. Second, although the
compensation with ‘land for land’ provides households with a plot of commercial
land they can use to change or diversify their livelihoods towards nonfarm activities
(ADB, 2007), this policy might increase inequality because some might receive plots in
a prime location (corner plots, for example) whereas many others might be allocated
plots in a non-prime location. Therefore, this interesting issue should be investigated
in future research. Finally, another interesting question for future investigation is that,
while compensation money for land loss might provide the means to help households
diversify their livelihood towards lucrative nonfarm activities, why have only a few
households used the compensation for investing in nonfarm production?
A c k n o w le d g e m e n ts
The authors thank the Vietnam Ministry of Education and Training and the Univer
sity of Waikato, New Zealand, for funding this research. The authors would like to
thank Dr Maarten L. Buis for helpful feedback regarding the STATA command for
and the interpretation of the fractional multinomial logit model authored by him.
375
Tran Q uang Tuyen, Steven Lim, Michael R Cameron and Vu Van Huong
376
A p p e n d ix 1 S u m m a ry statistics o f e x p la n a to ry v a ria b le s included in th e m odels
M
SD
M ean
SD
M in
M ax
Land loss 2 0 0 9 (%)
1 0 .2 7
2 4 .5 0
1 3 .0 0
2 7 .0 0
0 .0 0
100
Land loss 2 0 0 8 (%)
1 0 .5 0
2 4 .0 0
1 4 .0 0
2 6 .0 0
0 .0 0
100
H o u s e h o ld size
4 .4 9
1.61
4 .5 0
1.61
1
11
D e p e n d e n cy ra tio
0 .6 1
0 .6 7
0 .6 0
0 .6 5
0 .0 0
3 .0 0
1 .2 5
0 .6 9
1 .2 6
0 .7 2
0 .0 0
4
G e n d e r o f h o u s e h o ld h e a d *
0 .7 7
0 .4 8
0 .7 8
0 .4 1
0
1
A g e o f h o u s e h o ld head
5 1 .2 1
1 3 .2 4
5 1 .3 5
1 2 .6 0
21
96
E xp la n a to ry va ria b le s
F a rm la n d a c q u is itio n
H u m a n c a p ita l
N u m b e r o f m a le w o rk in g
m em bers
A g e o f w o rk in g m e m b e rs
4 0 .4 6
8 .2 5
4 0 .0 4
8 .0 7
2 1 .5 0
7 8 .0 0
E d u ca tio n o f w o rk in g m em b e rs
8 .3 7
2 .9 0
8 .3 2
2 .8 0
0
16
O w n e d fa rm la n d size p e r a d u lt
3 .4 3
2 .8 0
2 .9 2
2 .4 1
0
1 8 .1 3
Residential la n d size
2 1 .8 8
1 4 .6 2
2 2 .4 3
1 5 .2 4
0
125
H o u se lo c a tio n *
0 .3 2
0 .4 7
0 .3 0
0 .4 6
0
1
Physical c a p ita l
8 .6 3
1 .1 7
8 .6 0
1 .1 5
4 .9 4
1 1 .2 5
S o cia l c a p ita l
3 .4 3
2 .0 9
3 .4 2
2 .0 6
0
11
N a tu ra l c a p ita l
F in a n c ia l c a p ita l
F orm al c re d it*
0 .2 7
0 .4 4
0 .2 6
0 .4 4
0
1
In fo rm a l c re d it*
0 .1 9
0 .3 9
0 .2 0
0 .4 0
0
1
Past liv e lih o o d
In fo rm a l w a g e w o rk *
0 .2 2
0 .4 2
0 .2 1
0 .4 1
0
1
F orm al w a g e w o rk *
0 .1 8
0 .3 8
0 .1 8
0 .3 8
0
1
N o n fa rm s e lf-e m p lo y m e n t *
0 .1 9
0 .3 9
0 .1 6
0 .3 6
0
1
N o te : Estim ates in th e seco n d a n d th ird c o lu m n s , in c lu d in g M e a n (M) a n d s ta n d a rd e rro rs (SD) a re a d ju s te d fo r
s a m p lin g w e ig h ts; * m e a n s d u m m y va ria b le s.
R e fe re n c e s
(asian development bank) (2007), ‘A gricultural Land Conversion for Industrial and
Commercial Use: Competing Interests of the Poor’, in Asian Development Bank (ed.),
Markets and Development Bulletin, Hanoi, Vietnam, Asian Development Bank, pp. 85-93.
adger , w . n . (1999), ‘Exploring Income Inequality in Rural, Coastal Viet Nam’, TheJournal of
Development Studies, 35 , 96-119.
babatunde, r . o. (2008), ‘Income Inequality in Rural Nigeria: Evidence from Farming House
holds Survey Data’, Australian Journal of Basic and Applied Sciences, 2 , 134-40.
buis , m . l . (2008), ‘FMLOGIT: Stata Module Fitting a Fractional Multinomial Logit Model by
Quasi Maximum Likelihood [Statistical Software Components ] ’, Boston College Departadb
Farm land loss, n o n fa rm d ive rsifica tio n and in e q u a lity a m o n g households in H a n o i
ment of Economics, from />htm (accessed 10 April 2010).
cam , t . v. c. and akita , t . (2008), ‘Urban and Rural Dimensions of Income Inequality in
Vietnam’, GSIR Working Paper, Niigata, Japan, GSIR.
chen , w. (1998), ‘The Political Economy of Rural Industrialisation in China: Village Conglom
erates in Shandong Province’, Modern China, 24 , 73-96.
cling , j. p., razafindrakoto , m . and ROUBAUD, f . (2011), The informal economy in Viet Mam, Hanoi,
Vietnam, International Labour Organisation.
CLING, J . R, RAZAFINDRAKOTO, M., ROUUBAUD, F., NGUYEN, H. T. T., NGUYEN, C. H. a n d PHAN, T. T. N.
(2010), The Informal Sector in Vietnam: A focus on Hanoi and Ho Chi Mink City, Hanoi, Vietnam,
The Gioi Editions.
DENG, x., HUANG, j., r o zell e , s. and u c h id a , e . (2006), ‘Cultivated Land Conversion and Poten
tial Agricultural Productivity in China’, Land Use Policy, 23 , 372-84.
d o , t . n . (2006), ‘Loss of Land and Farmers’ Lvelihood: A Case Study in Tho Da Village,
Kim No Commune, Dong Anh District, Hanoi, Vietnam’, unpublished master’s thesis,
Uppsala, Sweden, Swedish University of Agricultural Sciences.
ell is , f . (2000), Rural Livelihoods and Diversity in Developing Countries, New York, Oxford University
Press.
fazal , s. (2000), ‘Urban Expansion and Loss of Agricultural Land: A GIS-Based Study of
Saharanpur City, India’, Environment and Urbanisation, 12 , 133—49.
fazal , s. (2001), ‘The Need for Preserving Farmland: A Case Study from a Predominantly
Agrarian Economy (India)’, Landscape and Urban Planning, 55,1—13.
gallup , j. (2002), ‘The Wage Labor Market and Inequality in Vietnam in the 1990s’, World
Bank Policy Research Working Paper No. 2896.
gso (general statistical o ffic e ) (2006), Questionnaire on Household Living Standard Survey 2006
(VHLSS-2006), Hanoi, Vietnam, General Statistical Office.
gso (g eneral statistical o f fic e ) (2008), ‘Section 9: Participation In Poverty Reduction
Programs’, in GSO (ed.), The Result of Survey on Household Living Standards 2008, Hanoi,
Vietnam, Statistical Publishing House.
Gregory , p. and mattingly , m . (2009), ‘Goodbye to natural resource-based livelihoods?
Crossing the rural/urban divide’, Local Environment, 14 , 879-90.
HA n o i m oi (2010), ‘Vubng Nhit La Giao Dat Djch Vu Cho Dan [Granting Land for Services
to People is the Biggest Obstacle]’, (accessed 5 January 2011).
han , s. s. and vu, k . t . (2008), ‘Land acquisition in transitional Hanoi, Vietnam’, Urban Studies,
45 )
1 0 9 7 -1 1 7 -
(2010), ‘Bao Cao ThuySt Minh Kidm Ke B it Dai
Nam 2010 [2010 Land Inventory Report]’, Ha Noi, Vietnam, Hoai Duc District People’s
Committee.
h o a n g , b . t . (2008), ‘Cong Nghiep Hoa Nong Thon Va Nhi'rng B iln D6i Trong Gia Dnh Nong
Thon Hien Nay: Nghien Ciru Truong Hop Xa Ai Qu6c, Nam Sach, Hai Duong. [Rural
Industrialisation and Changes in The Life of Vietnamese Rural Families : A Case Study in
Ai Quoc Commune, Nam Sach, Hai Duong]’, paper presented at the Third International
Conference on Vietnam studies, 5-7 October, Hanoi, Vietnam.
hoai duc district people ’s committee
377
Tran Q uang Tuyen, Steven Lim, Michael R Cameron and Vu Van Huong
378
(2008), ‘Giai Phong Mat Bang Tai Ha Tay: Bao Gio Het “Tac”? [Site Clearance in
Ha Tay: When Will It Be Solved?] />28&cateID=4&id=43669&code=CKE7S4366g (accessed 5 September 2011).
huang , j., wu, y. and rozelle , s. (2009), ‘Moving off the farm and intensifying agricultural
production in Shandong: a case study of rural labor market linkages in China’, Agricultural
Economics, 40, 203-18.
huu hoa (2011), ‘Moi Mat Ngong Bat Dich Vu [Waiting For Land for Services for A Very Long
Time in Vain]’, (accessed 5 May 2012).
jonasson , e . (2011), ‘Informal Employment and the Role of Regional Governance’, Review of
Development Economics, 15, 429-41.
kala , n ., KURUKULASURIYA, p. and Mendelsohn , r . (2012), ‘The Impact o f Climate Change on
Agro-Ecological Zones: Evidence from Africa’, Environment and Development Economics, i,
hop nhan
1-25-
p., murgai, r . and stern , n . (2013), ‘Nonfarm Diversification, Poverty, Economic
Mobility, and Income Inequality: a case study in Village India’, Agricultural Economics, 44,
lanjouw ,
46 i ~ 73p. (2007), Thu nhap, Dai Song, Viec Lam Cua Nguai Co Dat Bi Thu Hoi De Xay Dung
Cac Khu Cong Nghiep, Khu Do Thi, Ket Cau Ha Tang Kinh Te-Xa Hoi, Cac Cong Trunk
Cong Cong Phuc Vu Lai Ich Quoc Gia [Income, Life and Employment of Those Whose Land Was
Acquiredfor The Construction of Industrial Jones, Urban Areas, Infostructure and Public Projects],
Hanoi, Vietnam, National Political Publisher.
lerman, r . i. and yitzhaki, s. (1985), ‘Income Inequality Effects by Income Source: A New
Approach and Applications to the United States’, The Review of Economics and Statistics, 67,
le , d .
(2006), decomposing Inequality and Obtaining Marginal Effects’, Stata
Journal, 6 , 106-11.
Mattingly, m. (2009), ‘Making land work for the losers: Policy responses to the urbanisation of
rural livelihoods’, International Development Planning Review, 31, 37-53.
mattingly, m . and Gregory , p. (2006), ‘A synthesis of peri-urban interface knowledge. Scien
tific report. Annex A of the Final Techincal Report of project R 8491’, London, Develop
ment Planning Unit, University College London.
minot, n ., baulch , b . and epprecht , m . (2006), ‘Poverty and Inequality in Vietnam: Spatial
Patterns and Geographic Determinants (Research Report)’, Washington, DC, Interna
tional Food Policy Research Institute.
nguyen , v. s. (2009), ‘Industrialisation and Urbanisation in Vietnam: How Appropriation of
Agricultural Land Use Rights Transformed Farmers’ Livelihoods in a Per-Urban Hanoi
Village’, EADN working paper no. 38.
nguyen , t . d ., vu, d . t . and ph ilippe , l . (2011), ‘Peasant Responses to Agricultural Land Conver
sion and Mechanism of Rural Social Differentiation in Hung Yen Province, Northern
Vietnam’, paper presented at the 7th ASAE International Conference, 13-15 October,
Hanoi, Vietnam.
papke , l . e . and w ooldrige , j . m . (1996), ‘Econometric Methods for Fractional Response
l O pez - feldman , a .
Farm land loss, no n fa rm d ive rsifica tio n a nd in e q ua lity a m o n g households in H a n o i
Variables with an Application to 401 (k) Plan Participation Rates’, Journal of Applied Econo
metrics, 11, 619-32.
parish , w., zhe , x. and l i , f . (1995), ‘Nonfarm Work and Marketization of the Chinese Country
side’, The China Quarterly, 143 , 697—730.
PENDER, j. and gebremedhin , b . (2007), ‘Determinants of Agricultural and Land Management
Practices and Impacts on Crop Production and Household Income in the Highlands of
Tigray, Ethiopia’, Journal of African Economies, 17, 395—450.
pham , t . h ., bui, a . t . and dao, l . t . (2010), ‘Is Nonfarm Diversification a Way Out of Poverty
for Rural Households? Evidence from Vietnam in 1993-2006’, PMMA Working Paper
2010-17.
punj , g . and stewart, d . w. (1983), ‘Cluster Analysis in Marketing Research: Review and
Suggestions for Application’, Journal of Marketing Research, 20 , 134-48.
ramankutty , n ., foley , j., and olejniczak , n . (2002), ‘People on the Land: Changes in Global
Population and Croplands During the 20th century’, AMBIO: A Journal of the Human
Environment, 31 , 251—57.
shorrocks , a . f . (1982), ‘Inequality Decomposition by Factor Components’, Econometrica, 50 ,
193-211.
stark, o., TAYLOR, j. e . and yitzhaki , s. (1986), ‘Remittances and Inequality’, The Economic
Journal, 96 , 722-40.
statistics department OF hoai DUC district (2010), Statistical Yearbook of Hoai Due 20og, Hanoi,
Vietnam, Statistics Department of Hoai Due District.
toufique , k . a . and turton , c . (2002), Hand Not Land: How Livelihoods Are Changing in Rural
Banladesh, Dhaka, Bangladesh, Bangladesh Institute of Development Studies.
van den berg , m . and kumbi, g . e . (2006), ‘Poverty and the Rural Nonfarm Economy in Oromia,
Ethiopia’, Agricultural Economics, 35 , 469-75.
vietnamnet / tn (2009), ‘Industrial Boom Hurts Farmers, Threatens Food Supply: Seminar’,
(accessed 10 January 2011).
wagner , j. (2001), ‘A Note on the Firm Size-Export Relationship’, Small Business Economics, 17,
229-37.
winters , p., essam, t ., zezza , a ., davis, b . and carletto , c . (2010), ‘Patterns of Rural Develop
ment: A Cross-Country Comparison Using Microeconomic Data’, Journal of Agricultural
Economics, 61 , 628—51.
Wooldridge , j. m. (2013), Introductory Econometrics: A Modern Approach, Mason, OH, SouthWestern Cengage Learning.
world bank (2009), Improving Land Acquisition and Voluntary Land Conversion in Vietnam, Hanoi,
Vietnam, the World Bank.
world bank (2011), Compulsory Land Acquisition and Voluntary Land Conversion in Vietnam: The
Conceptual Approach, Land Valuation and Grievance Redress Mechanism, Washington, DC, the
World Bank.
379
Copyright of International Development Planning Review is published by Liverpool
University Press, and its content may not be copied or emailed to multiple sites or posted to a
listserv without Liverpool University Press's express written copyright permission. However,
users may print, download, or email articles for individual use.