DSpace at VNU: Graphene sheets synthesized by ionic-liquid-assisted electrolysis for application in water purification
Bạn đang xem bản rút gọn của tài liệu. Xem và tải ngay bản đầy đủ của tài liệu tại đây (954.61 KB, 6 trang )
Applied Surface Science 264 (2013) 329–334
Contents lists available at SciVerse ScienceDirect
Applied Surface Science
journal homepage: www.elsevier.com/locate/apsusc
Graphene sheets synthesized by ionic-liquid-assisted electrolysis for application
in water purification
Chia-Feng Chang a , Quang Duc Truong b,c,∗ , Jiann-Ruey Chen a
a
b
c
Department of Materials Science and Engineering, National Tsing Hua University, Hsinchu 30013, Taiwan
Department of Chemistry, Vietnam National University, Hanoi, Viet Nam
Institute of Multidisciplinary Research for Advanced Materials, Tohoku University, Sendai 980-8577, Japan
a r t i c l e
i n f o
Article history:
Received 22 March 2012
Received in revised form 20 July 2012
Accepted 4 October 2012
Available online 13 October 2012
Keywords:
Graphene
Water purification
Heavy metal
Ionic liquids-assisted electrolysis
a b s t r a c t
A facile and green synthesis of graphene sheets by ionic-liquid-assisted electrolysis was investigated in
this work. The synthesized graphene sheets have been studied using transmission electron microscopy
(TEM), atomic force microscopy (AFM), X-ray powder diffraction (XRD), Raman spectroscopy (Raman)
and Fourier transform infrared (FTIR) analysis. The obtained graphene was used for the adsorption of
Fe2+ whose presence in the drinking water in wide areas of South Asia has been widely known. The result
shows that the graphene could absorb Fe2+ with a capacity of 299.3 mg/g which is 6 times higher than
that of graphite oxide. The adsorption properties of metal ions on graphene and the effects of various
factors on the adsorption capacity were also investigated in detail. The research results suggest a novel
material for developing highly efficient water purification materials for the developing economies.
© 2012 Elsevier B.V. All rights reserved.
1. Introduction
Elevated concentrations of geogenic As and related heavy metal
in groundwater raises a threat to the health of tens of millions
of people living in the large delta areas of South Asia. In the Red
River delta, Vietnam, an estimated 11 million people who are using
groundwater as the major domestic water source for daily life are
at risk [1]. Although it has been found that several geochemical processes involve in the release of As into groundwater, the reduction
of As-containing Fe-oxides with natural organic matter is generally considered the most important mobilization mechanism [2,3].
Therefore, the contamination of As always associates with the elevated concentration of Fe(II) in the groundwater. The investigation
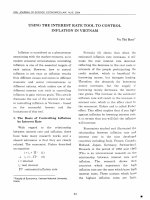
of As and Fe contaminations in Red River aquifer using random
monitoring wells in Northern Vietnam showed that the concentration of Fe increases linearly with that of As (Fig. 1). Thus, beside
the task of removing As from groundwater, the removal of Fe in
groundwater is still challenging the engineer in the environmental
research.
Many approaches have been employed to remove metal ions
from contaminated water including precipitation, ion-exchange,
membrane filtration, and adsorption [4–7]. However, adsorption is
∗ Corresponding author at: Institute of Multidisciplinary Research for Advanced
Materials, Tohoku University, Sendai 980-8577 Japan. Tel.: +81 22 2175651;
fax: +81 22 2175651.
E-mail address: (Q.D. Truong).
0169-4332/$ – see front matter © 2012 Elsevier B.V. All rights reserved.
/>
most promising approach for the removal of metal ions from water
owing to its simplicity, cost-effectiveness, and enabling large-scale
application. Therefore, adsorption method is widely used for processes of the magnitude of municipal water supplies to small
domestic water filters, particularly as packed bed filters. For practical use, there are several materials which could absorb heavy
metals effectively, such as activated carbon, fly ash, prawn shell
and peanut hull pellet [8–10]. In fact, people in the Red River
delta, Vietnam is currently using hand-made filter containing natural sand and activated carbon for cleaning the domestic water.
The current research has been focused and developed new adsorbents with better absorptive capacity for water purification. To
date, the adsorption of metal ions onto carbon nanotubes (CNT)
has been investigated extensively. Recently, it has been suggested
that graphene oxide and graphite oxide can be practically used for
separation of arsenic and heavy metal from water [11,12]. As far as
the authors know, the adsorption properties of graphene, a newly
emerging member of carbon materials, for heavy metal ions have
not been reported up to now.
Graphene with hexagonally, sp2 -hybridized and one-atomthick layer structures, has attracted extraordinary research interest
since Geim and Novoselov, awarded the Nobel Prize in Physics
2010, explored for the first time [13–17]. Theoretical and experimental studies have proved its outstanding mechanics, electricity,
chemicals, thermal stability, specific surface areas, mobility of
charge carriers, and thermal conductivity [14–17]. Therefore, great
attention has been devoted on the study the applications of
graphene such as solar cells, sensors, transistors, supercapacitors,
330
C.-F. Chang et al. / Applied Surface Science 264 (2013) 329–334
Fig. 1. The relationship between Fe(II) and As(III) concentration in groundwater.
and composite materials. In comparison with well-known CNTs,
graphene could be soluble in normal solvents or polymers without reducing ideal intrinsic properties by chemical variations.
Hence, graphene provides many advantages over other carbon
materials. In this study, we focused on studying the removal
of high concentration of Fe2+ by using graphene as adsorbent.
High concentration of heavy metal such as Fe2+ intake adverse
health effects and long-term exposure to metal can cause acute
gastrointestinal effects [18,19]. Therefore, removal of iron from
ground water is highly desirable, especially, for South Asia
where contamination of As and Fe in groundwater is a serious
problem.
2. Experimental
2.1. Synthesis of graphite oxide and graphene sheets
Graphene was synthesized by ionic-liquid-assisted electrolysis according to a procedure reported by Liu et al. [20]. The
electrolytes consist of ionic liquid, 1-octyl-3-methylimidazolium
hexafluorophosphate ([C8mim][PF6 ]), and water. In typical experiment, two high-purity graphite oxide rods as the electrodes were
inserted into the solution of ([C8mim][PF6 ])/water (1 g in 15 mL
water), paralleled with a distance of 4.0 cm. DC voltage of 15 V was
applied to two graphite rods by Keithley 2400 model potentiostat.
After electrolyzing for 0.5 h, the anode graphite rod was corroded
and black precipitate appeared in the reactor. After electrolyzing for
12 h, the precipitate was taken out of the reactor, and was washed
thoroughly with deionized water. Then it was dried at 60 ◦ C in the
electric oven for 6 h. Finally, the mixture of graphene and graphite
oxide was obtained. Since the graphite oxide is more hydrophilic
than graphene, it can be separated from graphene by using polar
and non polar solvent dispersion. Particularly, mixture of toluene
(90 vol.%) and H2 O (10 vol.%) was used to separate graphite oxide
and graphene. Typically, mixture of graphite oxide and graphene
was dispersed in water. The precipitation of agglomerated graphite
oxide sheets was immediately observed in water after the addition
of toluene to the aqueous solution. After collecting the aqueous suspension three times, graphite oxide and graphene could be isolated.
Finally, graphite oxide and graphene sheets were dried at 60 ◦ C in
the electric oven for another 6 h.
2.2. Characterization
The morphology of the obtained structures was examined
using transmission electron microscopy (TEM) of JEM-2100F. The
thickness measurement of Graphene sheets was conducted with
tapping mode atom force microscopy (AFM, SPA-400 SPM unit
from Seiko, Japan). 10 mg graphite oxide and graphene sheets were
dispersed in DMF for TEM and AFM measurements. The X-ray powder diffraction (XRD) measurements on a Rigaku D/max-IIB X-ray
˚ was performed
diffractometer with Cu K␣ radiation ( = 1.5418 A)
to identify the crystallite phase of the sample. In order to identify
the graphene material in the synthesized products, Raman measurement with 514 nm excitation wavelength at room temperature
was carried out. The spectra were acquired by a Jasco R-3000 Raman
spectrometer in the backscattering geometry using 514 nm wavelength and laser power of 90 W for excitation. The incident beam
was focused on the sample through the 100× lenses of microscope
into the spot of 2 m size. The FTIR measurement was carried
out using universal attenuated total reflectance Fourier transform infrared (UATR-FTIR) over the range from 4000 to 650 cm−1 .
For specific surface area determination, 25 mL dye solutions with
20–120 mg L−1 was introduced separately into 25 mL (adsorbent:
0.5 mg mL−1 ) conical flasks and proceeded methylene blue (MB)relative surface area measurement.
2.3. Batch adsorption experiments
Batch adsorption experiments were conducted to determine
the Fe(II) adsorption capacity of graphene. Iron stock solution
(1000 mg/L) was prepared by dissolving Fe(NO3 )2 (Merk, Germany)
in deionized water and further diluted to the required concentrations before use. The effect of initial and final pH on metal ion
adsorption by graphene was conducted in a pH range of 5.0–9.0.
The pH of the solution was adjusted to a desired value using appropriate concentrations of HNO3 or NaOH solutions. For the batch
tests, about 20 mg graphite, graphite oxide or graphene sheets
were added to 20 mL solution containing Fe(II) (20 mg L−1 ) while
the pH of the solution was varied from 5.0 to 9.0. After the suspensions were shaken for 24 h to achieve sorption equilibrium,
the solid phase was separated from the solution by syringe filtration. The results of kinetic sorption suggested that Fe(II) sorption
on graphite oxide and graphene sheets achieved equilibrium after
several hours. The concentrations of Fe(II) in the filtrate were determined by atomic absorption spectroscopy (PerkinElmer 3110). All
the experimental data were the average of duplicate determinations, and the relative errors were about 5%. The adsorption
experiment was also performed with Co(II). The amounts of Fe(II)
or Co(II) ions adsorbed on graphite, graphite oxide and graphene
sheets (mg/g) were calculated from the initial concentration (C0 )
and the equilibrium one (Ce ) (qe = (C0 − Ce ) × V/m, where V is the
volume of the suspension, and m is the mass of graphite, graphite
oxide or graphene sheets).
3. Results and discussion
3.1. Characterization of the synthesized materials
The XRD pattern of graphite (Fig. 2) presents very sharp diffraction peak at 2Â = 26.5◦ , which can be indexed to the {0 0 2} peak
of graphitic structure of carbon. This peak only appears in the
cases of graphene sheets and graphite but not in graphite oxide
sheets. In particular, when graphite was oxidized to graphite oxide,
a new diffraction peak appears at 2Â = 10.5◦ , along with the disappearance of the diffraction peak {0 0 2} in the XRD pattern of
the product. In the XRD pattern of graphene, a typical diffraction
peak at 2Â = 27.5◦ [21,22] was observed which is broaden, indicating
the smaller crystalline size of graphene in single layer or few layers structure. The calculated d-spacing between layers of graphite
oxide and graphene sheets are 0.84 nm and 0.32 nm respectively.
C.-F. Chang et al. / Applied Surface Science 264 (2013) 329–334
Fig. 2. The XRD patterns of graphite, graphite oxide and graphene sheets.
The crystalline nature and morphology of graphite oxide
and graphene sheets was investigated using TEM. Fig. 3 shows
TEM images and corresponding selected-area electron diffraction
(SAED) of the obtained graphite oxide and graphene sheets. The
thinner layers and higher crystalline nature of graphene sheets
than graphite oxide is revealed. Selected area electron diffraction
was performed on the graphite oxide and graphene sheets and the
corresponding SAED patterns are shown as the inset in Fig. 3. The
diffraction rings can be fully indexed to the hexagonal graphitic
structure, indicating the crystalline nature of the graphite oxide
and graphene sheets.
The obtained graphite oxide and graphene sheets were further analyzed by AFM and the results are shown in Fig. 4. The
AFM analysis reveals the presence of graphite oxide and graphene
sheets with average thickness of 3.0 and 0.98 nm respectively,
which are consistent with result of previous report [20]. Particularly, the graphene sheet thickness of 0.98 nm is characterized of
single layer graphene synthesized by ionic-liquid-assisted method
[20]. This thickness is thicker than the theoretical value of a single
layer (0.34 nm), which may be due to the presence of functionalized
hydrocarbon chains and PF6 − attached to graphene sheets. These
331
AFM images also reveal that the exfoliation of graphite has been
occurred.
X-ray photoelectron spectroscopy (XPS) was used to verify the
element binding configuration in graphite oxide and graphene
sheets (Fig. 5). The presence of C and O elements from the survey scan of graphite oxide and graphene sheets is revealed. The
presence of O proves that graphite has been oxidized by hydroxyl
and oxygen radicals at the electrode. The characterization peak of
C O, C O, COOH and the peak area in XPS spectra indicate the
change of composition during the electrolysis (Fig. 5). The relative
peak area of the C 1s to O 1s in graphene is higher than that in
graphite oxide. This evidence indicates that the concentration of
the C C moiety of graphene is higher than that of graphite oxide,
suggesting the smaller amount of oxygenated functional groups in
exfoliated graphene sheets.
The successful exfoliation of graphite into graphene was further verified by Raman spectra. In the Raman spectrum of natural
graphite (Fig. 6), there are two peaks at 1580 cm−1 and 2736 cm−1
respectively. The peak at 1580 cm−1 corresponds to an E2g mode
related to the sp2-bonded carbon atom’s vibration in a 2D hexagonal lattice. And the peak at 2736 cm−1 arises from the second order
of zone-boundary phonons of graphite. However, the major features, commonly observed in all chemically processed graphene,
are the D band at 1354 cm−1 , G band at 1567 cm−1 , and 2D band
at 2736 cm−1 . The D band shows the presence of sp3 defects. The
presence of the sharp 2D band of graphene at 2723 cm−1 is presumably due to two phonon double resonances Raman process.
The shape of the 2D band of graphene is similar to that of previously characterized graphene, indicating the presence of few layers
for the synthesized graphene. The exfoliated graphite oxide has a
high density of defects as evident from the stronger D peak in the
Raman spectrum in Fig. 6. Due to the presence of oxygenated functional groups, surface defects are formed. It is also suggested that
the D band arises from edge defects as well as the larger surfaceto-volume ratio. The extracted graphene has sharp sp2 bonds in 2D
system and the graphene provides high aspect ratio structure are
evidenced.
We observed the different functional groups of graphite,
graphite oxide and graphene sheets in the FTIR spectra
as shown in Fig. 7. The absorption peaks are observed at
3398–3428 cm−1 ( OH), 1681 cm−1 (C O), 1598–1603 cm−1
(skeletal vibrations from oxidized graphite domains),
1529–1543 cm−1 ( ph), 1205–1279 cm−1 (C OH stretching
vibrations) and 1086 cm−1 (C O stretching vibrations). C O
Fig. 3. TEM images and SAED of graphite oxide (a) and graphene sheets (b).
332
C.-F. Chang et al. / Applied Surface Science 264 (2013) 329–334
Fig. 4. AFM images of graphite oxide (a) and graphene sheets (b).
Fig. 5. XPS spectra of graphite oxide (a, c) and graphene sheets (b, d).
C.-F. Chang et al. / Applied Surface Science 264 (2013) 329–334
333
Fig. 6. Raman spectra of graphite, graphite oxide and graphene sheets.
group was only found in the spectrum of graphite oxide
structure. From FTIR investigation, it has been proved that
graphite was transferred to the graphite oxide and graphene
structures.
On the basis of above result, the formation of graphene by electrolysis can be understood as follows. Typically, after applying
voltage, hydroxyl and oxygen radicals were produced inevitably.
These radicals were formed by oxidation of dissociated water. Consequently, the graphite anode was oxidized to produce the graphite
oxide. At the same time, the reduction of the cation from ionic liquid, leads to the formation of the 1-octyl-3-methylimidazolium
free radical. The radical can combine with one of the electrons
of the p-bond of the graphite [20]. The complicated interactions
between ionic liquid and graphite, including Coulomb interaction and − interactions, could exfoliate graphite into graphene
sheets. In addition, ionic liquid also provides the anionic ion to
open layers between the graphite structures. Thus, the production of graphite oxide and graphene occurred through several
steps as follows: (a) oxidation of water and ionic liquid at anode
to produce the hydroxyl, oxygen radicals and free radical from
ionic-liquid; (b) the anionic BF6 − and free radical from ionic
Fig. 8. Effect of pH on the sorption (qe ) of Fe(II) (a), and Co(II) (b) on graphite,
graphite oxide, and graphene sheets.
liquid depolarized and expanded the graphite into graphene
sheets; (c) the radicals oxidized the graphite into the graphite
oxide.
3.2. The adsorption of heavy metals
Fig. 7. FTIR spectra of graphite, graphite oxide and graphene sheets.
The adsorption of Fe2+ and Co2+ on graphite, graphite oxide and
graphene sheets under the different pH values were studied (Fig. 8).
The adsorption capacity is characterized by adsorptions amount
of metal ion/mass of adsorbent (qe , mg/g). It was found that the
adsorption capacity of graphene sheets is 6–7 times higher than
that of graphite oxide sheets. The adsorption capacities of graphene
sheets increased sharply vs. pH value in range of 5.0–8.0 and reach
maximum value of 299.3 and 370 mg/g for Fe(II) and Co(II), respectively. The lower adsorption capacity at pH 9.0 may be due to the
formation of hydroxide Fe(OH)2 and Co(OH)2 , which reduced number of metal ions adsorbed on the graphene surface. On the other
hand, the adsorption competition of H+ with metal ions for adsorption sites resulted in low adsorption capacity at low pH condition.
It was reported that the isoelectric point (IEP) of graphene where
the zeta potential equals zero is 4.7 [23]. This indicates that at
pH > IEP, the graphene has negative surface charge, which benefits
for adsorbing cations. Thus, the increase of the adsorption capacity in pH range of 5.0–8.0 may be attributed to the electrostatic
interaction between negatively charged surface of graphene and
metal cation. The highest adsorption of Fe2+ and Co2+ on graphene
sheets at pH 8.0 is presumably due to negatively charged surface of
334
C.-F. Chang et al. / Applied Surface Science 264 (2013) 329–334
graphene. Thus, it can be concluded that the electron rich surfaces
of the graphene sheets offered the strongest attraction to metal
cations at pH 8.0.
The adsorption capacity of graphene is higher than those of
SWCNTs and MWCNTs [24]. In comparison of the adsorption rate,
the free energy (Ea ) of metal ions to be adsorbed onto material
surface should be considered. The faster rate of adsorption indicates the lower free energy Ea . Thus, it is proposed that the Ea
of metal ions adsorbed on graphene is less than those on SWCNTs and MWCNTs [24]. Due to the structure of multiple atomic
layers (MWCNT) or curly ones (SWCNTs), the metal ions require
more energy (higher Ea ) to diffuse and adsorb on these structures.
It was also found that the adsorption capacity to Co2+ is slightly
higher than that to Fe2+ ions. The specific cation formed electric
double layer complex on the surface of graphene, which blocked
the adsorption of other ions. The different adsorption capacities
to different metal ions are mainly depended on the metal properties. The adsorption capacity to Co2+ is slightly higher than that to
Fe2+ ions is presumably due to the smaller atom size of the Co(II)
cation. Furthermore, graphene showed higher adsorption capacity
of metal ions than those of graphite and graphite oxide is presumably due to its single layer structure and the anionic surface
properties of graphene. The methylene blue (MB)-relative surface
area of graphene was very high (605.4 ± 0.7 m2 /g, n = 3) which is
expected to be higher than those of graphite and the graphite oxide.
It is well-known that the adsorption capacity has a direct correlation with the specific surface area. The single layer structure could
provide the high surface area which contributed to high sorption
properties. Moreover, more defects occurred after the chemical
adjustment, which also reflected the interaction between metal
ions and graphite oxide structures. In summary, single layer structure could provide the high surface area which contributed to high
sorption properties. The functional group of graphite oxide may
reduce their ability for adsorption of metal ions such as Fe2+ and
Co2+ .
4. Conclusions
The graphite oxide and graphene sheets were successfully
synthesized by the ionic-liquid-assisted electrochemical method.
The maximum adsorption capacity (qe ) for Fe2+ and Co2+ on
graphene is 299.3 and 370 mg/g respectively (pH 8.0), which are
much higher than those on other reported carbon materials. The
adsorption capacity of graphene sheets is also 6–7 times higher
than that of graphite oxide sheets. The research results suggest a
novel material for developing highly efficient water purification
materials for the developing economies in South Asia.
Acknowledgement
This work was supported by National Science Council of the
Republic of China through the Contract No. NSC 95-2221-E-007 174–MY3 and Ministry of Education, Culture, Sports, Science and
Technology (MEXT) of Japan.
References
[1] M. Berg, H.C. Tran, T.C. Nguyen, P.H. Viet, R. Schertenleib, W. Giger, Arsenic
contamination of groundwater and drinking water in Vietnam: a human health
threat, Environmental Science & Technology 35 (2001) 2621–2626.
[2] J. Akai, K. Izumi, H. Fukuhara, H. Masuda, S. Nakano, T. Yoshimura, H. Ohfuji,
H.M. Anawar, K. Akai, Mineralogical and geomicrobiological investigations
on groundwater arsenic enrichment in Bangladesh, Applied Geochemistry 19
(2004) 215–230.
[3] D. Postma, F. Larsen, N.T.M. Hue, M.T. Duc, P.H. Viet, P.Q. Nhan, S. Jessen, Arsenic
in groundwater of the Red River floodplain, Vietnam: controlling geochemical
processes and reactive transport modeling, Geochimica et Cosmochimica Acta
71 (2007) 5054–5071.
[4] R.K. Allada, A. Navrotsky, H.T. Berbeco, W.H. Casey, Thermochemistry, Aqueous
solubilities of hydrotalcite-like solids, Science 96 (2002) 721–723.
[5] L. Zhang, M. Fang, Nanomaterials in pollution trace detection and environmental improvement, Nano Today 5 (2010) 128–142.
[6] I.F. Nata, C.K. Lee, Novel carbonaceous nanocomposite pellicle based on bacterial cellulose, Green Chemistry 12 (2010) 1454–1459.
[7] M.J. Manos, V.G. Petkov, M.G. Kanatzidis, A novel reusable sorbent for highly
specific mercury capture under extreme pH conditions, Advanced Functional
Materials 19 (2009) 1087–1092.
[8] Y.J. Xu, G.L. Weinberg, X. Liu, O. Timpe, R. Schlogl, D.S. Su, Advanced Functional
Materials 18 (2008) 3613–3619.
[9] J.S. Hu, L.S. Zhong, W.G. Song, L.J. Wan, Synthesis of hierarchically structured
metal oxides and their application in heavy metal ion removal, Advanced Materials 20 (2008) 2977–2982.
[10] Y. Liu, Y. Li, X.P. Yan, Preparation, Characterization, and application of l-Cysteine
functionalized multiwalled carbon nanotubes as a selective sorbent for separation and preconcentration of heavy metals, Advanced Functional Materials
18 (2008) 1536–1543.
[11] V. Chandra, J. Park, Y. Chun, J.W. Lee, I.C. Hwang, K.S. Kim, Water-dispersible
magnetite-reduced graphene oxide composites for arsenic removal, ACS Nano
4 (2010) 3979–3986.
[12] W. Gao, M. Majumder, L.B. Alemany, T.N. Narayanan, M.A. Ibarra, B.K.
Pradhan, P.M. Ajayan, Engineered graphite oxide materials for application in water purification, ACS Applied Materials and Interfaces 3 (2011)
1821–1826.
[13] S. Garaj, W. Hubbard, A. Reina, J. Kong, D. Branton, J.A. Golovchenko,
Graphene as a subnanometre trans-electrode membrane, Nature 467 (2010)
190–194.
[14] C.H. Lui, L. Liu, K.F. Mak, G.W. Flynn, T.F. Heinz, Ultraflat graphene, Nature 462
(2009) 339–341.
[15] A.K. Geim, Graphene, Status and prospects, Science 324 (2009) 1530–1534.
[16] M.J. Allen, V.C. Tung, R.B. Kaner, Honeycomb carbon: a review of graphene,
Chemical Reviews 110 (2010) 132–145.
[17] K.S. Novoselov, A.K. Geim, S.V. Morozov, D. Jiang, M.I. Katsnelson, I.V. Grigorieva, Two-dimensional gas of massless dirac fermions in graphene, Nature
438 (2005) 197–200.
[18] S. Rengaraj, S.H. Moon, Kinetics of adsorption of Co(II) removal from
water and wastewater by ion exchange resins, Water Research 36 (2002)
1783–1793.
[19] J. Goel, K. Kadirvelu, C. Rajagopal, V.K. Garg, Cadmium(II) uptake from aqueous
solution by adsorption onto carbon aerogel using a response surface methodological approach, Industrial and Engineering Chemistry Research 45 (2006)
6531–6537.
[20] N. Liu, F. Luo, H. Wu, Y. Liu, C. Zhang, J. Chen, One-step ionic-liquid-assisted electrochemical synthesis of ionic-liquid-functionalized graphene sheets directly
from graphite, Advanced Functional Materials 18 (2008) 1518–1525.
[21] W.S. Hummers, R.E. Offeman, Preparation of graphitic oxide, Journal of the
American Chemical Society 80 (1958) 1339.
[22] A.B. Bourlinos, D. Gournis, T. Szabo, A. Szeri, I. Dekany, Graphite oxide: chemical
reduction to graphite and surface modification with primary aliphatic amines
and amino acids, Langmuir 19 (2003) 6050–6055.
[23] Y. Li, P. Zhang, Q. Du, X. Peng, T. Liu, Z. Wang, Y. Xia, W. Zhang, K. Wang, H. Zhu,
D. Wu, Adsorption of fluoride from aqueous solution by graphene, Journal of
Colloid and Interface Science 363 (2011) 348–354.
[24] M.A. Salam, M.S.I. Makki, M.Y.A. Abdelaal, Preparation and characterization of
multi-walled carbon nanotubes/chitosan nanocomposite and its application
for the removal of heavy metals from aqueous solution, Journal of Alloys and
Compounds 509 (2011) 2582–2587.