DSpace at VNU: Production of J ψ and υ mesons in pp collisions at √s = 8 TeV
Bạn đang xem bản rút gọn của tài liệu. Xem và tải ngay bản đầy đủ của tài liệu tại đây (1.04 MB, 31 trang )
Published for SISSA by
Springer
Received: April 29, 2013
Accepted: May 27, 2013
Published: June 14, 2013
The LHCb collaboration
E-mail:
√
Abstract: The production of J/ψ and Υ mesons in pp collisions at s = 8 TeV is studied
with the LHCb detector. The J/ψ and Υ mesons are reconstructed in the µ+ µ− decay mode
and the signal yields are determined with a fit to the µ+ µ− invariant mass distributions.
The analysis is performed in the rapidity range 2.0 < y < 4.5 and transverse momentum
range 0 < pT < 14 (15) GeV/c of the J/ψ (Υ ) mesons. The J/ψ and Υ production crosssections and the fraction of J/ψ mesons from b-hadron decays are measured as a function
of the meson pT and y.
Keywords: Quarkonium, Heavy quark production, Particle and resonance production,
Hadron-Hadron Scattering, Flavor physics
ArXiv ePrint: 1304.6977
Open Access, Copyright CERN,
for the benefit of the LHCb collaboration
doi:10.1007/JHEP06(2013)064
JHEP06(2013)064
Production of J/ψ and Υ mesons in pp collisions at
√
s = 8 TeV
Contents
1
2 The LHCb detector and data set
2
3 Selection and cross-section determination
3
4 J/ψ meson signal
4
5 Υ meson signal
5
6 Systematic uncertainties
5
7 Results on J/ψ meson production
7
8 Results on Υ meson production
9
9 Comparison with theoretical models
10
10 Conclusions
14
The LHCb collaboration
27
1
Introduction
Successfully describing heavy quarkonium production is a long-standing problem in QCD.
An effective field theory, non-relativistic QCD (NRQCD) [1, 2], provides the foundation
for much of the current theoretical work. According to NRQCD, the production of heavy
quarkonium factorises into two steps: a heavy quark-antiquark pair is first created at short
distances and subsequently evolves non-perturbatively into quarkonium at long distances.
The NRQCD calculations depend on the colour-singlet (CS) and colour-octet (CO) matrix
elements, which account for the probability of a heavy quark-antiquark pair in a particular
colour state to evolve into a heavy quarkonium state. The CS model (CSM) [3, 4], which
provides a leading-order description of quarkonium production, was initially used to describe experimental data. However, it underestimates the observed cross-section for single
J/ψ production at high transverse momentum (pT ) at the Tevatron [5]. To resolve this
discrepancy, the CO mechanism was introduced [6]. The corresponding matrix elements
were determined from the high-pT data, as the CO cross-section decreases more slowly
with pT than that predicted by CS. More recent higher-order calculations [7–10] close the
gap between the CS predictions and the experimental data [11], reducing the need for large
CO contributions.
–1–
JHEP06(2013)064
1 Introduction
2
The LHCb detector and data set
The LHCb detector [25] is a single-arm forward spectrometer covering the pseudorapidity
range 2 < η < 5, designed for the study of particles containing b or c quarks. The detector
includes a high precision tracking system consisting of a silicon-strip vertex detector surrounding the pp interaction region, a large-area silicon-strip detector located upstream of
a dipole magnet with a bending power of about 4 Tm, and three stations of silicon-strip
detectors and straw drift tubes placed downstream. The combined tracking system has a
momentum resolution ∆p/p that varies from 0.4% at 5 GeV/c to 0.6% at 100 GeV/c, and an
impact parameter resolution of 20 µm for tracks with high pT . Charged hadrons are identified using two ring-imaging Cherenkov detectors [26]. Photon, electron and hadron candidates are identified by a calorimeter system consisting of scintillating-pad and preshower
detectors, an electromagnetic calorimeter and a hadronic calorimeter. Muons are identified
by a system composed of alternating layers of iron and multiwire proportional chambers,
with the exception of the centre of the first station, which uses triple-GEM detectors.
The data sample used in this analysis was collected during the first part of the data
√
taking period at s = 8 TeV in April 2012. During this period the average number
of interactions per crossing varied. The Υ meson analysis is based on a data sample,
corresponding to an integrated luminosity of about 51 pb−1 of pp interactions, collected
with an average of 1.3 visible interactions per crossing. The analysis for the more abundant
J/ψ mesons is based on data, corresponding to an integrated luminosity of about 18 pb−1 ,
collected with an average of 1.0 visible interactions per crossing. The trigger [27] consists of
a hardware stage, based on information from the calorimeter and muon systems, followed by
a software stage, which applies a full event reconstruction. At the hardware stage, events are
selected requiring dimuon candidates with a product of their pT larger than 1.68 ( GeV/c)2 .
In the subsequent software trigger, two well reconstructed tracks are required to have hits
in the muon system, a pT higher than 500 MeV/c, p higher than 6 GeV/c and to form a
common vertex. Only events with a dimuon candidate with an invariant mass mµµ within
–2–
JHEP06(2013)064
Studies of the production of the J/ψ and Υ (1S), Υ (2S) and Υ (3S) mesons (indicated
generically as Υ in the following) have been performed using pp collision data taken at
√
√
s = 7 TeV and at s = 2.76 TeV by the LHCb [12–14], ALICE [15–17], ATLAS [18, 19]
and CMS [20–22] experiments in different kinematic regions. As well as providing direct
tests of the underlying production mechanism, these studies are crucial to estimate the
contribution of double parton scattering to multiple quarkonium production [23, 24].
√
In this paper first measurements of quarkonium production at s = 8 TeV are reported
under the assumption of zero polarisation, an assumption that is discussed in the paper.
The differential production cross-sections of prompt J/ψ and Υ mesons, produced at the pp
collision point either directly or via feed-down from higher mass charmonium or bottomonium states, are presented in the range of rapidity 2.0 < y < 4.5 and pT < 14 GeV/c (J/ψ )
or pT < 15 GeV/c (Υ ). The fraction of J/ψ mesons from b-hadron decays, abbreviated as
“J/ψ from b” in the following, is also measured in the same fiducial region.
Variable
Track pT ( MeV/c)
Track
Value (J/ψ )
Value (Υ )
> 700
> 1000
χ2 /ndf
< 4
KL distance
Vertex
χ2
> 5000
probability
> 0.5%
tz uncertainty (ps)
Mass window mµµ
( MeV/c2 )
< 0.3
—
|mµµ − M (J/ψ )| < 120
8500 < mµµ < 11500
120 MeV/c2 of the known J/ψ meson mass [28] or larger than 4.7 GeV/c2 are retained for
further analysis.
3
Selection and cross-section determination
The selection is based on the criteria described in refs. [12, 13] and is summarised in table 1.
It starts by combining oppositely-charged particles, identified as muons, with a track pT
larger than 700 (1000) MeV/c2 for the J/ψ (Υ ) meson. Good track quality is ensured by
requiring a χ2 per degree of freedom, χ2 /ndf, less than 4 for the track fit. Duplicate
particles created by the reconstruction are suppressed to the level of 0.5 × 10⁻³ using the
Kullback-Leibler (KL) distance variable ([29, 30]; the use of the Kullback-Leibler distance
is described in [31]). To ensure good quality vertex reconstruction, the χ2 probability of
the dimuon vertex is required to be larger than 0.5 %. In addition, the primary vertex (PV)
associated to the dimuon candidate is required to be within the luminous region, defined
as |xPV | < 1 mm , |yPV | < 1 mm and |zPV | < 150 mm.
In the J/ψ analysis additional criteria are applied to the vertex quality. The uncertainty
on the pseudo decay time tz , defined in eq. 4.1, is required to be less than 0.3 ps, as
estimated by the propagation of the uncertainties given by the track reconstruction.
The simulation samples are based on the Pythia 6.4 generator [32] configured with
the parameters detailed in ref. [33]. The EvtGen package [34] is used to generate hadron
decays. The interaction of the generated particles with the detector and its response
are implemented using the Geant4 toolkit [35, 36] as described in ref. [37]. Radiative
corrections to the decay of the vector meson to dimuons are generated with the Photos
package [38].
The differential cross-section for the production of a vector meson V in a bin of (pT , y),
where V stands for a J/ψ or Υ meson, decaying into a muon pair, is
d2 σ
(pp → V X) =
dydpT
L×
N (V → µ+ µ− )
,
+ −
tot × B (V → µ µ ) × ∆y × ∆pT
(3.1)
where N (V → µ+ µ− ) is the number of observed V → µ+ µ− candidates, tot the total
detection efficiency in the given bin, L is the integrated luminosity, B (V → µ+ µ− ) is the
branching fraction of the V → µ+ µ− decay and ∆y = 0.5 and ∆pT = 1 GeV/c are the
–3–
JHEP06(2013)064
Table 1. Selection criteria for the J/ψ and Υ meson analyses. Criteria common to both analyses
are displayed between the two columns.
(a)
Candidates / (0.2 ps)
Candidates / (5 MeV/c2)
20000
LHCb
s = 8 TeV
2.5
15000
10000
105
(b)
LHCb
s = 8 TeV
2.5
Data
Total fit
J/ψ from b
Prompt J/ ψ
Wrong PV
Background
104
103
102
10
5000
1
0
3000
3050
3100
3150
3200
m( µ+µ− ) [MeV/ c2]
-10
-8
-6
-4
-2
0
2
4
6
8
10
tz [ps]
rapidity and pT bin sizes, respectively. In the case of the J/ψ → µ+ µ− decay the branching
fraction is well known, B(J/ψ → µ+ µ− ) = (5.94 ± 0.06) × 10−2 [28], and therefore it is
chosen to quote an absolute cross-section. On the other hand, the dimuon branching
fractions of the Υ mesons are known less precisely [28], and therefore, as in ref. [13], the
product of the cross-section times the dimuon branching fraction is given.
The total efficiency tot is the product of the geometric acceptance, the reconstruction
and selection efficiency and the trigger efficiency. All efficiency terms are evaluated using
simulated samples and validated with data-driven techniques in each (pT , y) bin.
The procedure to measure the integrated luminosity is described in ref. [39]. For this
analysis a van der Meer scan [40] was performed in April 2012, resulting in a measurement
of the integrated luminosity of 18.4 ± 0.9 pb−1 for the J/ψ and 50.6 ± 2.5 pb−1 for the
Υ samples.
4
J/ψ meson signal
As in the previous studies, prompt J/ψ mesons are distinguished from J/ψ from b by means
of the pseudo decay time variable defined as
tz =
(zJ/ψ − zPV ) × MJ/ψ
,
pz
(4.1)
where zJ/ψ and zPV are the positions along the beam axis z of the J/ψ decay vertex and of
the primary vertex refitted after removing the decay muons of the J/ψ candidate; pz is the
measured J/ψ momentum in the beam direction and MJ/ψ is the known J/ψ mass [28].
The yields of both prompt J/ψ mesons and J/ψ from b are determined from a twodimensional fit in each (pT , y) bin to the distributions of invariant mass and pseudo decay
time of the signal candidates, following the approach described in ref. [12]. The mass
distribution is modelled with a Crystal Ball function [41] for the signal and an exponential
function for the combinatorial background.
–4–
JHEP06(2013)064
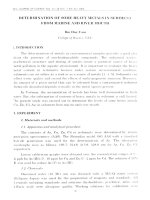
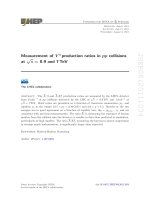
Figure 1. Projections of the fit result for a selected bin in pT and y for (a) the J/ψ invariant
dimuon mass and (b) tz . For the former, the total fitted function is shown (blue solid line) together
with the signal distribution (red dotted line). In the tz projection the total fitted function is shown
together with the J/ψ from b component, the prompt signal, the background and the tail component
due to the association of a J/ψ candidate with a wrong PV.
5
Υ meson signal
The Υ meson signal yields are determined from a fit to the reconstructed dimuon invariant
mass of the selected candidates with 8.5 < mµµ < 11.5 GeV/c2 . The distribution is
described by the sum of three Crystal Ball functions, one for each of the Υ (1S), Υ (2S)
and Υ (3S) signals, and an exponential function for the combinatorial background. The
parameters α and n of the Crystal Ball function describing the radiative tail are fixed to
the values of α = 2 and n = 1 based on simulation studies. The width of the Crystal Ball
function describing the Υ (1S) meson is allowed to vary, while the widths of the Υ (2S) and
Υ (3S) mesons are constrained to the value of the width of the Υ (1S) signal, scaled by the
ratio of the masses of the Υ (2S) and Υ (3S) to the Υ (1S) meson. The peak values of the
Υ (1S), Υ (2S) and Υ (3S) mass distributions are allowed to vary in the fit and are consistent
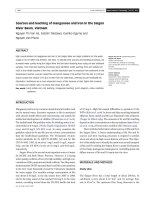
with the known values [28]. Figure 2 shows the results of the fit performed over the entire
range in pT and y. The obtained signal yields are 43 785 ± 254, 10 976 ± 155 and 5325 ± 122
for the Υ (1S), Υ (2S) and Υ (3S) mesons, respectively, with a mass resolution of the Υ (1S)
resonance of 43 MeV/c2 . The fit is repeated independently for each of the bins in pT and y.
When fitting the individual bins, the masses are fixed to the values obtained when fitting
the full range, while the mass resolution for the Υ (1S) candidates is parameterised with a
linear function of pT and y that reproduces the behaviour observed in data. Bins with too
few entries are excluded from the analysis.
6
Systematic uncertainties
Previous studies [12, 13] have shown that the total efficiency depends on the initial polari√
sation state of the vector meson. The J/ψ polarisation has been measured at s = 7 TeV
–5–
JHEP06(2013)064
The signal pseudo decay time distribution is described by a δ-function at tz = 0 for
the prompt J/ψ component together with an exponential decay function for the J/ψ from b
component. The shape of the tail arising from the association of a J/ψ meson candidate
with a wrong primary vertex is derived from the data by combining a J/ψ meson from
a given event with the primary vertex of the following event in the sample. The prompt
component of the signal function and that from b hadron decays are convolved with a
resolution function modelled by the sum of two Gaussian functions. The background
distribution is parameterised with an empirical function based on the shape of the tz
distribution observed in the J/ψ mass sidebands. It is built as the sum of a δ-function and
five exponential components, three for positive tz and two for negative tz , the negative and
positive exponential functions with the largest lifetime having their lifetimes τL fixed to
the same value. This function is convolved with a resolution function modelled by the sum
of two Gaussian functions. All parameters of the background component are determined
independently in each (pT , y) bin from the distribution of the pseudo decay time and are
fixed in the final fit. The total fit function is the sum of the products of the mass and tz
fit functions for the signal and background. Figure 1 shows the fit projections in mass and
tz for one specific bin (3 < pT < 4 GeV/c, 2.5 < y < 3.0) with the fit result superimposed.
Summing over all bins, a total signal yield of 2.6 million J/ψ events is obtained.
Candidates / (25 MeV/c2)
LHCb
s = 8 TeV
10000
8000
6000
4000
2000
0
10000
11000
m( µ+µ− ) [MeV/c2]
Figure 2. Invariant mass distribution of the selected Υ → µ+ µ− candidates in the range pT <
15 GeV/c and 2.0 < y < 4.5. The three peaks correspond to the Υ (1S), Υ (2S) and Υ (3S) meson
signals (from left to right). The superimposed curve and the signal yields (dotted) are the result of
the fit described in the text.
Correlated between bins
Mass fits
0.7 to 2.2
Radiative tail
1.0
Muon identification
1.3
Tracking efficiency
0.9
Vertexing
1.0
Trigger
4.0
Luminosity
B(J/ψ →
5.0
µ + µ− )
1.0
Uncorrelated between bins
Production model
1.0 to 6.0
tz fit, for J/ψ from b
1.0 to 12.0
Table 2. Relative systematic uncertainties (in %) on the J/ψ and Υ cross-section results and on
the fraction of J/ψ from b.
by the LHCb [42] and ALICE [43] collaborations, in a kinematic range similar to that used
in this analysis, and the Υ polarisation has been measured by CMS [44] at large pT and
central rapidity. They were both found to be small. Therefore, in this paper results are
quoted under the assumption of zero polarisation and no corresponding systematic uncertainty is assigned on the cross-section for this effect. All other systematic uncertainties are
summarised in table 2.
Uncertainties related to the mass model describing the shape of the dimuon mass
distribution are estimated by fitting the invariant mass distributions for the J/ψ and Υ
mesons with the sum of two Crystal Ball functions. The relative difference in the number
of signal events (0.7–2.2%) is taken as a systematic uncertainty. A fraction of events
has a lower invariant mass because of the energy lost through bremsstrahlung. Based on
simulation studies, about 4% of the signal events are estimated to be outside the analysis
–6–
JHEP06(2013)064
9000
7
Results on J/ψ meson production
The measured double-differential production cross-sections for prompt J/ψ mesons, under
the assumption of zero polarisation, and for J/ψ from b are given in bins of pT and y in
–7–
JHEP06(2013)064
mass windows and are not counted as signal. The fitted signal yields are corrected for this
effect and an uncertainty of 1% is assigned to the cross-section measurement based on a
comparison between the radiative tail observed in data and simulation.
The uncertainty due to the muon identification efficiency is measured on data using
a tag-and-probe method. This method reconstructs J/ψ candidates in which one muon
is identified by the muon system (“tag”) and the other (“probe”) is identified selecting a
track depositing the energy of minimum-ionising particles in the calorimeters.
The ratio of the muon identification efficiency measured in data to that obtained in
the simulation is convolved with the momentum distribution of muons from J/ψ and Υ
mesons to obtain an efficiency correction. This is found to be 0.98 ± 0.01; the uncertainty
on the correction factor is considered as a systematic uncertainty.
The uncertainty on the reconstruction efficiency of the muon tracks has also been
estimated using a data-driven tag-and-probe approach based on partially reconstructed
J/ψ decays, and it was found to be 0.9% per muon pair.
Differences between data and simulation in the efficiency of the requirement on the
vector meson vertex χ2 probability lead to a further uncertainty of 1%.
The trigger efficiency is determined using a data-driven method exploiting a sample
of events that are still triggered when the signal candidate is removed [27]. The efficiency
obtained with this method in each (pT , y) bin is used to check the efficiencies measured
in the simulation. The systematic uncertainty associated with the trigger efficiency is the
difference between that measured in the data and in the simulation. As a cross-check, the
trigger efficiency is also computed using a data sample that has not been required to pass
any physics trigger. The results obtained with the two methods are consistent.
The luminosity is determined with an uncertainty of 5%, dominated by differences in
the results obtained with a van der Meer scan [40] using the core and off-core parts of
the beam.
The dependence of the efficiency calculation on the production model used in the simulation is taken into account by varying the main parameters of the Pythia 6.4 generator
related to prompt vector meson production. These parameters define the minimum pT
cut-offs for regularising the cross-section. This effect is evaluated in each (pT , y) bin and
found to be at most 6%.
Uncertainties related to the tz fitting procedure for the J/ψ mesons are included by
changing the parameterisation used to describe the signal and background. A second fitting
method based on the sPlot technique [45] is used with the mass as the control variable to
unfold the background and to perform an unbinned likelihood fit to the pseudo decay time
distribution. The two approaches give consistent results and their difference is taken as an
estimate of the systematic uncertainty. These uncertainties are evaluated in each (pT , y)
bin and found to be a few percent.
d2σ(J/ ψ)
[nb/(GeV/c)]
d p T dy
103
(a)
LHCb
s = 8 TeV
102
10
1
y
y
y
y
y
< 2.5
< 3.0
< 3.5
< 4.0
< 4.5
10-1
0
5
10
p [GeV/ c]
d2σ(J/ ψ)
[nb/(GeV/c)]
d p T dy
T
(b)
10
LHCb
s = 8 TeV
2
10
1
2.0 <
2.5 <
3.0 <
3.5 <
4.0 <
10-1
0
y
y
y
y
y
< 2.5
< 3.0
< 3.5
< 4.0
< 4.5
5
10
p [GeV/ c]
T
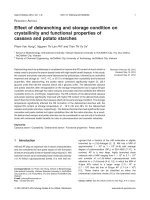
Figure 3. Differential production cross-section for (a) prompt J/ψ mesons and (b) J/ψ from b as a
function of pT in bins of y. It is assumed that prompt J/ψ mesons are produced unpolarised. The
errors are the quadratic sums of the statistical and systematic uncertainties.
tables 4 and 5, respectively, and are displayed in figure 3. The integrated cross-section for
prompt J/ψ meson production in the defined fiducial region, summing over all bins of the
analysis, is
σ (prompt J/ψ , pT < 14 GeV/c, 2.0 < y < 4.5) = 10.94 ± 0.02 ± 0.79 µb,
where the first uncertainty is statistical and the second is systematic, computed taking
correlations into account. The integrated cross-section for the production of J/ψ from b in
the same fiducial region is
σ (J/ψ from b, pT < 14 GeV/c, 2.0 < y < 4.5) = 1.28 ± 0.01 ± 0.11 µb.
The total bb production cross-section is computed as
σ(pp → bbX) = α4π
σ (J/ψ from b, pT < 14 GeV/c, 2.0 < y < 4.5)
,
2 B(b → J/ψ X)
–8–
(7.1)
JHEP06(2013)064
2.0 <
2.5 <
3.0 <
3.5 <
4.0 <
y
Prompt J/ψ
J/ψ from b
2.0–2.5
5140 ± 26 ± 49 ± 368
717 ± 6 ± 12 ± 51
2.5–3.0
5066 ± 14 ± 30 ± 363
666 ± 3 ± 9 ± 48
3.0–3.5
4573 ± 11 ± 20 ± 328
538 ± 3 ± 8 ± 39
3.5–4.0
3940 ± 11 ± 24 ± 282
388 ± 2 ± 4 ± 28
4.0–4.5
3153 ± 12 ± 16 ± 226
240 ± 2 ± 3 ± 17
6
(a)
dσ(J/ψ)
[nb]
dy
dσ(J/ψ)
[nb]
dy
x 10 3
800
LHCb
s = 8 TeV
5
(b)
LHCb
s = 8 TeV
700
600
4
500
3
400
2
300
200
1
0
100
2
3
4
0
y
2
3
4
y
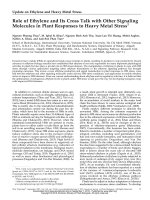
Figure 4. Differential production cross-section as a function of y integrated over pT , for (a)
unpolarised prompt J/ψ mesons and (b) J/ψ from b. The errors are the quadratic sums of the
statistical and systematic uncertainties.
where the factor α4π = 5.4 is an extrapolation factor of the cross-section from the measured
to the full kinematic region. This factor is obtained using the simulation as described in section 3. The inclusive b→J/ψ X branching fraction is B(b → J/ψ X) = (1.16 ± 0.10)% [28].
The resulting total bb cross-section is σ(pp → bbX) = 298 ± 2 ± 36 µb, where the first uncertainty is statistical and the second is systematic, which includes the uncertainty on
B(b → J/ψ X). No systematic uncertainty has been included for the extrapolation factor
α4π estimated from the simulation. For comparison, the value of the extrapolation factor
given by NLO calculations is 5.1 [46].
Table 3 and figure 4 show the differential production cross-section dσ/dy integrated over pT , for unpolarised prompt J/ψ mesons and J/ψ from b. For both components, the cross-section decreases significantly between the central and forward regions
of the acceptance.
Table 6 and figure 5 give the values of the fraction of J/ψ from b in the different bins of
pT and y. The fraction of J/ψ mesons from b-hadron decays increases as a function of pT ,
√
and, at constant pT , decreases with increasing y, as seen in the study at s = 7 TeV [12].
8
Results on Υ meson production
The double-differential production cross-sections times the dimuon branching fractions for
the Υ mesons in bins of pT and y are given in tables 7, 8, and 9, with the assumption
–9–
JHEP06(2013)064
Table 3. Differential production cross-section dσ/dy in nb for prompt J/ψ mesons (assumed
unpolarised) and for J/ψ from b, integrated over pT . The first uncertainty is statistical, the second
(third) is the part of the systematic uncertainty that is uncorrelated (correlated) between bins.
Fraction of J/ ψ from b
0.4
LHCb s = 8 TeV
2.5
3.0
0.1
5
10
p [GeV/c]
T
Figure 5. Fraction of J/ψ from b as a function of pT , in bins of y.
of no polarisation. The double-differential cross-sections are displayed in figure 6. The
integrated cross-sections times dimuon branching fractions B iS = B(Υ (iS) → µµ), with
i = 1, 2, 3, in the range pT < 15 GeV/c and 2.0 < y < 4.5 are measured to be
σ(pp → Υ (1S)X) × B 1S = 3.241 ± 0.018 ± 0.231 nb,
σ(pp → Υ (2S)X) × B 2S = 0.761 ± 0.008 ± 0.055 nb,
σ(pp → Υ (3S)X) × B 3S = 0.369 ± 0.005 ± 0.027 nb,
where the first uncertainty is statistical and the second systematic. The cross-section
times dimuon branching fractions for the three Υ states are compared in figure 7 as a
function of pT and y. These results are used to evaluate the ratios RiS/1S of the Υ (2S) to
Υ (1S) and Υ (3S) to Υ (1S) cross-sections times dimuon branching fractions. Most of the
uncertainties cancel in the ratio, except those due to the size of the data sample, to the
model dependence and to the choice of the fit function. The ratios RiS/1S as a function
of pT and y are given in tables 10 and 11, respectively, and shown in figure 8, with the
assumption of no polarisation. For this measurement the pT range has been restricted to
pT < 14 GeV/c and the y range to 2.0 < y < 4.0 to ensure enough counts for the three Υ
states in all bins. The ratios are constant as a function of y and increase as a function of
pT , in agreement with previous observations by LHCb [13] and as reported by ATLAS [19]
√
and CMS [21] at s = 7 TeV.
9
Comparison with theoretical models
The measured differential cross-sections for the production of prompt J/ψ mesons as a function of pT are compared in figure 9 to three theoretical models that assume no polarisation.
The considered models are
• an NRQCD model at next-to-leading order (NLO). The colour-octet matrix elements in this case are determined from a global fit to HERA, Tevatron and LHC
data [47, 48];
– 10 –
JHEP06(2013)064
0
0
2 1S
B1S × d
[nb/(GeV/c)]
d p Td y
1
2.0 < y < 2.5
2.5 < y < 3.0
3.0 < y < 3.5
3.5 < y < 4.0
4.0 < y < 4.5
(1S) data
(a)
10-1
10-2
10-3
LHCb
s = 8 TeV
2 2S
B2S × d
[nb/(GeV/c)]
d p Td y
10-1
5
10
2.0 < y < 2.5
2.5 < y < 3.0
3.0 < y < 3.5
3.5 < y < 4.0
4.0 < y < 4.5
(2S) data
(b)
15
p T [GeV/c]
10-2
LHCb
s = 8 TeV
2 3S
B3S × d
[nb/(GeV/c)]
d p Td y
10-3
0
10-1
5
10
2.0 < y < 2.5
2.5 < y < 3.0
3.0 < y < 3.5
3.5 < y < 4.0
4.0 < y < 4.5
(3S) data
(c)
15
p T [GeV/c]
10-2
10-3
LHCb
s = 8 TeV
10-4
0
5
10
15
p T [GeV/c]
Figure 6. Double-differential cross-sections times dimuon branching fractions as a function of pT
in bins of y for (a) the Υ (1S), (b) Υ (2S) and (c) Υ (3S) mesons.
• an NNLO* CSM [9, 10]; the notation NNLO* indicates that the calculation at nextto-next leading order is not complete and neglects part of the logarithmic terms;
• an NLO CSM [7] with the input parameters related to the choice of scale and charm
quark mass given in ref. [47].
In these comparisons it should be noted that the predictions are for direct J/ψ meson
production, whereas the experimental measurements include feed-down from higher char-
– 11 –
JHEP06(2013)064
10-4
0
0.5
LHCb
s = 8 TeV
(a)
ϒ (1S)
ϒ (2S)
ϒ (3S)
0.4
iS
BiS× d σ [nb/(GeV/c)]
dp T
0.6
0.3
0.2
0.1
iS
BiS× d σ [nb]
dy
5
10
2.5
15
p T [GeV/ c]
LHCb
s = 8 TeV
(b)
2
ϒ (1S)
ϒ (2S)
ϒ (3S)
1.5
1
0.5
0
2
2.5
3
3.5
4
4.5
y
Figure 7. Differential production cross-sections for Υ (1S), Υ (2S) and Υ (3S) mesons times dimuon
branching fraction (a) as a function of pT integrated over y, and (b) as a function of y integrated
over pT .
monium states. In particular, the contribution from J/ψ mesons produced in radiative
χc decays in the considered fiducial range was measured to be at the level of 20% at
√
s = 7 TeV [49]. Allowing for this contribution, as was seen in the previous studies, both
the NNLO* CSM and the NLO NRQCD models provide reasonable descriptions of the
experimental data. In contrast, the CSM at NLO underestimates the cross-section by an
order of magnitude.
The results for the production of J/ψ from b can be compared to calculations based
on the FONLL formalism [46, 50]. This model predicts the b-quark production crosssection, and includes the fragmentation of the b-quark into b-hadrons and their decay
into J/ψ mesons. In figure 10 the data for the differential production cross-section as a
√
function of pT and y at s = 8 TeV are compared to the FONLL predictions. Good
agreement is observed. The prediction for the total cross-section in the fiducial range of
this measurement is 1.34+0.63
presented here. In
−0.49 µb, in good agreement with the result
√
figure 11 the measurements of the cross-section for J/ψ from b at s = 2.76 [14], 7 [12],
and 8 TeV are compared to the FONLL prediction. The behaviour as a function of the
centre-of-mass energy is in excellent agreement with the prediction. This gives confidence
– 12 –
JHEP06(2013)064
0
RiS/1S
RiS/1S
0.5
0.45
0.4
0.35
0.3
0.25
0.2
0.15
0.1
0.05
0
2
LHCb
s = 8 TeV
(a)
2.0
ϒ (2S)/ ϒ (1S)
ϒ (3S)/ ϒ (1S)
5
10
p T [GeV/ c]
LHCb
s = 8 TeV
(b)
p T < 14 GeV/c
ϒ (2S)/ ϒ (1S)
ϒ (3S)/ ϒ (1S)
2.5
3
3.5
y
4
105
LHCb prompt J/ψ , 2.0 < y < 4.5
Direct NLO CSM, 2.0 < y < 4.5
104
Direct NLO NRQCD, 2.0 < y < 4.5
Direct NNLO*, 2.0 < y < 4.5
3
10
T
d σ(J/ ψ)
[nb/(GeV/c]
dp
Figure 8. Ratio of the Υ (2S) to Υ (1S) and Υ (3S) to Υ (1S) cross-sections times dimuon branching
fractions (a) as a function of pT integrated over y, and (b) as a function of y integrated over pT .
102
10
1
10-1
10-2
0
s = 8 TeV
5
10
p [GeV/ c]
T
Figure 9. Comparison of the differential cross-section for the production of prompt J/ψ meson
(under the assumption of zero polarisation) as a function of pT with direct production in an NLO
NRQCD model [47, 48] (orange diagonal shading), an NNLO* CSM [10] (solid yellow) and an NLO
CSM [7] (blue vertical shading). The points show the measurements reported in this analysis.
– 13 –
JHEP06(2013)064
0.5
0.45
0.4
0.35
0.3
0.25
0.2
0.15
0.1
0.05
0
0
(a)
LHCb J/ψ from b, 2.0 < y < 4.5
FONLL, 2.0 < y < 4.5
10
2
T
d σ(J/ ψ)
[nb/(GeV/c]
dp
103
10
1
10-1
0
5
10
15
20
p [GeV/ c]
dσ(J/ ψ )
[nb]
dy
T
1400
(b)
LHCb J/ψ from b, p < 14 GeV/ c
T
1200
FONLL, p < 14 GeV/ c
T
1000
800
600
400
200
0
s = 8 TeV
2
3
4
y
Figure 10. Differential production cross-section for J/ψ from b (a) as a function of pT in the
fiducial range 2.0 < y < 4.5, and (b) as a function of y in the fiducial range pT < 14 GeV/c. The
FONLL prediction [46, 50] is shown in yellow. The points show the measurements reported in
this analysis.
that this model can produce reliable predictions for the b-hadron cross-section at the higher
energies expected at the LHC.
In figure 12 the cross-sections times dimuon branching fractions for the three Υ meson
states are compared to the CSM NLO [7] and NNLO∗ [9] theoretical predictions as a
function of pT . The NNLO* CSM provides a reasonable description of the experimental
data, particularly for the Υ (3S) meson, which is expected to be less affected by feeddown. As for the prompt J/ψ meson production, the CSM at NLO underestimates the
cross-section by an order of magnitude.
10
Conclusions
The differential production cross-sections for J/ψ and Υ mesons are measured as a function
of pT and y in the forward region, 2.0 < y < 4.5. The analysis is based on a data sample,
corresponding to an integrated luminosity of 18 pb−1 and 51 pb−1 for the J/ψ and Υ
– 14 –
JHEP06(2013)064
s = 8 TeV
[µb]
4
LHCb J/ from b, 2.0 < y < 4.5, p < 14 GeV/ c
T
3.5
FONLL, 2.0 < y < 4.5, p < 14 GeV/ c
T
3
2.5
2
1.5
1
0.5
5
10
15
s [TeV]
Figure 11. Predictions based on the FONLL formalism [46, 50] for the production cross-section
for J/ψ from b in the fiducial range 0 < pT < 14 GeV/c and 2.0 < y < 4.5 (yellow band). The
uncertainty includes contributions from the renormalisation scale, quark masses and the choice of
PDF set. The black dotted line shows the central value of the prediction. The points show the
√
LHCb measurements at s = 2.76 [14], 7 [12], and 8 TeV.
mesons, respectively, collected in the early part of 2012 at a centre-of-mass energy of
√
s = 8 TeV. The production cross-sections of prompt J/ψ mesons and J/ψ from b are
individually measured. An estimate of the bb total cross-section is also obtained.
The results are compared with several recent theoretical predictions in the LHCb
acceptance. The NNLO* CSM and the NLO NRQCD model (for the J/ψ meson) provide
a reasonable description of the experimental data on the production of prompt J/ψ and
Υ mesons as a function of pT under the assumption of zero polarisation. This confirms
the progress in the theoretical calculations of quarkonium hadroproduction, even if the
uncertainties on the predictions are still large. Theoretical predictions based on FONLL
calculations are found to describe well the measured cross-section for J/ψ from b and its
dependence on centre-of-mass energy.
Acknowledgments
We thank M. Cacciari for providing the FONLL predictions for the b cross-section in
the LHCb acceptance, J. P. Lansberg for the NNLO* predictions for prompt J/ψ and
Υ meson production, B. Kniehl and M. Butensch¨on for the NLO NRQCD predictions
for prompt J/ψ meson production. We express our gratitude to our colleagues in the
CERN accelerator departments for the excellent performance of the LHC. We thank the
technical and administrative staff at the LHCb institutes. We acknowledge support from
CERN and from the national agencies: CAPES, CNPq, FAPERJ and FINEP (Brazil);
NSFC (China); CNRS/IN2P3 and Region Auvergne (France); BMBF, DFG, HGF and
MPG (Germany); SFI (Ireland); INFN (Italy); FOM and NWO (The Netherlands); SCSR
(Poland); ANCS/IFA (Romania); MinES, Rosatom, RFBR and NRC “Kurchatov Institute” (Russia); MinECo, XuntaGal and GENCAT (Spain); SNSF and SER (Switzerland);
NAS Ukraine (Ukraine); STFC (United Kingdom); NSF (USA). We also acknowledge the
support received from the ERC under FP7. The Tier1 computing centres are supported
– 15 –
JHEP06(2013)064
0
[nb/(GeV/c)]
ϒ (1S) data, 2.0
(a)
T
1
B1S × d σ
dp
1S
10
10-1
10-2
10-3
0
5
10
15
p [GeV/c]
10
ϒ (2S) data, 2.0
(b)
T
1
B2S × d σ
dp
2S
[nb/(GeV/c)]
T
10-1
10-2
10-3
10-4
LHCb
s = 8 TeV
0
5
10
15
p [GeV/c]
10
ϒ (3S) data, 2.0
(c)
T
1
B3S × d σ
dp
3S
[nb/(GeV/c)]
T
10-1
10-2
10-3
10-4
0
LHCb
s = 8 TeV
5
10
15
p [GeV/c]
T
Figure 12. Comparison of the differential production cross-sections times dimuon branching fractions for (a) Υ (1S), (b) Υ (2S) and (c) Υ (3S) mesons as a function of pT with direct production in
an NNLO∗ CSM [9] (solid yellow) and an NLO CSM [7] (blue vertical shading) model. The points
show the measurements reported in this analysis.
by IN2P3 (France), KIT and BMBF (Germany), INFN (Italy), NWO and SURF (The
Netherlands), PIC (Spain), GridPP (United Kingdom). We are thankful for the computing resources put at our disposal by Yandex LLC (Russia), as well as to the communities
behind the multiple open source software packages that we depend on.
– 16 –
JHEP06(2013)064
10-4
LHCb
s = 8 TeV
pT ( GeV/c)
2.5 < y < 3.0
3.0 < y < 3.5
0–1
727.45 ± 13.14 ± 25.66 ± 52.15
772.40 ± 6.84 ± 11.94 ± 55.38
727.58 ± 5.57 ± 10.31 ± 52.16
1–2
1463.31 ± 16.73 ± 19.26 ± 104.91
1473.44 ± 8.74 ± 13.74 ± 105.64
1357.44 ± 7.01 ± 11.10 ± 97.32
2–3
1237.49 ± 12.28 ± 22.39 ± 88.72
1196.41 ± 6.69 ± 20.45 ± 85.78
1083.40 ± 5.33 ± 9.91 ± 77.67
3–4
761.17 ± 7.29 ± 20.60 ± 54.57
738.03 ± 4.20 ± 8.94 ± 52.91
651.06 ± 3.45 ± 6.62 ± 46.68
4–5
432.67 ± 4.33 ± 20.79 ± 31.02
408.62 ± 2.56 ± 6.57 ± 29.30
359.82 ± 2.20 ± 4.36 ± 25.80
5–6
231.63 ± 2.60 ± 2.89 ± 16.61
217.04 ± 1.61 ± 5.01 ± 15.56
183.07 ± 1.38 ± 2.95 ± 13.12
6–7
126.50 ± 1.65 ± 2.29 ±
9.07
116.27 ± 1.07 ± 4.31 ±
8.34
97.25 ± 0.94 ± 1.76 ± 6.97
7–8
68.05 ± 1.07 ± 1.98 ±
4.88
63.25 ± 0.74 ± 1.09 ±
4.53
51.21 ± 0.64 ± 1.23 ± 3.67
8–9
39.23 ± 0.74 ± 1.88 ±
2.81
34.85 ± 0.52 ± 0.84 ±
2.50
27.34 ± 0.45 ± 0.98 ± 1.96
9–10
22.04 ± 0.52 ± 0.66 ±
1.58
19.54 ± 0.37 ± 0.49 ±
1.40
15.08 ± 0.32 ± 0.70 ± 1.08
10–11
13.60 ± 0.39 ± 0.45 ±
0.98
11.59 ± 0.28 ± 0.37 ±
0.83
8.88 ± 0.25 ± 0.15 ± 0.64
11–12
8.06 ± 0.28 ± 0.23 ±
0.58
7.29 ± 0.22 ± 0.33 ±
0.52
5.03 ± 0.18 ± 0.11 ± 0.36
12–13
5.26 ± 0.22 ± 0.20 ±
0.38
4.31 ± 0.16 ± 0.06 ±
0.31
3.30 ± 0.14 ± 0.10 ± 0.24
13–14
3.30 ± 0.17 ± 0.21 ±
0.24
2.94 ± 0.14 ± 0.07 ±
0.21
2.09 ± 0.11 ± 0.09 ± 0.15
3.5 < y < 4.0
4.0 < y < 4.5
0–1
670.50 ± 5.34 ± 6.78 ± 48.07
579.84 ± 6.08 ± 7.65 ± 41.57
1–2
1213.97 ± 6.52 ± 20.90 ± 87.04
1003.19 ± 7.18 ± 10.37 ± 71.92
2–3
926.23 ± 4.88 ± 7.50 ± 66.41
753.31 ± 5.75 ± 6.80 ± 54.01
3–4
542.09 ± 3.19 ± 5.56 ± 38.87
418.29 ± 3.89 ± 4.61 ± 29.99
4–5
284.82 ± 2.00 ± 3.44 ± 20.42
204.28 ± 2.31 ± 2.68 ± 14.65
5–6
146.41 ± 1.29 ± 2.20 ± 10.50
96.52 ± 1.39 ± 2.61 ±
6.92
6–7
73.68 ± 0.84 ± 1.33 ±
5.28
48.40 ± 0.90 ± 0.92 ±
3.47
7–8
37.39 ± 0.56 ± 0.82 ±
2.68
23.95 ± 0.59 ± 0.60 ±
1.72
8–9
20.05 ± 0.40 ± 0.52 ±
1.44
11.83 ± 0.39 ± 0.34 ±
0.85
9–10
11.04 ± 0.29 ± 0.38 ±
0.79
6.64 ± 0.27 ± 0.24 ±
0.48
10–11
6.24 ± 0.20 ± 0.28 ±
0.45
3.40 ± 0.18 ± 0.15 ±
0.24
11–12
3.85 ± 0.18 ± 0.16 ±
0.28
2.05 ± 0.14 ± 0.10 ±
0.15
12–13
2.23 ± 0.13 ± 0.05 ±
0.16
1.04 ± 0.09 ± 0.03 ±
0.07
13–14
1.49 ± 0.10 ± 0.04 ±
0.11
0.45 ± 0.06 ± 0.02 ±
0.03
2
Table 4. Double-differential cross-section dpdTσdy in nb/( GeV/c) for prompt J/ψ meson production
in bins of of pT and y, with the assumption of no polarisation. The first error is statistical, the
second is the component of the systematic uncertainty that is uncorrelated between bins and the
third is the correlated component.
– 17 –
JHEP06(2013)064
2.0 < y < 2.5
pT ( GeV/c)
2.5 < y < 3.0
3.0 < y < 3.5
0–1
71.82 ± 2.53 ± 9.44 ± 5.15
71.70 ± 1.33 ± 6.58 ± 5.14
61.63 ± 1.10 ± 6.63 ± 4.42
1–2
164.48 ± 3.49 ± 3.71 ± 11.79
157.59 ± 1.84 ± 3.88 ± 11.30
135.22 ± 1.46 ± 2.56 ± 9.69
2–3
162.88 ± 2.95 ± 3.70 ± 11.68
152.06 ± 1.62 ± 3.38 ± 10.90
121.63 ± 1.27 ± 2.08 ± 8.72
3–4
117.14 ± 2.02 ± 3.49 ± 8.40
106.89 ± 1.16 ± 1.79 ± 7.66
87.13 ± 0.95 ± 1.50 ± 6.25
4–5
75.00 ± 1.34 ± 3.71 ± 5.38
68.17 ± 0.81 ± 1.29 ± 4.89
53.63 ± 0.67 ± 0.87 ± 3.84
5–6
46.32 ± 0.91 ± 0.97 ± 3.32
41.94 ± 0.57 ± 1.07 ± 3.01
31.46 ± 0.48 ± 0.64 ± 2.26
6–7
28.96 ± 0.64 ± 0.56 ± 2.08
25.49 ± 0.42 ± 0.96 ± 1.83
18.30 ± 0.35 ± 0.37 ± 1.31
7–8
18.59 ± 0.46 ± 0.57 ± 1.33
15.36 ± 0.31 ± 0.31 ± 1.10
11.25 ± 0.26 ± 0.27 ± 0.81
8–9
11.40 ± 0.34 ± 0.55 ± 0.82
10.20 ± 0.25 ± 0.27 ± 0.73
6.88 ± 0.20 ± 0.25 ± 0.49
9–10
7.77 ± 0.27 ± 0.24 ± 0.56
6.26 ± 0.19 ± 0.17 ± 0.45
4.54 ± 0.16 ± 0.21 ± 0.33
10–11
5.23 ± 0.22 ± 0.18 ± 0.38
4.16 ± 0.15 ± 0.13 ± 0.30
2.83 ± 0.13 ± 0.06 ± 0.20
11–12
3.46 ± 0.17 ± 0.10 ± 0.25
2.82 ± 0.13 ± 0.14 ± 0.20
1.75 ± 0.10 ± 0.04 ± 0.13
12–13
2.61 ± 0.14 ± 0.11 ± 0.19
2.17 ± 0.11 ± 0.03 ± 0.16
1.35 ± 0.09 ± 0.05 ± 0.10
13–14
1.76 ± 0.11 ± 0.12 ± 0.13
1.39 ± 0.09 ± 0.04 ± 0.10
0.85 ± 0.07 ± 0.04 ± 0.06
3.5 < y < 4.0
4.0 < y < 4.5
0–1
46.51 ± 1.04 ± 1.11 ± 3.33
29.15 ± 1.03 ± 1.41 ± 2.09
1–2
100.11 ± 1.29 ± 3.76 ± 7.18
67.76 ± 1.35 ± 2.77 ± 4.86
2–3
90.70 ± 1.20 ± 1.40 ± 6.50
58.35 ± 1.22 ± 0.72 ± 4.18
3–4
62.80 ± 0.89 ± 1.38 ± 4.50
37.05 ± 0.90 ± 0.49 ± 2.66
4–5
37.98 ± 0.59 ± 0.62 ± 2.72
21.13 ± 0.61 ± 0.44 ± 1.52
5–6
20.61 ± 0.41 ± 0.37 ± 1.48
12.04 ± 0.42 ± 0.34 ± 0.86
6–7
12.09 ± 0.30 ± 0.22 ± 0.87
6.38 ± 0.29 ± 0.12 ± 0.46
7–8
7.27 ± 0.22 ± 0.16 ± 0.52
3.69 ± 0.20 ± 0.09 ± 0.26
8–9
4.19 ± 0.17 ± 0.12 ± 0.30
2.27 ± 0.15 ± 0.07 ± 0.16
9–10
2.56 ± 0.13 ± 0.09 ± 0.18
1.09 ± 0.12 ± 0.09 ± 0.08
10–11
1.42 ± 0.09 ± 0.07 ± 0.10
0.72 ± 0.08 ± 0.04 ± 0.05
11–12
1.09 ± 0.08 ± 0.05 ± 0.08
0.37 ± 0.05 ± 0.04 ± 0.03
12–13
0.73 ± 0.07 ± 0.02 ± 0.05
0.28 ± 0.04 ± 0.02 ± 0.02
13–14
0.42 ± 0.05 ± 0.02 ± 0.03
0.16 ± 0.03 ± 0.01 ± 0.01
2
Table 5. Double-differential cross-section dpdTσdy in nb/( GeV/c) for the production of J/ψ from b
in bins of pT and y. The first error is statistical, the second is the component of the systematic
uncertainty that is uncorrelated between bins and the third is the correlated component.
– 18 –
JHEP06(2013)064
2.0 < y < 2.5
pT ( GeV/c)
2.5 < y < 3.0
3.0 < y < 3.5
0–1
8.9 ± 0.3 ± 1.1
8.4 ± 0.1 ± 0.8
7.7 ± 0.1 ± 0.8
1–2
10.1 ± 0.2 ± 0.2
9.6 ± 0.1 ± 0.2
9.0 ± 0.1 ± 0.2
2–3
11.6 ± 0.2 ± 0.2
11.2 ± 0.1 ± 0.2
10.0 ± 0.1 ± 0.1
3–4
13.3 ± 0.2 ± 0.2
12.6 ± 0.1 ± 0.1
11.7 ± 0.1 ± 0.2
4–5
14.7 ± 0.2 ± 0.2
14.2 ± 0.1 ± 0.1
12.9 ± 0.1 ± 0.1
5–6
16.6 ± 0.3 ± 0.3
16.1 ± 0.2 ± 0.2
14.5 ± 0.2 ± 0.2
6–7
18.5 ± 0.3 ± 0.1
17.8 ± 0.3 ± 0.1
15.6 ± 0.3 ± 0.2
7–8
21.3 ± 0.4 ± 0.2
19.3 ± 0.3 ± 0.2
17.7 ± 0.3 ± 0.1
8–9
22.4 ± 0.5 ± 0.1
22.4 ± 0.5 ± 0.2
19.7 ± 0.5 ± 0.1
9–10
25.8 ± 0.7 ± 0.2
23.9 ± 0.6 ± 0.2
22.5 ± 0.7 ± 0.2
10–11
27.3 ± 0.9 ± 0.2
25.9 ± 0.8 ± 0.1
23.4 ± 0.9 ± 0.3
11–12
29.6 ± 1.1 ± 0.2
27.2 ± 1.0 ± 0.5
24.9 ± 1.2 ± 0.1
12–13
32.3 ± 1.3 ± 0.6
32.8 ± 1.3 ± 0.2
27.8 ± 1.5 ± 0.5
13–14
34.1 ± 1.7 ± 1.0
30.9 ± 1.6 ± 0.4
26.9 ± 2.0 ± 0.4
3.5 < y < 4.0
4.0 < y < 4.5
0–1
6.4 ± 0.1 ± 0.1
4.6 ± 0.2 ± 0.2
1–2
7.5 ± 0.1 ± 0.3
6.2 ± 0.1 ± 0.2
2–3
8.8 ± 0.1 ± 0.1
7.1 ± 0.1 ± 0.1
3–4
10.3 ± 0.1 ± 0.2
8.0 ± 0.2 ± 0.1
4–5
11.6 ± 0.2 ± 0.1
9.3 ± 0.2 ± 0.1
5–6
12.1 ± 0.2 ± 0.1
10.9 ± 0.4 ± 0.1
6–7
13.8 ± 0.3 ± 0.1
11.4 ± 0.5 ± 0.0
7–8
16.0 ± 0.4 ± 0.1
13.2 ± 0.7 ± 0.1
8–9
16.8 ± 0.6 ± 0.2
15.8 ± 0.9 ± 0.2
9–10
18.3 ± 0.8 ± 0.1
13.2 ± 1.3 ± 0.9
10–11
18.1 ± 1.1 ± 0.3
16.7 ± 1.7 ± 0.6
11–12
21.5 ± 1.5 ± 0.2
14.9 ± 2.0 ± 1.3
12–13
23.3 ± 2.0 ± 0.4
20.3 ± 3.0 ± 1.1
13–14
21.2 ± 2.1 ± 0.6
25.8 ± 4.4 ± 1.9
Table 6. Fraction of J/ψ from b (in %) in bins of of pT and y. The first uncertainty is statistical
and the second systematic (uncorrelated between bins).
– 19 –
JHEP06(2013)064
2.0 < y < 2.5
pT ( GeV/c)
2.0 < y < 2.5
2.5 < y < 3.0
3.0 < y < 3.5
0–1
73.9 ± 4.2 ± 1.8 ± 5.3
64.7 ± 2.6 ± 1.3 ± 4.6
62.1 ± 2.6 ± 0.7 ± 4.4
1–2
197.7 ± 6.8 ± 2.7 ± 14.1
185.6 ± 4.5 ± 1.9 ± 13.2
157.2 ± 4.2 ± 1.7 ± 11.2
2–3
248.1 ± 7.5 ± 2.7 ± 17.6
228.5 ± 5.0 ± 2.1 ± 16.2
210.6 ± 4.9 ± 1.6 ± 15.0
237.9 ± 7.2 ± 4.1 ± 16.9
243.5 ± 5.1 ± 1.5 ± 17.3
210.3 ± 4.9 ± 2.2 ± 15.0
220.6 ± 6.9 ± 3.1 ± 15.7
199.1 ± 4.7 ± 1.2 ± 14.2
185.0 ± 4.6 ± 0.8 ± 13.2
5–6
181.2 ± 6.1 ± 4.2 ± 12.9
177.4 ± 4.4 ± 1.8 ± 12.6
161.4 ± 4.3 ± 0.8 ± 11.5
6–7
140.1 ± 5.3 ± 4.5 ± 10.0
128.2 ± 3.7 ± 0.9 ± 9.1
116.0 ± 3.7 ± 0.6 ± 8.3
7–8
106.2 ± 4.6 ± 1.6 ± 7.6
106.3 ± 3.4 ± 1.5 ± 7.6
93.9 ± 3.3 ± 1.2 ± 6.7
8–9
75.3 ± 3.8 ± 2.3 ± 5.4
74.0 ± 2.8 ± 0.7 ± 5.3
62.3 ± 2.6 ± 0.5 ± 4.4
9–10
60.9 ± 3.3 ± 1.5 ± 4.3
56.7 ± 2.4 ± 0.7 ± 4.0
51.1 ± 2.4 ± 0.4 ± 3.6
10–11
51.4 ± 3.0 ± 1.7 ± 3.7
44.4 ± 2.1 ± 0.8 ± 3.2
32.9 ± 1.9 ± 0.3 ± 2.3
11–12
34.7 ± 2.5 ± 1.4 ± 2.5
31.1 ± 1.7 ± 0.6 ± 2.2
25.6 ± 1.6 ± 0.3 ± 1.8
12–13
29.7 ± 2.2 ± 0.3 ± 2.1
21.5 ± 1.4 ± 0.9 ± 1.5
17.0 ± 1.3 ± 0.2 ± 1.2
13–14
22.3 ± 1.9 ± 0.5 ± 1.6
16.8 ± 1.3 ± 0.1 ± 1.2
12.7 ± 1.1 ± 0.2 ± 0.9
14–15
15.6 ± 1.6 ± 0.8 ± 1.1
13.8 ± 1.1 ± 0.5 ± 1.0
10.4 ± 1.0 ± 0.2 ± 0.7
3.5 < y < 4.0
4.0 < y < 4.5
52.0 ± 3.2 ± 0.8 ± 3.7
39.7 ± 5.8 ± 0.4 ± 2.8
0–1
1–2
128.0 ± 4.9 ± 0.9 ± 9.1
82.6 ± 8.0 ± 1.9 ± 5.9
2–3
167.1 ± 5.5 ± 2.2 ± 11.9
125.4 ± 9.6 ± 1.3 ± 8.9
3–4
166.4 ± 5.5 ± 1.2 ± 11.8
130.2 ± 9.3 ± 1.2 ± 9.3
4–5
148.9 ± 5.2 ± 1.3 ± 10.6
95.6 ± 7.6 ± 1.1 ± 6.8
5–6
101.2 ± 4.2 ± 0.5 ± 7.2
68.4 ± 6.2 ± 0.6 ± 4.9
6–7
79.1 ± 3.7 ± 0.5 ± 5.6
58.5 ± 5.6 ± 0.5 ± 4.2
7–8
63.9 ± 3.3 ± 0.6 ± 4.5
41.2 ± 4.7 ± 0.5 ± 2.9
8–9
47.0 ± 2.8 ± 0.3 ± 3.3
30.5 ± 3.9 ± 0.6 ± 2.2
9–10
34.8 ± 2.4 ± 0.3 ± 2.5
16.5 ± 2.8 ± 0.2 ± 1.2
10–11
23.5 ± 2.0 ± 0.2 ± 1.7
13.4 ± 2.4 ± 0.2 ± 1.0
11–12
17.8 ± 1.7 ± 0.2 ± 1.3
12.1 ± 2.3 ± 0.2 ± 0.9
12–13
13.4 ± 1.4 ± 0.2 ± 1.0
6.6 ± 1.7 ± 0.1 ± 0.5
13–14
10.0 ± 1.2 ± 0.2 ± 0.7
3.4 ± 1.1 ± 0.1 ± 0.2
14–15
7.2 ± 1.0 ± 0.1 ± 0.5
0.7 ± 0.5 ± 0.0 ± 0.1
2
Table 7. Double-differential production cross-sections dpdTσdy × B 1S in pb/( GeV/c) for the Υ (1S)
meson in bins of transverse momentum and rapidity, assuming no polarisation. The first error is
statistical, the second is the component of the systematic uncertainty that is uncorrelated between
bins and the third is the correlated component.
– 20 –
JHEP06(2013)064
3–4
4–5
2.0 < y < 2.5
2.5 < y < 3.0
3.0 < y < 3.5
0–1
14.5 ± 1.8 ± 0.3 ± 1.0
15.2 ± 1.3 ± 0.7 ± 1.1
11.7 ± 1.1 ± 0.1 ± 0.8
1–2
33.2 ± 2.7 ± 1.3 ± 2.4
42.6 ± 2.1 ± 0.3 ± 3.1
39.0 ± 2.1 ± 0.2 ± 2.8
2–3
49.3 ± 3.3 ± 1.0 ± 3.5
54.3 ± 2.4 ± 1.0 ± 3.9
45.0 ± 2.2 ± 0.2 ± 3.2
3–4
56.8 ± 3.5 ± 0.6 ± 4.1
61.0 ± 2.6 ± 0.4 ± 4.4
48.2 ± 2.3 ± 0.2 ± 3.5
4–5
46.4 ± 3.1 ± 0.5 ± 3.3
45.1 ± 2.2 ± 0.5 ± 3.2
39.5 ± 2.1 ± 0.3 ± 2.8
5–6
51.1 ± 3.2 ± 0.8 ± 3.7
48.9 ± 2.3 ± 0.3 ± 3.5
38.1 ± 2.1 ± 0.6 ± 2.7
6–7
43.4 ± 2.9 ± 0.9 ± 3.1
34.9 ± 1.9 ± 0.6 ± 2.5
29.3 ± 1.8 ± 0.2 ± 2.1
7–8
28.6 ± 2.4 ± 0.6 ± 2.1
29.3 ± 1.8 ± 0.7 ± 2.1
25.5 ± 1.7 ± 0.3 ± 1.8
8–9
21.2 ± 2.0 ± 0.1 ± 1.5
23.7 ± 1.6 ± 0.2 ± 1.7
17.3 ± 1.4 ± 0.1 ± 1.2
9–10
20.9 ± 2.0 ± 0.2 ± 1.5
16.1 ± 1.3 ± 0.2 ± 1.2
13.2 ± 1.2 ± 0.1 ± 0.9
10–11
16.0 ± 1.7 ± 0.2 ± 1.1
13.4 ± 1.2 ± 0.2 ± 1.0
13.4 ± 1.2 ± 0.2 ± 1.0
11–12
14.9 ± 1.6 ± 0.2 ± 1.1
10.2 ± 1.0 ± 0.2 ± 0.7
10.1 ± 1.0 ± 0.1 ± 0.7
12–13
7.8 ± 1.2 ± 0.2 ± 0.6
10.4 ± 1.0 ± 0.2 ± 0.7
8.4 ± 1.0 ± 0.2 ± 0.6
13–14
5.6 ± 1.0 ± 0.2 ± 0.4
7.0 ± 0.8 ± 0.1 ± 0.5
5.4 ± 0.8 ± 0.1 ± 0.4
14–15
4.0 ± 0.8 ± 0.3 ± 0.3
5.8 ± 0.8 ± 0.1 ± 0.4
3.5 ± 0.6 ± 0.1 ± 0.3
3.5 < y < 4.0
4.0 < y < 4.5
0–1
11.2 ± 1.5 ± 0.1 ± 0.8
—
1–2
26.3 ± 2.2 ± 0.2 ± 1.9
—
2–3
35.0 ± 2.5 ± 0.3 ± 2.5
—
3–4
44.7 ± 2.9 ± 0.3 ± 3.2
—
4–5
40.6 ± 2.7 ± 0.2 ± 2.9
14.5 ± 2.9 ± 0.1 ± 1.0
5–6
28.4 ± 2.3 ± 0.1 ± 2.0
12.8 ± 2.8 ± 0.1 ± 0.9
6–7
19.8 ± 1.8 ± 0.1 ± 1.4
19.5 ± 3.2 ± 0.3 ± 1.4
7–8
20.1 ± 1.9 ± 0.1 ± 1.4
17.0 ± 3.0 ± 0.2 ± 1.2
8–9
14.8 ± 1.6 ± 0.3 ± 1.1
8.7 ± 2.1 ± 0.1 ± 0.6
9–10
8.7 ± 1.2 ± 0.1 ± 0.6
—
10–11
6.5 ± 1.1 ± 0.2 ± 0.5
—
11–12
7.0 ± 1.1 ± 0.1 ± 0.5
—
12–13
2.7 ± 0.7 ± 0.1 ± 0.2
—
13–14
4.3 ± 0.8 ± 0.1 ± 0.3
—
14–15
—
—
2
Table 8. Double-differential production cross-sections dpdTσdy × B 2S in pb/( GeV/c) for the Υ (2S)
meson in bins of transverse momentum and rapidity, assuming no polarisation. The first error is
statistical, the second is the component of the systematic uncertainty that is uncorrelated between
bins and the third is the correlated component. Regions where the number of events was not large
enough to perform a measurement are indicated with a dash.
– 21 –
JHEP06(2013)064
pT ( GeV/c)
2.0 < y < 2.5
2.5 < y < 3.0
3.0 < y < 3.5
0–1
4.8 ± 1.0 ± 0.1 ± 0.4
5.5 ± 0.8 ± 0.1 ± 0.4
4.7 ± 0.7 ± 0.1 ± 0.3
1–2
17.9 ± 2.0 ± 0.3 ± 1.3
18.2 ± 1.4 ± 0.2 ± 1.3
17.3 ± 1.4 ± 0.1 ± 1.3
2–3
25.5 ± 2.3 ± 0.4 ± 1.9
17.3 ± 1.3 ± 0.1 ± 1.3
21.3 ± 1.5 ± 0.1 ± 1.6
3–4
22.9 ± 2.2 ± 0.3 ± 1.7
26.2 ± 1.7 ± 0.2 ± 1.9
22.8 ± 1.6 ± 0.1 ± 1.7
4–5
23.6 ± 2.2 ± 0.3 ± 1.7
18.0 ± 1.4 ± 0.1 ± 1.3
19.9 ± 1.5 ± 0.1 ± 1.5
5–6
19.6 ± 2.0 ± 0.3 ± 1.4
21.8 ± 1.5 ± 0.2 ± 1.6
18.4 ± 1.4 ± 0.1 ± 1.4
6–7
21.4 ± 2.1 ± 0.4 ± 1.6
18.9 ± 1.4 ± 0.2 ± 1.4
19.8 ± 1.5 ± 0.2 ± 1.5
7–8
13.7 ± 1.6 ± 0.3 ± 1.0
16.1 ± 1.3 ± 0.2 ± 1.2
12.0 ± 1.2 ± 0.2 ± 0.9
8–9
14.2 ± 1.6 ± 0.6 ± 1.1
12.5 ± 1.1 ± 0.2 ± 0.9
9.3 ± 1.0 ± 0.1 ± 0.7
9–10
8.7 ± 1.3 ± 0.3 ± 0.6
10.4 ± 1.0 ± 0.2 ± 0.8
10.8 ± 1.1 ± 0.1 ± 0.8
10–11
9.6 ± 1.3 ± 0.5 ± 0.7
7.4 ± 0.9 ± 0.3 ± 0.5
6.8 ± 0.8 ± 0.1 ± 0.5
11–12
8.1 ± 1.2 ± 0.1 ± 0.6
5.9 ± 0.8 ± 0.2 ± 0.4
4.0 ± 0.7 ± 0.1 ± 0.3
12–13
6.3 ± 1.0 ± 0.1 ± 0.5
5.3 ± 0.7 ± 0.1 ± 0.4
3.0 ± 0.6 ± 0.0 ± 0.2
13–14
10.0 ± 1.3 ± 0.2 ± 0.7
4.6 ± 0.7 ± 0.2 ± 0.3
3.7 ± 0.6 ± 0.1 ± 0.3
14–15
4.0 ± 0.8 ± 0.1 ± 0.3
2.2 ± 0.5 ± 0.1 ± 0.2
3.5 ± 0.6 ± 0.1 ± 0.3
3.5 < y < 4.0
4.0 < y < 4.5
0–1
3.3 ± 0.8 ± 0.0 ± 0.2
—
1–2
19.1 ± 1.9 ± 0.2 ± 1.4
—
2–3
20.0 ± 1.9 ± 0.2 ± 1.5
—
3–4
18.6 ± 1.8 ± 0.1 ± 1.4
—
4–5
18.5 ± 1.8 ± 0.1 ± 1.4
6.3 ± 2.0 ± 0.1 ± 0.5
5–6
11.0 ± 1.4 ± 0.1 ± 0.8
5.3 ± 1.7 ± 0.1 ± 0.4
6–7
9.3 ± 1.3 ± 0.1 ± 0.7
1.0 ± 0.7 ± 0.0 ± 0.1
7–8
8.1 ± 1.2 ± 0.1 ± 0.6
7.3 ± 1.9 ± 0.1 ± 0.5
8–9
8.0 ± 1.2 ± 0.1 ± 0.6
3.0 ± 1.2 ± 0.0 ± 0.2
9–10
7.9 ± 1.1 ± 0.1 ± 0.6
—
10–11
3.6 ± 0.8 ± 0.0 ± 0.3
—
11–12
5.1 ± 0.9 ± 0.1 ± 0.4
—
12–13
4.5 ± 0.9 ± 0.1 ± 0.3
—
13–14
0.7 ± 0.3 ± 0.0 ± 0.1
—
14–15
—
—
2
Table 9. Double-differential production cross-sections dpdTσdy × B 3S in pb/( GeV/c) for the Υ (3S)
meson in bins of transverse momentum and rapidity, assuming no polarisation. The first error is
statistical, the second is the component of the systematic uncertainty that is uncorrelated between
bins and the third is the correlated component. Regions where the number of events was not large
enough to perform a measurement are indicated with a dash.
– 22 –
JHEP06(2013)064
pT ( GeV/c)
R2S/1S
R3S/1S
0–1
0.210 ± 0.013 ± 0.004 ± 0.006
0.075 ± 0.007 ± 0.001 ± 0.003
1–2
0.219 ± 0.008 ± 0.002 ± 0.006
0.109 ± 0.005 ± 0.001 ± 0.004
2–3
0.219 ± 0.007 ± 0.002 ± 0.006
0.096 ± 0.004 ± 0.001 ± 0.003
3–4
0.244 ± 0.008 ± 0.002 ± 0.007
0.107 ± 0.004 ± 0.001 ± 0.004
4–5
0.226 ± 0.008 ± 0.001 ± 0.006
0.104 ± 0.005 ± 0.001 ± 0.004
5–6
0.267 ± 0.009 ± 0.003 ± 0.007
0.116 ± 0.005 ± 0.001 ± 0.004
6–7
0.270 ± 0.011 ± 0.004 ± 0.008
0.151 ± 0.007 ± 0.001 ± 0.005
7–8
0.280 ± 0.012 ± 0.003 ± 0.008
0.137 ± 0.007 ± 0.001 ± 0.005
8–9
0.298 ± 0.015 ± 0.003 ± 0.008
0.170 ± 0.010 ± 0.002 ± 0.006
9–10
0.280 ± 0.016 ± 0.003 ± 0.008
0.190 ± 0.012 ± 0.002 ± 0.007
10–11
0.330 ± 0.021 ± 0.005 ± 0.009
0.181 ± 0.013 ± 0.004 ± 0.006
11–12
0.379 ± 0.027 ± 0.006 ± 0.011
0.203 ± 0.017 ± 0.003 ± 0.007
12–13
0.401 ± 0.032 ± 0.007 ± 0.011
0.235 ± 0.021 ± 0.003 ± 0.008
13–14
0.388 ± 0.036 ± 0.006 ± 0.011
0.292 ± 0.027 ± 0.004 ± 0.010
Table 10. Ratios of cross-sections Υ (2S) → µ+ µ− and Υ (3S) → µ+ µ− with respect to Υ (1S) →
µ+ µ− as a function of pT in the range 2.0 < y < 4.0, assuming no polarisation. The first error is
statistical, the second is the component of the systematic uncertainty that is uncorrelated between
bins and the third is the correlated component.
y
R2S/1S
R3S/1S
2.0–2.5
0.2545 ± 0.0068 ± 0.0021 ± 0.0071
0.1260 ± 0.0041 ± 0.0008 ± 0.0044
2.5–3.0
0.2653 ± 0.0050 ± 0.0014 ± 0.0075
0.1210 ± 0.0029 ± 0.0005 ± 0.0043
3.0–3.5
0.2476 ± 0.0051 ± 0.0009 ± 0.0070
0.1251 ± 0.0032 ± 0.0004 ± 0.0044
3.5–4.0
0.2558 ± 0.0075 ± 0.0011 ± 0.0072
0.1315 ± 0.0048 ± 0.0004 ± 0.0046
Table 11. Ratios of cross-sections Υ (2S) → µ+ µ− and Υ (3S) → µ+ µ− with respect to Υ (1S) →
µ+ µ− as a function of y in the range 2.0 < y < 4.0, assuming no polarisation. The first error is
statistical, the second is the component of the systematic uncertainty that is uncorrelated between
bins and the third is the correlated component.
– 23 –
JHEP06(2013)064
pT ( GeV/c)
Open Access. This article is distributed under the terms of the Creative Commons
Attribution License which permits any use, distribution and reproduction in any medium,
provided the original author(s) and source are credited.
References
[1] W. Caswell and G. Lepage, Effective lagrangians for bound state problems in QED, QCD and
other field theories, Phys. Lett. B 167 (1986) 437 [INSPIRE].
[3] V. Kartvelishvili, A. Likhoded and S. Slabospitsky, D meson and ψ meson production in
hadronic interactions, Sov. J. Nucl. Phys. 28 (1978) 678 [INSPIRE].
[4] R. Baier and R. Ruckl, Hadronic Production of J/ψ and Υ: transverse momentum
distributions, Phys. Lett. B 102 (1981) 364 [INSPIRE].
[5] CDF collaboration, F. Abe et al., Inclusive J/ψ, ψ(2S) and b quark production in p¯p
√
collisions at s = 1.8 TeV, Phys. Rev. Lett. 69 (1992) 3704 [INSPIRE].
[6] E. Braaten and S. Fleming, Color octet fragmentation and the psi-prime surplus at the
Tevatron, Phys. Rev. Lett. 74 (1995) 3327 [hep-ph/9411365] [INSPIRE].
[7] J.M. Campbell, F. Maltoni and F. Tramontano, QCD corrections to J/ψ and Υ production
at hadron colliders, Phys. Rev. Lett. 98 (2007) 252002 [hep-ph/0703113] [INSPIRE].
[8] B. Gong and J.-X. Wang, Next-to-leading-order QCD corrections to J/ψ polarization at
Tevatron and Large-Hadron-Collider energies, Phys. Rev. Lett. 100 (2008) 232001
[arXiv:0802.3727] [INSPIRE].
[9] P. Artoisenet, J.M. Campbell, J. Lansberg, F. Maltoni and F. Tramontano, Υ production at
Fermilab Tevatron and LHC energies, Phys. Rev. Lett. 101 (2008) 152001
[arXiv:0806.3282] [INSPIRE].
[10] J. Lansberg, On the mechanisms of heavy-quarkonium hadroproduction, Eur. Phys. J. C 61
(2009) 693 [arXiv:0811.4005] [INSPIRE].
[11] N. Brambilla et al., Heavy quarkonium: progress, puzzles and opportunities, Eur. Phys. J. C
71 (2011) 1534 [arXiv:1010.5827] [INSPIRE].
√
[12] LHCb collaboration, Measurement of J/ψ production in pp collisions at s = 7 TeV, Eur.
Phys. J. C 71 (2011) 1645 [arXiv:1103.0423] [INSPIRE].
√
[13] LHCb collaboration, Measurement of Υ production in pp collisions at s = 7 TeV, Eur.
Phys. J. C 72 (2012) 2025 [arXiv:1202.6579] [INSPIRE].
√
[14] LHCb collaboration, Measurement of J/ψ production in pp collisions at s = 2.76 TeV,
JHEP 02 (2013) 041 [arXiv:1212.1045] [INSPIRE].
[15] ALICE collaboration, Rapidity and transverse momentum dependence of inclusive J/ψ
√
production in pp collisions at s = 7 TeV, Phys. Lett. B 704 (2011) 442 [Erratum ibid. B
718 (2012) 692-698] [arXiv:1105.0380] [INSPIRE].
√
[16] ALICE collaboration, Inclusive J/ψ production in pp collisions at s = 2.76 TeV, Phys.
Lett. B 718 (2012) 295 [arXiv:1203.3641] [INSPIRE].
– 24 –
JHEP06(2013)064
[2] G.T. Bodwin, E. Braaten and G.P. Lepage, Rigorous QCD analysis of inclusive annihilation
and production of heavy quarkonium, Phys. Rev. D 51 (1995) 1125 [Erratum ibid. D 55
(1997) 5853] [hep-ph/9407339] [INSPIRE].