DSpace at VNU: Application of GIS and modelling in health risk assessment for urban road mobility
Bạn đang xem bản rút gọn của tài liệu. Xem và tải ngay bản đầy đủ của tài liệu tại đây (518.07 KB, 12 trang )
Environ Sci Pollut Res
DOI 10.1007/s11356-013-1492-5
RESEARCH ARTICLE
Application of GIS and modelling in health risk assessment
for urban road mobility
Van-Hieu Vu & Xuan-Quynh Le & Ngoc-Ho Pham &
Luc Hens
Received: 26 October 2012 / Accepted: 14 January 2013
# Springer-Verlag Berlin Heidelberg 2013
Abstract Transport is an essential sector in modern societies. It connects economic sectors and industries. Next to its
contribution to economic development and social interconnection, it also causes adverse impacts on the environment
and results in health hazards. Transport is a major source of
ground air pollution, especially in urban areas, and therefore
contributes to the health problems, such as cardiovascular
and respiratory diseases, cancer and physical injuries.
This paper presents the results of a health risk assessment that
quantifies the mortality and the diseases associated with particulate matter pollution resulting from urban road transport in
Haiphong City, Vietnam. The focus is on the integration of
modelling and geographic information system approaches in
the exposure analysis to increase the accuracy of the
assessment and to produce timely and consistent assessment
results. The modelling was done to estimate traffic conditions
and concentrations of particulate matters based on georeferenced data. The study shows that health burdens due to
particulate matter in Haiphong include 1,200 extra deaths for
the situation in 2007. This figure can double by 2020 as the
result of the fast economic development the city pursues. In
addition, 51,000 extra hospital admissions and more than
850,000 restricted activity days are expected by 2020.
Keywords Health impact assessment . GIS . Modelling .
Health outcomes . Air pollutants . PM10 . Urban road
transport . Haiphong . Vietnam
Introduction
Responsible editor: Philippe Garrigues
V.-H. Vu
Department of Human Ecology, Vrije Universiteit Brussel,
Laarbeeklaan 103,
1090 Brussels, Belgium
X.-Q. Le
Department of Geography, Vrije Universiteit Brussel, Pleinlaan 2,
1050 Brussels, Belgium
e-mail:
V.-H. Vu (*) : N.-H. Pham
Research Centre for Environmental Monitoring and Modelling,
Hanoi University of Science, Vietnam National University,
334 Nguyen Trai Street,
Hanoi, Vietnam
e-mail:
N.-H. Pham
e-mail:
L. Hens
Flemish Institute of Technological Research, 3400 Mol, Belgium
e-mail:
In modern societies, transportation is an essential link between all economic sectors and industries. It provides access
to markets, education, jobs, leisure and other services. With
modern societies relying more and more on transportation,
its impacts on the environment have become a pressing
issue through degrading environmental quality (air, water,
soil) and changing land use and climate (Black 2003;
Rodrigue et al. 2006). As a consequence, transportation also
poses dangers on human health, ranging from injuries, annoyance, to cardiovascular and respiratory diseases and
cancer. The effects are especially pronounce for vulnerable
groups such as children and elderly people, people with
prior cardiovascular and respiratory health problems and
vulnerable road users (pedestrians and cyclists) (Cirera et
al. 2001; Ballester 2005; Krzyzanowski et al. 2005;
Moshammer et al. 2005; Nicolopoulou-Stamati et al. 2005;
Roussou and Behrakis 2005; WHO 2000a, b, 2006).
Transport is a major source of ground air pollution,
especially in urban areas. In Northern Europe, transport
Environ Sci Pollut Res
contributes nearly 100 % of CO, 70 % of NOx and 40 % of
PM10 of the emission values (WHO 2000a). The trafficrelated fraction of PM10 amounts to 43 % in Austria, 56 %
in France and 53 % in Switzerland (Kunzli et al. 2000).
Motor vehicles are the largest source of PM10 emissions in
most Asian cities (Faiz and Sturm 2000). Studies in New
Delhi (India), Bangkok (Thailand), Beijing (China), Hong
Kong, Manila (Philippines) and Jakarta (Indonesia) show a
high contribution of vehicles to the concentrations of particulate matter, ranging from 40 to 80 % (Cheng et al. 2007;
Kan and Chen 2004; Sagar et al. 2007; Syahril et al. 2002;
Walsh 2002).
Studies on the health impacts of air pollution have been
carried out very early in Europe and the USA with more
epidemiological studies performed during the late 1980s and
the 1990s (Burnett et al. 1998; Katsouyanni et al. 1997;
Samet et al. 2000; Schwartz and Dockery 1992a, b; Xu et
al. 1994;). Amongst all air pollutants, particles, in particular
PM10, have been the subject of epidemiological studies and,
more recently, reviews of these studies. The studies, set
up in various parts of the world under different conditions, consistently showed that 24-h average concentrations of PM10 are related with daily mortality and daily
hospital admissions (Anderson et al. 2004; Dab et al. 2001;
Dockery et al. 1993; Fisher et al. 2007; Krewski et al.
2000; Pope et al. 1995; Zanobetti et al. 2002; WHO
2003). The conclusion is that the relationships between
traffic-related PM pollution and the effects on health are
both valid and causal.
Haiphong is a coastal city of the northern part of
Vietnam. The city hosts the country’s second largest port
which is located right at its heart. The port of Haiphong
accommodates shipping needs for the northern part of
Vietnam, the north of Laos and south-western provinces of
China. Not surprisingly, mobility in Haiphong is closely
related to the port’s activities. Haiphong witnessed a very
fast growth in mobility during the period 2002–2005.
However, transport brings also environmental and health
hazards. In Haiphong, it is estimated that road transport
accounts for an estimated 60 % of the total emitted volume
of nitrogen oxides and 50 % of carbon monoxides and 25 %
of particulates with diesel engines being the main emitters
(Hai Phong DOSTE 2003). The air quality in Haiphong
degraded continuously during the last 10 years. As the port
of Haiphong plans to increase its activities, the city prepared
in 2005 a Development Plan with an outlook to 2020, in
which large projects on transport infrastructure are foreseen
to meet the increasing demand that results from the current
and projected development. More transportation will lead to
more environmental and health impacts, such as the increase
of air pollution and noise and more injuries, mortality and
morbidity. This calls for a systematic analysis of the environmental and health aspects related with transport, so that
necessary measures can be taken to protect the environment
and human health.
This paper presents the results of a health risk assessment that quantifies the mortality and the morbidity associated with particulate matter of transport. Health impact
assessment (HIA) is used. This includes hazard identification, exposure analysis, dose–effect relationships and risk
assessment. Modelling and Geographic Information
System (GIS) approaches allow estimating exposure to
increase the accuracy of the procedure. This starts with
using a transport model to forecast mobility flows in
different parts of the city. The results of the transport
model are integrated in an emission model, which allows
calculating emissions at the road level. The next step is a
dispersion model where GIS tools are used to calculate
concentrations of air pollutants on a continuous range and
to display them on a concentration map. When overlaying
the concentration map with the population density map,
human exposure to pollution can be estimated. Finally,
health effects are calculated based on dose–response functions using the quantified exposures and relative risks
from the literature.
Materials and methods
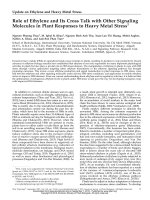
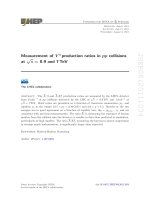
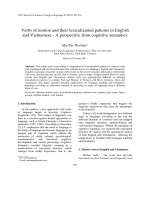
A model integrating three sub-models in a GIS framework
was applied to assess health effects of various traffic scenarios, related emission and pollution for the urban area in
Haiphong. As shown in Fig. 1, those three sub-models were
integrated to simulate each sub-process involved.
The study area comprises five urban districts (52 communes in total) of Haiphong City with a population of
598,000 people and an average density of 3,522 people/km2
in 2007. Ngo Quyen District is the densest area where more
than 66,000 people/km2 lived in the most populated commune. Hai An District is the sparsest one.
Traffic demand
and road network
Driving cycles and
fleet composition
Meteoclimatic
data
GEOGRAPHICAL INFORMATION SYSTEM
Traffic
model
Emission model
Dispersion
model
Traffic flows
mapping
Emissions
mapping
Concentrations
mapping
Fig. 1 General structure of the integrated model system
Environ Sci Pollut Res
Transport scenarios
To estimate the emission of pollutants that affect human
health, the VISUM traffic model, a computer-aided transport
planning programme, was applied to Haiphong. The model
allows to evaluate traffic loads on a road network, using
origin/destination (O/D) matrix (for four modes: bus, bicycle, motorcycle and car) and the description of the road
graph. For each mode, parameters on occupancy rate, analysis period, maximum speed and type (public or private)
were assigned. Hourly traffic fluxes are obtained from peak
results using empirical coefficients estimated for the whole
net. The model has significant data demands to define the
activity and transportation systems. The primary need is
data to define travel behaviour that is gathered via a household travel survey. The survey provides (a) household and
individual-level socio-economic data (typically including
income and the number of household members, workers
and cars); (b) activity/travel data (typically including for
each activity performed over a 24-h period activity type,
location, start time and duration, and if travel was involved,
mode, departure time and arrival time); and (c) household
vehicle data. Data from the survey are used to validate the
representativeness of the sample; to develop and estimate
trip generation, trip distribution and mode choice models;
and to conduct time-in-motion studies. In this study, 782
household questionnaires were collected, covering 0.31 %
of the total urban population. In addition, observed traffic
studies (counts and speeds) provide data needed for model
validation.
The model runs on geo-referenced data of the road network and the administrative data of 52 urban communes of
Haiphong. The former include road name, ID and types
(street, provincial road, national road) and is encoded into
links (a section of the road network between two nodes) and
nodes (determine the locations of street junctions). The latter
includes information on district ID, the perimeter, area,
population and density of each commune.
To estimate mobility development in the future, four
scenarios have been considered: a minimum, a basic (or
average) and two maximum scenarios (Ziliaskopoulos and
Mitsakis 2008). The basic scenario (scenario 2) builds on
the current traffic conditions of the city, the data that have
been collected from mobility questionnaires and the current
supply capabilities of the road network. The other three
scenarios are policy dependent. The maximum scenarios
are based on socio-economic growth rates as described in
the Master Plan of the city (Hai Phong PC 2006). The first
maximum scenario (scenario 3) predicts that the growth
rates assumed in the Master Plan of the Haiphong City are
achieved. This coincides with a 30 % growth of all means of
transport, while the capacity and the infrastructure of the
transportation network remain constant. This is because
most of the new infrastructures will be outside the centre,
such as new ring roads and bridges. Also, their details
(locations, technical specifications) are not provided in the
Master Plan to allow modelling future travel demand. The
second maximum scenario (scenario 4) is based on the same
assumptions as the first maximum scenario, with an additional shift of mode share (10 % increase in private cars and
a reduction of 5 % of motorcycles and bicycles). This
scenario is considered as realistic for Haiphong in 2020.
For the minimum scenario (scenario 1), a 30 % reduction
of the existing traffic was assumed. In total, 16 origin/destination matrices have been computed.
Finally, the model was validated by comparing the modelling results for the basic scenario and the actual traffic
count at 20 locations in Haiphong (14 within the study area
and six outside). At each location, traffic filming was done
three times a day (morning, afternoon and night), each film
segment lasts 20 min. Traffic was then reviewed through the
film segments to count the number of vehicles for each of
the four vehicular groups studied. The following table
(Table 1) presents the differences of the model outputs for the
base case scenario (scenario 2) and the actual observed traffic
counts for the 14 locations within the modelling area in the city
of Haiphong. The comparison shows that the model produces
reliable results, which correspond well with the traffic count
data within a 6 % difference.
Emission and dispersion of pollutants
The results of the transport model were exported into a GIS
database and were used as inputs for the emissions model.
Table 1 Comparison of modelled results with traffic count data
Measuring
station ID
Counted
(average total
vehicles per
20 min)
Model output
(average total
vehicles per
20 min)
Difference
Difference
(%)
1
3
4
5
588
584
151
1,493
553
601
160
1,430
35
−17
−9
63
6.3
−2.8
−5.6
4.4
9
10
11
12
13
14
17
18
19
20
385
147
2,072
662
337
409
1,457
1,445
618
1,479
393
151
2,009
669
351
422
1,515
1,469
631
1,426
−8
−4
63
−7
−14
−13
−58
−24
−13
53
−2.0
−2.6
3.1
−1.0
−4.0
−3.1
−3.8
−1.6
−2.1
3.7
Environ Sci Pollut Res
For each scenario, the numbers of different types of vehicles
(except bicycles) per link in the entire Haiphong urban road
network were included. An emissions model has been developed on the basis of the results shown by Borrego et al. (2003).
The formula used to determine the emissions per link is
X
E¼
Vi LEf
i
where E is the total emissions per link (in gram per second), i is
the vehicle type, Vi is the volume per second of vehicle type i
along the link; L is the length of the link (in kilometre), Ef is an
emission factor of vehicle type i (in gram per kilometre).
Emission factors (Ef) for free-flowing conditions (in gram
per kilometre) were obtained from NEERI (2000) based on
the fact that NEERI’s study was based on the Indian vehicle
fleets which are similar to the ones in Haiphong in terms of
vehicle compositions, engine types and ages. For free-flowing
conditions, Ef of PM10 in gram per kilometre for cars and taxis
was 0.27; 3.0 for trucks, buses and diesel vehicles; and 0.21
for the two-wheelers.
Aggregated emissions were calculated on a 200-m × 200-m
grid cell as volumes sources so that the data can be imported to
the dispersion model later. To calculate the emissions, the
road-grid coverage was established by overlaying the link
database with the grid cell (200 m × 200 m) coverage. The
road-grid coverage is a map of the road network where each
road link has been broken up in line segments based on the
grid cells the links run through. Emissions along each line
segment were calculated. Emissions in each cell were summed
up over the roads and assigned as volume emissions to the cell
itself. As a result, the emissions of the road network were split
over a regular grid of 200-m × 200-m volume sources.
A dispersion model was used to estimate the distribution
of air pollutants. The ISC3ST was used. It is the third
version of the Industrial Source Complex Short-Term
Model, called ISC3ST. The basis of the ISC3ST model is
the straight-line, steady-state Gaussian plume equation. The
ISC3ST is a multi-source dispersion model for point area,
volume and open pit sources. The volume sources, as an
output of the emissions model, were transferred to ISC3ST
and can then be modelled and presented as line sources (US
EPA 1995).
The ISC3ST was selected because it has been widely used
and validated in studies on traffic air pollution in urban areas
and EIAs for transport projects in Vietnam (Hoang 2008).
Other available line sources models such as CALINE3,
CALINE4 and HYROAD are limited to a maximum of 20
links for each single run; therefore, they are not applicable for
a complicated road network like Haiphong with more than
1,700 links. Moreover, ISC3ST’s data requirements fit with
the data availability in Haiphong. The ISC3ST uses daily data
for traffic data (vehicle volume, types and density of traffic)
and meteorological data (wind direction, velocity and mixing
height). Meteorological data for 2003 were collected using a
fix automated rooftop station at the Institute of Marine
Environment and Resources in Haiphong.
Estimation of health effects
The impacts of air pollutants on public health were estimated using a health risk assessment, which entails four steps:
hazard identification, dose–response assessment, exposure
assessment and risk quantification.
Hazard identification was based on a literature review.
Particulate matter was selected as the indicator pollutant in
this assessment, as suggested by Kunzli et al. (1999).
Health impacts related to transport are reviewed to establish links between health outcomes and transport activities. Finally, total premature mortality (excluding accidents
and violent deaths), cardiac hospital admissions due to
PM10, hospital admissions due to respiratory diseases
due to PM10 and number of restricted activity days due
to PM2.5 were selected.
Dose–response functions were based on epidemiological
dose–response functions established by studies on health
impact of PM10 and PM2.5 on mortality and morbidity.
The formula (Kunzli et al. 1999) to calculate the mortality
resulting from long-term exposure to PM10 is:
Po ¼ Pe=ð1 þ ððRR À 1ÞðEPM À BPM Þ = 10ÞÞ
where Po is the baseline mortality per 1,000 in the age group
30+, after deducting the air pollution effect (this will depend
on the other variables), Pe is the crude mortality rate per
1,000 in the age group 30+ (in this study, Pe is calculated
based on the Vietnamese demographic data published by
GSO (2007)), EPM is the PM10 exposure level in the area of
interest (in this study, data are from the model as described
above), BPM is the threshold PM10 exposure level for
mortality effect (in this study, we assumed the threshold
for PM10 at 7.5 (in microgram per cubic metre), as proposed by Fisher et al. (2007)), and RR is the epidemiologically derived relative risk for a 10-μg/m3 increment
of PM10, assuming a linear dose–response relationship
above the threshold (B) for the age group 30+ (for this
study, RR as suggested by Kunzli et al. (2000) was
used (4.3 %) with 95 % confidence level which ranges from
1.026 to 1.061).
The increased mortality is calculated using the following
formula: DPM = Po × (RR − 1) where DPM is the number of
additional deaths per 1,000 people in the age group 30+
(P30+) for an increase of 10 μg/m3. The age pyramid for
Vietnam is used to calculate the percentage of this group in
the population in Haiphong. The number of deaths due to
PM10 is calculated by the following formula:
NPM ¼ DPM Â P30þ Â ððEPM À BPM Þ = 10Þ:
Environ Sci Pollut Res
As for short-term exposure to pollution, two main morbidity effects of PM10 were considered: chronic obstructive
pulmonary diseases (COPDs) and respiratory admissions to
hospital (Fisher et al. 2007). The annual increase in the
admission rate for COPD is 21.4 % per 10 μg/m3 of PM10
(Dockery and Pope 1994). COPDs as proposed by Fisher
et al. (2002) include bronchitis (J20), chronic bronchitis
(J21), emphysema (J43), bronchiectasis (J47), extrinsic
allergic alveolitis (J67) and chronic airways obstruction
(J44) (codes from WHO 2007). In 2006, the incidence
rate in Haiphong is 28.1 per 1,000 people of all ages. To
calculate the morbidity related to PM10, the overall rate in
Haiphong will be applied.
Respiratory admissions to hospitals are calculated based
on the rates adopted by WHO (2005) for respiratory hospital
admissions for all ages (1 %) and cardiovascular hospital
admissions for all ages (1.3 %) for a 10-μg/m3 annual
increase in PM10. The increased rates are applied to annual
hospital admissions, based on the data obtained from the
Haiphong Department of Health (2006, 2007) to estimate
extra hospital admissions in 2020. The annual increase of
PM10 was based on the air quality monitoring data during
the period 2005–2007.
For PM2.5, the morbidity effect is calculated as the number of restricted activity days (Fisher et al. 2002). This
parameter is an important measure of functional wellbeing. The definition of “restricted activity days” is the
average annual number of days a person experienced at least
one of the following: (1) a bed day, during which a person
stayed in bed more than half a day because of illness or
injury related to traffic; (2) a work-loss day, on which a
currently employed person missed more than half a day
from a job or business; (3) a school-loss day, on which a
student 5–17 years of age missed more than half a day
from the school in which he or she was currently enrolled; or (4) a cut-down day, on which a person cuts
down for more than half a day on things he usually
does. The dose–response relationship used is 9.1 cases
per 100 persons per 1-μg/m3 annual increase of PM2.5.
As data on PM2.5 are not readily available for Haiphong,
a fraction of 0.7 of PM10 was used to estimate this
exposure (Medina et al. 2005).
Exposure assessment aims to quantify the number of
people exposed to PM10 and PM2.5. The exposed population was calculated using a GIS-based approach that
includes data on area and population density of the 52
communes and modelled PM10 concentrations from dispersion model. PM2.5 concentrations were calculated based on
PM10 concentrations.
Exposed population for PM10 was calculated for the P30+
group by overlaying concentration map on population density map. The number of people exposed to each level of
concentration was calculated.
Results
Exposure assessment
To assess exposure, the concentrations of PM10 were
modelled for the four transport scenarios, each for two
worst cases: maximum value for 24 h and maximum
value for 1 year. This was based on the results of the
transport model, which calculated the number of
vehicles on the Haiphong roads for each of the four
modes of transport (bicycle, car, motorcycle and truck)
and for each of the four scenarios. The concentrations
were mapped using GIS. The concentration maps were
then overlaid with the city maps, which contain data on
the boundaries of districts and their population density.
The maps in Fig. 2 present the concentrations of PM10
by the steps. On the right are concentration maps for
the max 24-h mean, with the interval of 10 μg/m3. On
the left are concentration maps for the max annual mean
with the interval of 3 μg/m3. The maps also depict
traffic volume of each street in each scenario. The
streets are categorised in eight groups with different
traffic intensity. The maps show that the max 24h mean level of pollution is very high, with most of
the centre of Haiphong having a high concentration of
PM10. In the current situation (scenario 2), most parts of
the centre of Haiphong have PM10 concentrations in the
range of 50 to 60 μg/m3. The maximum annual mean of
20–23 μg/m3 is less polluting (scenario 2).
In calculating exposure, only the population group over
30 years old was taken into account using the methodology
described under “Exposure assessment”. This approach
considers only average density of a commune and does
not consider real-time location of people. In addition,
the calculation of exposure is only for those exposed to
concentrations higher above 7.5 μg/m3. Most of the
population in Haiphong is exposed to the PM10 concentration ranging between 15 and 30 μg/m3 (Table 2).
The shift from bicycles and motorbike to private
cars produces little difference in terms of contribution
to PM concentration between scenarios 3 and 4. The
changes will occur with more emissions at higher
concentration between 20 and 25 μg/m3 when there
is a shift from motorbikes to private cars. Therefore,
more people will be exposed to the concentrations of
PM10 between 15 and 20 μg/m3 in scenario 3 while
more people will be exposed to the concentrations of
PM10 between 20 and 25 μg/m3 in scenario 4. Based
on the exposure maps, mean concentrations of PM10
were calculated for each of the 52 communes in
Haiphong City (Table 3). Le Chan District has the
highest number of communes with a high concentration of PM10.
Environ Sci Pollut Res
Fig. 2 Modelled mean daily
and annual concentration of
PM10 for all scenarios
Environ Sci Pollut Res
Table 2 Number of
people over 30 years
exposed to mean annual
concentrations of PM10
Level of exposure (μg/m3)
Scenario
Scenario
Scenario
Scenario
1
2
3
4
≤7.5
7.5–10.0
10.0–15.0
15.0–20.0
20.0–25.0
25.0–30.0
30.0–35.0
35.0–40.0
≥40.0
273,718
125,615
72,073
72,073
136,054
144,431
49,122
49,122
172,058
155,493
148,852
148,852
112,961
146,804
139,726
134,742
–
91,994
74,195
79,179
–
30,454
97,863
97,863
–
–
82,506
82,506
–
–
30,454
30,454
–
–
–
–
Estimation of health effects
Mortality due to PM10
At the threshold of PM10 of 7.5 μg/m3, the estimated number of people in downtown Haiphong who died in 2007 as a
result of traffic-related PM10 totals 1,288 persons. By reducing the vehicle volume by 30 %, a drastic change in health
impact might be expected, with only 56 extra deaths due to
PM10 pollution. An increase of 30 % in the vehicle volume
will double the number of extra deaths. The absolute mortality per urban commune is summarised in Table 4. Le
Chan is the most affected district due to its high density of
busy roads. Hai An is the least affected, mostly because of
its least populated situation.
Morbidity due to PM10: increased admissions to hospital
for COPD
COPD refers to all diseases involving persistent airway
obstruction such as emphysema and chronic bronchitis.
Air pollution can cause COPD and increase the admissions
to the hospitals due to this disease. It is estimated that, by
2020, traffic in Haiphong will increase by 30 % in comparison with the 2007 figures. The concentration of PM10 for
2020 is 24.44 μg/m3, showing an increase of 6.77 μg/m3 as
compared to the level of 2007.
The number of extra hospital admissions was calculated
using the admissions to hospital in 2006 as the baseline
scenario. In 2006, there were 44,954 COPD admissions
(such as bronchiectasis, acute bronchitis and bronchiolitis
and chronic lower respiratory diseases (emphysema, chronic
asthmatic bronchitis (obstructive), chronic airway obstructions and other diseases)). It is estimated that more than
6,500 extra COPD admissions to the hospital will occur in
2020 that are attributable to the increase of PM10 due to the
increase in traffic.
Morbidity due to PM2.5: number of restricted activity days
The morbidity effect of particulate matter has been calculated for PM2.5 exposure as the number of days that normal
activity will be restricted due to pollution. Restricted activity
days were calculated based on the concentration of PM2.5
annual average. It is estimated that for each additional
microgram of PM2.5 in the atmosphere, there will be an
additional 9.1 restricted activity days per 100 people per
year. The annual average concentration of PM2.5 was calculated based on the annual average concentration of PM10
and assuming a fraction of 0.7 as PM2.5 as suggested by the
APHEIS project (Medina et al. 2005). The results are shown
that, in Haiphong, a total of 858,175 restricted activity days
were estimated for 2007. Le Chan is the most impacted
district, with a total of nearly 350,000 restricted activity
days per year, contributing to two-fifths of the total restricted activity days calculated for the Haiphong urban area.
Uncertainty
Uncertainty in forecasting using a model can be attributed to
two basic sources: input uncertainty and model uncertainty
(Rasouli and Timmermans 2012). Input uncertainty comes
from errors in input data. The VISUM model uses data from
household survey to produce the O/D matrices where errors
can occur in survey design (such as creating bias between
response and non-response groups) or survey data interpretation and coding. The literature suggests that a 5 % population surveyed is sufficient for travel demand household
survey (Ziliaskopoulos and Mitsakis 2008), but this study
was undertaken based on 0.31 % coverage of the total
population. However, the validation of the model against
observed traffic data shows that the model produces a good
result in estimating traffic at any given point, with a maximum of 6 % differences.
Another source of uncertainty in this study is the temporal variability in travel times, of congestion or the availability of seats has not been taken into account. This is
propagated clearly in emission and dispersion models,
where the models mostly produce a concentration lower
than the observed level of PM10. Observations at major
street junctions show that PM10 concentration is much
higher than modelled, showing that the air quality model
mostly underestimates concentration of PM10 (Table 5).
However, the difference can also be attributed to the possible contribution of other sources to the measurement, as the
model estimates only the contribution of vehicular sources.
Environ Sci Pollut Res
Table 3 Modelled population-weighted mean concentration of PM10 per urban commune for all scenarios
Urban
district
Hai An
District
Hong Bang
District
Kien An
District
Le Chan
District
Ngo Quyen
District
Legends
Urban commune
Cat Bi
Dang Hai
Dang Lam
Dong Hai
Nam Hai
Trang Cat
Ha Ly
Hoang Van Thu
Hung Vuong
Minh Khai
Pham Hong Thai
Phan Boi Chau
Quan Toan
Quang Trung
So Dau
Thuong Ly
Trai Chuoi
Bac Son
Dong Hoa
Nam Son
Ngoc Son
Phu Lien
Quan Tru
Tran Thanh Ngo
Trang Minh
Van Dau
An Bien
An Duong
Cat Dai
Dong Hai
Du Hang
Du Hang Kenh
Ho Nam
Lam Son
Nghia Xa
Niem Nghia
Trai Cau
Tran Nguyen Han
Vinh Niem
Cau Dat
Cau Tre
Dang Giang
Dong Khe
Dong Quoc Binh
Gia Vien
Lac Vien
Lach Tray
Le Loi
Luong Khanh Thien
May Chai
May To
Van My
Mean concentration (µg/m3) (population weighted)
Scenario 1
Scenario 2
Scenario 3
Scenario 4
5,24
7,59
10,61
10,65
4,15
6,01
8,40
8,43
4,56
6,60
9,24
9,27
1,37
1,99
2,78
2,79
1,68
2,44
3,41
3,42
1,25
1,81
2,53
2,54
13,02
18,87
26,39
26,48
12,22
17,71
24,78
24,86
3,80
5,51
7,71
7,74
9,99
14,48
20,25
20,32
18,25
26,46
36,99
37,12
18,07
26,20
36,63
36,76
1,71
2,48
3,47
3,48
13,15
19,06
26,66
26,75
5,56
8,05
11,26
11,30
9,57
13,87
19,39
19,46
12,75
18,48
25,85
25,94
10,42
15,11
21,13
21,20
12,26
17,76
24,84
24,93
7,77
11,26
15,75
15,80
4,74
6,87
9,61
9,64
3,54
5,14
7,18
7,21
13,59
19,69
27,54
27,63
7,85
11,37
15,91
15,96
3,32
4,81
6,72
6,75
4,69
6,80
9,51
9,54
16,00
23,18
32,43
32,54
15,40
22,31
31,21
31,31
16,84
24,41
34,13
34,25
11,89
17,24
24,10
24,19
14,88
21,57
30,17
30,27
11,91
17,25
24,13
24,21
10,44
15,13
21,16
21,23
14,33
20,77
29,05
29,15
15,75
22,83
31,93
32,04
15,54
22,51
31,50
31,60
13,61
19,72
27,58
27,68
16,63
24,09
33,70
33,81
9,70
14,06
19,66
19,73
8,93
12,94
18,11
18,17
6,13
8,88
12,43
12,47
8,22
11,91
16,66
16,72
7,36
10,66
14,91
14,96
10,80
15,66
21,89
21,97
9,12
13,22
18,49
18,55
7,29
10,57
14,78
14,83
11,24
16,30
22,79
22,87
10,61
15,37
21,50
21,57
11,88
17,22
24,08
24,17
3,42
4,96
6,94
6,96
8,04
11,65
16,30
16,35
4,07
5,90
8,25
8,28
Below 7,5 µg/m3
7,5-15 µg/m3
15-30 µg/m3
Above 30 µg/m3
Discussion
The city of Haiphong is growing fast as a result of urbanisation and industrialisation. This process is expected to continue
during the next decades. The Adjusted Master Plan of Socio-
Economic Development for Haiphong until 2020 planned an
overall development of 14 % annual economic growth. Most
of the development will happen in the industrial–construction
sector, followed by the service sector. Both sectors will generate more traffic in both urban areas and the outer rings. The
Environ Sci Pollut Res
Table 4 Number of mortality in
the group +30 due to PM10
District
Number of mortality in the group +30
Hai An
Hong Bang
Kien An
Le Chan
Ngo Quyen
Hai Phong—urban
Scenario 1
Scenario 2
Scenario 3
Scenario 4
8 (7.9–8.1)
8 (7.9–8.1)
13 (12.8–13.2)
21 (20.7–21.4)
7 (6.6–7.1)
57 (56–58)
13
219
126
633
296
1,287
93
431
305
1.05
864
2,741
93
432
305
1.05
865
2,743
aims of the development policy will therefore lead to changes
in transportation scenarios. This study offers data to take
traffic-related environmental health considerations into account in development policy. Overall, with extra deaths and
an increased morbidity, the health burden is very high and can
only be prevented by limiting the emissions.
“Road toll” is a concept used to describe the cost of using
surface transport modes (or the roads), which is counted not
in monetary term but by the number of road traffic casualties
(Fisher et al. 2002; Kunzli et al. 2000). The “traffic air
pollution road toll” in several European countries was much
higher than the “traffic accident road toll”. This is called the
accident/pollution ratio in the total road toll (Kunzli et al.
2000). This ratio for Haiphong was 1:6.0, higher than that of
France (1:3.3), Austria (1:4.1), Switzerland (1:4.8) and New
Zealand (1:1.4) (Kunzli et al. 2000; Fisher et al. 2002).
This study used approaches comparable with those used
in other studies in assessing environmental health impacts of
traffic-related PM10 and PM2.5, such as the approach used in
Table 5 Comparison of modelled and observed concentration
of PM10
(12.8–13.2)
(215–222)
(124–128)
(622–644)
(291–301)
(1,266–1,309)
(91.5–94.6)
(424–438)
(300–310)
(1.03–1.07)
(850–879)
(2,696–2,788)
(91.5–94.6)
(425–440)
(300–310)
(1.03–1.07)
(851–880)
(2,698–2,790)
the APHEIS HIA focusing on PM in 26 European cities
(Medina et al. 2005) and the HIA for transportation in New
Zealand performed by Fisher et al. (2002, 2007). The results
show that the assessment of health effects remains challenging, mostly due to a number of uncertainties in different
parts of the assessment process. The assessment of health
risk in this study is conservative for several reasons. First,
the use of PM as the indicator for air pollution has left out
the health effects of other pollutants, such as NOx, SOx, O3
and benzene, which have various independent health effects
(Katsouyanni 2003; Pope et al. 2002; Roussou et al. 2005;
Sunyer et al. 1997). In addition, health effects for people
younger than 30 years are not considered, while this group
includes children, one of the sensitive groups for lung diseases (Ballester 2005; Krzyzanowski et al. 2005;
Moshammer et al. 2005; Nicolopoulou-Stamati et al. 2005;
Roussou and Behrakis 2005; WHO 2006).
Next, the study uses 52 administrative communes of the
five urban districts of Haiphong as the basic assessment
Junction
Modelled concentration
(annual mean)
Observed concentration
(annual mean)
Difference
Difference (%)
A1
A2
A3
A5
A7
A8
21.26
24.65
27.23
16.09
30.96
29.84
43.46
64.20
77.04
49.56
65.19
48.39
−22.20
−39.54
−49.81
−33.47
−34.22
−18.55
−51.07
−61.60
−64.66
−67.53
−52.50
−38.33
A9
A10
A11
A12
A13
A14
A15
A16
A17
A19
36.90
35.72
19.62
34.45
24.71
15.24
24.03
36.45
19.90
8.13
68.15
70.12
53.33
52.35
48.39
80.99
26.95
37.53
44.73
33.58
−31.25
−34.40
−33.71
−17.90
−23.69
−65.75
−2.93
−1.08
−24.83
−25.45
−45.86
−49.06
−63.21
−34.19
−48.95
−81.19
−10.86
−2.88
−55.52
−75.80
Environ Sci Pollut Res
units and assumes that the population density is homogeneous in each commune. In reality, in Haiphong City, population density is much higher in some neighbourhoods of
the city, especially along the main roads. In addition, it is
clear that the distribution of particles is not homogeneous
but is affected by traffic intensities, and therefore, the proximity to major roads increases health risks (Hoek et al.
2002). In reality, each person is exposed differently to air
pollution, depending on one’s activities over space and time
(Ballester 2005; Chiodo and Rolfe, 2000; Fisher et al. 2002;
Kunzli et al. 2000; Le Tertre et al. 2002; Medina et al. 2005).
However, in this study, this variability could not be taken
into account.
Also, the dispersion model did not take into account the
high concentration of pollution on and along the roads.
Areas further from main roads, which are partially protected
by housing rows, often experience lower concentrations of
air pollutants. Therefore, models generalise certain aspects
of reality. However, the use of models is necessary as the
alternative is to base estimations on extensive and expensive
personal exposure monitoring for hard-to-define representative groups of environmentally exposed residents (Jerrett
and Finkelstein 2005). Moreover, models allow annual or
biannual assessments to monitor the environmental impacts
of development as well as the application in strategic environmental assessment.
Finally, due to the lack of details in the Master Plan,
future scenarios are calculated based only on the total increase in traffic, without knowing the exact distribution of
traffic over the network and over time. On the one hand, this
leads to possible overestimation of health burdens as new or
better roads can help disperse traffic to less populated areas,
hence reduce air pollution. On the other hand, better peripheral roads can provide better access to city centre; hence,
more traffic will be observed. Therefore, it is recommended
that a strategic assessment using the approach in this study
must be carried out for the whole network once details on
the new infrastructures become available.
To increase the accuracy of this approach, the model can
be refined at different levels:
&
&
In the current model, the zoning system for transportation
planning is identical to the administrative zoning system.
Therefore, patterns of estimated origin/destination pairs
for all transport modes depend on an administrative
system, which varies from the actual mobility patterns that
might result if a complete transport zoning system would
be (designed and) applied. A systematic O/D study could
improve the model results.
The use of a microscopic model, which would incorporate the mobility patterns of motorcycles, will result in a
better accuracy.
&
&
&
&
&
Traffic flows that occur due to freight movement, primarily in the zone of the Haiphong harbour, have not
been incorporated to the model due to the lack of such
information.
Public transit should be better incorporated in the model.
Currently, only bus network is included but the role of
railway and its contribution to the traffic patterns are not
incorporated due to the lack of data. Also, for estimating
future scenarios, public transits using tram/urban trains
should be incorporated as to assess the viability of using
public transport to reduce traffic, emission and health
burdens.
Temporal variations of traffic patterns should be explicitly modelled, which were not considered in the current
model.
As many monitoring sites may not be truly representative of the areas being considered, in the analysis, all
data were used, assuming a general degree of representativeness. Better air quality monitoring due to transportation will contribute to a greater accuracy of the
approach. The maps of pollution concentration can help
identify location for monitoring.
Uncertainty and sensitivity analysis should be conducted
systematically to find the most suitable models for local
situation.
Conclusion
Haiphong is a harbour and coastal city, in the eastern part of
Northern Vietnam. It witnessed a very fast mobility growth
during the period 2002–2005. The city offers a multi-modal
transport system, which includes airborne, waterborne, road
and rail transport. This transport model is closely linked to
its economic development. The results of a health risk
assessment quantify the mortality and the diseases associated with particulate matter pollution resulting from transport,
with the focus on the integration of modelling and GIS
approaches in the exposure analysis to increase the accuracy
of the assessment and to produce timely and consistent
assessment results so that they can support the decisionmaking process on urban planning and contribute to a more
sustainable mobility in the Haiphong urban area.
The use of models and GIS in a health risk assessment,
from the governance point of view, can reduce the waiting
time for results, in comparison to the in-depth personal
exposure study with better accuracy than using purely monitoring data and health statistics. The use of models and GIS
allows to understand the links between air quality and health
outcomes visually and is therefore useful in the decisionmaking process on urban planning and development of the
Haiphong urban area.
Environ Sci Pollut Res
A number of improvements can be made to further advance the integration, such as a better data integration
programme that will facilitate the application of integrated
model in policy making. Data on mobility survey, environmental monitoring and measuring must be standardised and
regularised. Various traffic models, as well as emission and
dispersion models, should be tested, and better understanding of their uncertainty and sensitivity should be studied.
Other health effects of transport can also be incorporated in
the integrated model to produce more information for planners, policy makers and other stakeholders.
In summary, despite the uncertainties, the study highlights the need to consider air pollution attributed health
effects in development policy. Integrated approaches should
be considered when preparing development plans and a
strategy to build a systematic assessment framework by
further development of different modules of the models to
obtain better estimation accuracy.
Acknowledgments The authors wish to thank the colleagues at the
Institute for Marine Environment and Resources, Haiphong, Vietnam
for their help with the data collection. This research was performed in
partial fulfilment of the Ph.D. research on “Integrating Environmental
Modelling and Geographic Information System in Environmental
Health Impact Assessment of Transport and Mobility Development in
Haiphong, Vietnam”, funded by the Flemish Interuniversity Council
(VLIR), Belgium, and as part of the project “Integrated Mobility
Planning for Haiphong City, Vietnam”, co-financed by the European
Commission’s Asia Pro Eco II programme.
References
Anderson HR, Atkinson RW, Peacock JL, Marston L, Konstantinou K
(2004) Meta-analysis of time-series studies and panel studies of
particulate matter (PM) and ozone (O3). Report of a WHO task
group. World Health Organization, London
Ballester F (2005) Air pollution and health: an overview with some
case studies. In: Nicolopoulou-Stamati P, Hens L, Howard CV
(eds) Environmental health impacts of transport and mobility.
Springer, Dordrecht, pp 53–79
Black WR (2003) Transportation: a geographical analysis. Guilford,
New York
Borrego C, Tchepel O, Costa AM, Amorim JH, Miranda AI (2003)
Emission and dispersion modelling of Lisbon air quality at local
scale. Atmos Environ 37(37):5197–5205
Burnett RT, Cakmak S, Raizenne ME, Stieb D, Vincent R, Krewski D,
Brook JR, Philips O, Ozkaynak H (1998) The associations between ambient carbon monoxide levels and daily mortality in
Toronto, Canada. J Air Waste Manag Assoc 48(8):689–700
Cheng S, Chen D, Li J, Wang H, Guo X (2007) The assessment of
emission-source contributions to air quality by using a coupled
MM5-ARPS-CMAQ modeling system: a case study in the
Beijing metropolitan region, China. Environ Model Softw 22
(11):1601–1616
Chiodo J, Rolfe K (2000) Health effects of eleven hazardous air
contaminants and recommended evaluation criteria. Ministry for
the Environment Publication No14. Ministry for the Environment
Publication, Wellington
Cirera E, Plasència A, Ferrando J, Seguí-Gómez M (2001) Factors
associated with severity and hospital admission of motor-vehicle
injury cases in as southern European urban area. Eur J Epidemiol
17(3):201–208
Dab W, Segala C, Dor F, Festy B, Lameloise P (2001) Air pollution
and health: correlation or causality? The case of the relationship
between exposure to particles and cardiopulmonary mortality. J
Air Waste Manag Assoc 51:220–235
Dockery DW, Pope CA (1994) Acute respiratory effects of particulate
air pollution. Annu Rev Public Health 15:107–132
Dockery DW, Pope CA III, Xu X, Spengler JD, Ware JH (1993) An
association between air pollution and mortality in six US cities. N
Engl J Med 329(24):1753–1759
Faiz A, Sturm PJ (2000) New directions: air pollution and road traffic
in developing countries. Atmos Environ 34:4745–4746
Fisher GW, Rolfe KA, Kjellstrom T, Woodward A, Hales S,
Sturman AP, Kingham S, Petersen J, Shrestha R, King D
(2002) Health effects due to motor vehicle air pollution in
New Zealand. Report to the Ministry of Transport New
Zealand
Fisher G, Kjellstrom T, Kingham S, Hales S, Shrestha R (2007) Health
and air pollution in New Zealand main report. Health Research
Council of New Zealand, Ministry for the Environment and
Ministry of Transport, Wellington
Hai Phong Department of Health (Hai Phong DoH) (2006) Health
Statistics of Hai Phong 2005. DoH, Hai Phong
Hai Phong Department of Health (Hai Phong DoH) (2007) Health
Statistics of Hai Phong 2006. DoH, Hai Phong
Hai Phong Department of Science, Technology and Environment (Hai
Phong DOSTE) (2003) State of the Environment 2003 Report.
DOSTE, Hai Phong
Hai Phong People Committee (PC) (2006) Executive report: review
and adjustment to the Socio-Economic Development Master Plan
for Hai Phong until 2020. Hai Phong, Vietnam
Hoang XC (2008) Improving air quality in Vietnam. SIDA & AIT,
Thailand
Hoek G, Brunekreef B, Goldbohm S, Fischer P, van den Brandt PA
(2002) Association between mortality and indicators of trafficrelated air pollution in the Netherlands: a cohort study. The Lancet
360(9341):1203–1209
Jerrett M, Finkelstein M (2005) Geographies of risk in studies linking
chronic air pollution exposure to health outcomes. J Toxicol
Environ Health 68(13–14):1207–1242
Kan H, Chen B (2004) Particulate air pollution in urban areas of
Shanghai, China: health-based economic assessment. Sci Total
Environ 322:71–79
Katsouyanni K (2003) Ambient air pollution and health. British
Medical Bulletin 68(1):143–156
Katsouyanni K, Touloumi G, Spix C, Schwartz J, Balducci F (1997)
Short term effects of ambient sulphur dioxide and particulate
matter on mortality in 12 European cities: results from time series
data from the APHEA project. Br Med J 314:1658–1663
Krewski D, Burnett RT, Goldberg MS, Siemiatycki J, Abrahamowicz
M, White WH (2000) Reanalysis of the Harvard Six Cities Study
and the American Cancer Society Study of particulate air pollution and mortality. Inhal Toxicol 17:343–353
Krzyzanowski M, Kuna-Dibbert B, Schneider J (2005) Health
effects of transport-related air pollution. WHO, Copenhagen
Kunzli N, Kaiser R, Medina S, Studnicka M, Oberfeld G, Horak F
(1999) Health costs due to road traffic-related air pollution: an
impact assessment project of Austria, France and Switzerland.
WHO, Rome
Environ Sci Pollut Res
Kunzli N, Kaiser R, Medina S, Studnicka M, Chanel O (2000) Publichealth impact of outdoor and traffic-related air pollution: a
European assessment. Lancet 356:795–801
Le Tertre A, Medina S, Samoli E, Forsberg B, Michelozzi P (2002)
Short-term effects of particulate air pollution on cardiovascular
diseases in eight European cities. J Epidemiol Community Health
56(10):773–779
Medina S, Boldo E, Saklad M, Niciu EM, Krzyzanowski M (2005)
APHEIS health impact assessment of air pollution and communications strategy. Institut de Veille Sanitaire, Saint-Maurice
Moshammer H, Hutter HP, Schmidt L (2005) Psychological and
social aspects of ‘Transport and health’. In: NicolopoulouStamati P, Hens L, Howard CV (eds) Environmental health
impacts of transport and mobility. Springer, Dordrecht, pp
39–53
NEERI (2000) A report on air quality control. Indian National
Environmental Engineering Research Institute (NEERI), India
Nicolopoulou-Stamati P, Hens L, Lammar P, Howard CV (2005) Effects
of mobility on health—an overview. In: Nicolopoulou-Stamati P,
Hens L, Howard CV (eds) Environmental health impacts of transport and mobility. Springer, Dordrecht, pp 277–309
Pope CA, Dockery DW, Schwartz J (1995) Review of epidemiological
evidence of health effects of particulate air pollution. Inhal
Toxicol 7(1):1–18
Pope CA III, Burnett RT, Thun MJ, Calle EE, Krewski D, Ito K,
Thurston GD (2002) Lung cancer, cardiopulmonary mortality,
and long-term exposure to fine particulate air pollution. JAMA
287(9):1132–1141
Rasouli S, Timmermans HJP (2012) Uncertainty in travel demand
forecasting models: literature review and research agenda.
Transportation Letters: International Journal of Transportation
Research 4(1):55–73
Rodrigue JP, Comtois C, Slack B (2006) Geography of transport
systems. Routledge, New York
Roussou T, Behrakis P (2005) The respiratory effects of air pollution. In:
Nicolopoulou-Stamati P, Hens L, Howard CV (eds) Environmental
health impacts of transport and mobility. Springer, Dordrecht, pp 79–95
Sagar A, Bhattacharya M, Joon VA (2007) Comparative study of air
pollution-related morbidity among exposed population of Delhi.
Indian J Community Med 32:268–271
Samet JM, Dominici F, Curriero FC, Coursac I, Zeger SL (2000) Fine
particulate air pollution and mortality in 20 US cities, 1987–1994.
N Engl J Med 343(24):1742–1749
Schwartz J, Dockery DW (1992a) Increased mortality in Philadelphia
associated with daily air pollution concentrations. Am Rev Respir
Dis 145:600–604
Schwartz J, Dockery DW (1992b) Particulate air pollution and daily
mortality in Steubenville, Ohio. Am J Epidemiol 135:12–19
Sunyer J, Spix C, Quénel P, Ponce-de-leon A, Pönkä A,
Barumandzadeh T, Touloumi G, Bacharova L, Wojtyniak B,
Vonk J, Bisanti L, Schwartz J, Katsouyanni K (1997) Urban air
pollution and emergency admissions for asthma in four European
cities: the APHEA Project. Thorax 52:760–765
Syahril S, Resosudarmo BP, Tomo HS (2002) Study on air quality of
Jakarta, Indonesia: future trends, health impacts, economic value
and policy options. ADB, Jakarta
Walsh M (2002) Contribution of vehicles to overall air pollution in
Asia. ADB, Manila
WHO (2000a) Transport, environment and health. http://
wwweurowhoint/document/e72015pdf. Accessed 1 Dec 2007
WHO (2000b) WHO Ambient Air Quality Guidelines. World
Health Organisation—Regional Office for South East Asia.
http://w3whoseaorg/EN/Section314_4289htm. Accessed 1 Dec
2007
WHO (2003) Health aspects of air pollution with particulate matter,
ozone and nitrogen dioxide. Report on a WHO Working Group.
WHO, Bonn
WHO (2005) Health effects of transport related air pollution. WHO
Regional Office for Europe, Copenhagen, 199 p
WHO (2006) Health effects and risks of transport systems: the
HEARTS project. WHO, Copenhagen
WHO (2007) International Statistical Classification of Diseases and
Related Health Problems 10th revision. http://wwwwhoint/
classifications/icd/en/. Accessed 1 Dec 2008.
Xu X, Gao J, Dockery DW, Chen Y (1994) Air pollution and daily
mortality in residential areas of Beijing, China. Arch Environ
Heal 49(4):216–222
Zanobetti A, Schwartz J, Samoli E, Gryparis A, Touloumi G (2002)
The temporal pattern of mortality responses to air pollution: a
multicity assessment of mortality displacement. Epidemiology 13
(1):87–93
Ziliaskopoulos A, Mitsakis E (2008) Mobility for the city of Hai
Phong, Vietnam—urban transportation planning and mobility
management—the four step model applied to the city of Hai
Phong. Project Integrated Mobility Planning for Hai Phong City,
Vietnam (IMP). University of Thessaly, Thessaly