DSpace at VNU: Ab initio study of the optical phonons in one-dimensional antiferromagnet Ca(2)CuO(3)
Bạn đang xem bản rút gọn của tài liệu. Xem và tải ngay bản đầy đủ của tài liệu tại đây (660.29 KB, 6 trang )
Ab initio study of the optical phonons in one-dimensional antiferromagnet Ca 2 CuO 3
Nam Nhat Hoang, Thu Hang Nguyen, and Chau Nguyen
Citation: Journal of Applied Physics 103, 093524 (2008); doi: 10.1063/1.2917061
View online: />View Table of Contents: />Published by the AIP Publishing
Articles you may be interested in
Calibration of S 119 n isomer shift using ab initio wave function methods
J. Chem. Phys. 130, 124121 (2009); 10.1063/1.3094259
Comparative studies of the spectroscopy of Cu Cl 2 : DFT versus standard ab initio approaches
J. Chem. Phys. 122, 164306 (2005); 10.1063/1.1883167
Ab initio studies of the reactions of Cu ( 2 S, 2 D, and 2 P) with SiH 4 and GeH 4
J. Chem. Phys. 116, 928 (2002); 10.1063/1.1427713
Response to “Comment on ‘Energy band structures of the low-dimensional antiferromagnets Sr 2 CuO 3 and Sr
2 CuO 2 Cl 2 ’” [J. Appl. Phys. 90, 3708 (2001)]
J. Appl. Phys. 90, 4882 (2001); 10.1063/1.1407848
Ab initio studies of phonons in Ca Ti O 3
J. Chem. Phys. 114, 2395 (2001); 10.1063/1.1337057
[This article is copyrighted as indicated in the article. Reuse of AIP content is subject to the terms at: Downloaded to ] IP:
130.70.241.163 On: Tue, 23 Dec 2014 15:09:42
JOURNAL OF APPLIED PHYSICS 103, 093524 ͑2008͒
Ab initio study of the optical phonons in one-dimensional antiferromagnet
Ca2CuO3
Nam Nhat Hoang,a͒ Thu Hang Nguyen, and Chau Nguyen
Center for Materials Science, Vietnam National University, 334 Nguyen Trai, Hanoi 10000, Vietnam
͑Received 3 November 2007; accepted 2 March 2008; published online 8 May 2008͒
We present the cluster-model ab initio study of the optical phonons in the one-dimensional
antiferromagnet Ca2CuO3 based on the Hartree–Fock self-consistent field calculation with the
3-21G basis set. The obtained results showed very good agreement with the observed data. The
Cu–O bands generally showed lower shifts in Ca2CuO3 than in pure CuO and were primarily
composed of the vibrations of the oxygen in static host lattice, whereas the Cu movements only
happened in the collective lattice vibrations. An almost complete classification of the forbidden
phonons is presented. © 2008 American Institute of Physics. ͓DOI: 10.1063/1.2917061͔
I. INTRODUCTION
The importance of the low dimensional system A2CuO3
͑A = Sr, Ca͒ in both practical and fundamental aspects has
attracted much attention from scientists during the past few
decades. This system exhibits various properties associated
with its low dimensionality, such as the covalent insulation,1
the Van Hove singularity on the spin Fermi surface,2 and the
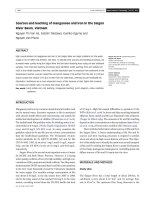
spin-charge separation.3,4 The structure of Ca2CuO3 ͓schematically featured in Fig. 1͑a͔͒ is very similar to the twodimensional superconducting La2CuO4. There is only oxygen lacking which perpendicularly connects two parallel
Cu-O chains. Some compounds with the Ca2CuO3 structure,
e.g., an oxygen excessive Sr2CuO3.1, can transform their
structure under pressure into the La2CuO4 type structure and
become the high Tc superconductors ͑the Sr2CuO3.1 has Tc
= 70 K͒.5 The A2CuO3 exhibits a strong spin 1/2 antiferromagnetic coupling along its one-dimensional ͑1D͒ Cu–O͑2͒
chains. The intrachain exchange integral Jʈ Ϸ 0.6 eV, estimated on the basis of the t-J model, shows a record high
value among the 1D systems and is about 300 times greater
than the interchain coupling JЌ.6–9 With this observation, the
structure of Raman-active phonons along the Cu-O͑2͒ chain
direction is enriched by features that are normally forbidden,
while in the other two directions, only two Ag-mode phonons
are visible. The first experimental study of the optical
phonons in Ca2CuO3 was presented by Yoshida et al.10 and
Zlateva et al.11 and later by Bobovich et al.12 and Hoang et
al.13 The first two studies reported the measurement on the
single crystals, whereas the last two reported on the powder
samples. Despite differences in the chemical contents of the
samples, which followed either from the differences in
preparation routes or from the doping of further elements
͑e.g., Sr or U͒, the discussed phonon structures agreed quite
well with each other. There are also two theoretical results
available for the undoped Ca2CuO3. One is from the lattice
dynamic calculation11 and the other from the tight-binding
approach.14 As these studies showed, there was a strong coupling between the forbidden phonons and the intrachain
a͒
Electronic mail:
0021-8979/2008/103͑9͒/093524/5/$23.00
charge-transfer process mediated by the electrons excited by
light. Although several observed features have their correct
explanation, the problem still remains for the assignment of
Cu–O bands and the majority of overtones. It is also worthwhile to mention that not all phonons can be classified as
originating from the pure Ca2CuO3 phase. Recent studies
have shown that there was always a recognizable amount of
the CuO phase presented in the final Ca2CuO3 samples that
have been prepared by the ceramic technology.12,13,15,16
II. OBSERVED OPTICAL PHONONS IN
Ca2CuO3
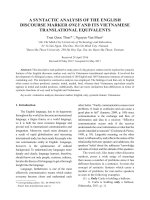
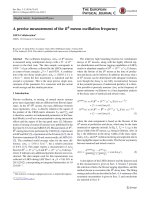
For the pure and the Sr-doped, U-doped Ca2CuO3, several Raman studies are available.10–14 Figure 2 ͑upper part͒
shows the measured data using the light from He–Ne laser
with = 623.8 nm ͓͑i.e., 1.96 eV, note that the maximal scattering output occurs at 2.0 eV ͑Ref. 10͔͒. From Fig. 2, the
peaks are seen at 200, 280, 307, 467, 530, 663, 890, 942,
1142, 1217, and 1337 cm−1. This structure represents the
most complete picture of all observed Raman-active optical
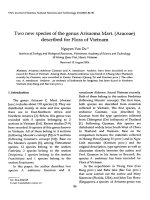
FIG. 1. ͑Color online͒ The packing structure of three unit cells ͑a ϫ 3b
ϫ c͒ for Ca2CuO3 ͑a͒ and the model cluster Ca18Cu8O28 used in the ab initio
calculation of vibrational states ͑b͒.
103, 093524-1
© 2008 American Institute of Physics
[This article is copyrighted as indicated in the article. Reuse of AIP content is subject to the terms at: Downloaded to ] IP:
130.70.241.163 On: Tue, 23 Dec 2014 15:09:42
093524-2
Hoang, Nguyen, and Nguyen
FIG. 2. The Raman scattering spectra ͑upper͒ and the FTIR transmission
spectra ͑lower͒ of the pure Ca2CuO3. The Raman lines selected for listing in
Table I are denoted by the arrows. The data for the graphs were taken from
Ref. 13 with the permission from those authors.
phonons in the Ca2CuO3. For the scattering light from
Nd:YAG ͑yttrium aluminum garnet͒ laser ͑ = 1064 nm, i.e.,
1.17 eV͒, some peaks disappeared ͑i.e., 200, 467, and
942 cm−1͒ but the main features remained the same.12,13 It is
obvious that the structure of the Raman spectra depends on
energy of the excitation light and for our case the He–Ne
laser provided a more complete set of scattering lines. In
Table I, we summarized all observed frequencies. We now
revise how these peaks have been assigned in Refs. 10 and
11. From the symmetry analysis, in the space group Immm
25
͑D2h
͒, the optical phonons at the ⌫ point ͑k = 0͒ compose of
six Raman active modes ͑2Ag + 2B1g + 2B2g͒ and nine IR active modes ͑3B1u + 3B2u + 3B3u͒. The Ag-, B1g-, and B2g-mode
phonons associate with the Wyckoff site 4f ͑site symmetry
C22v͒ of the Ca and O͑1͒, so with the vibrations of these
atoms along axis c ͑Ag͒ and a and b ͑B1g and B2g͒. The
Ag-mode phonons are active in the ͑a , a͒, ͑b , b͒, and ͑c , c͒
geometry and the B1g- and B2g-mode phonons are allowed
only in the ͑a , c͒ and ͑b , c͒ settings. By performing the scattering measurement in these exact configurations with some
single crystal pieces, the Ag-, B1g-, and B2g-mode phonons
can be determined. Indeed, Yoshida et al.10 has identified the
Ag-mode phonons to be 306 cm−1 ͑assigned to the Ca movement͒ and 530 cm−1 ͓assigned to the O͑1͒ movement͔.
J. Appl. Phys. 103, 093524 ͑2008͒
¯ and
These two phonons were the sole phonons in the c͑a , a͒c
¯ configurations, so the assignments were unique.
a͑c , c͒a
However, no structures due to the B1g- and B2g-mode
phonons were experimentally observed in the respective
scattering configurations.10,11
¯ configuThe rich features only appeared for the a͑b , b͒a
ration, i.e., when the light polarization was parallel to axis b.
Yoshida et al.10 reported the following lines: 235, 306, 440,
500, 690, 880, 940, 1140, 1200, and 1330 cm−1. All these
peaks, except the one at 500 cm−1 ͑not seen in Refs. 11 and
12͒, have their counterparts in the spectra in Fig. 2 ͑upper
part͒. The weak features that were also visible ͑but not discussed͒ in Ref. 10 closely correspond to 200, 470, 640, 1000,
and 1390 cm−1. The first two of them were also reported in
Ref. 11. This peak structure is richer than that offered by the
symmetry analysis. Among them, the 440, 500, and
690 cm−1 were ascribed as the first-order zone-boundary
phonons ͓T-point with k = ͑0.5, 0.5, 0͔͒, whereas the 880,
940, 1140, 1200, and 1330 cm−1 as their high-order two
phonon scatterings.10 Since the 440 and 690 cm−1 lines were
also observed for both doped and undoped Ca2CuO3 ͑440
and 670 cm−1 in Ref. 12, 430 and 690 cm−1 in Ref. 11, and
430 and 670 cm−1 in Ref. 13͒ Zlateva et al.11 suggested that
all extra lines in the Raman spectra are due to the high-order
scattering. This consideration resources in the finite and segmented Cu–O͑2͒ chains of different lengths in the real polycrystalline samples, which expectedly leads to the overtones.
It may, however, result from the impure phases presented as
it was difficult to exclude all CuO, CaO, and CaCu2O3
phases from the final product by means of the ceramic and
oxalate coprecipitation techniques.15,16
The B1u-, B2u-, and B3u-mode phonons, associated with
all Wyckoff sites in the Immm space group ͓namely, 2d of
Cu, 2a of O͑2͒, and 4f of Ca and O͑1͔͒, correspond to the
vibration of these atoms along the crystallographic axis c, b,
and a respectively. As these modes are IR active, they can be
observed in the reflectivity measurement for light polarization along each axis10 or in the IR transmission
measurement.11 The following lines were reported in Ref. 10
͑TO phonons͒: 215, 340, and 660 cm−1 ͑B2u͒, 260, 410, 460,
and 580 cm−1 ͑B1u and B3u͒. The additional structures were
found at 350 and 540 cm−1 and were ascribed as the B1uand B3u-mode phonons in Ref. 11. Most of these peaks are
reproduced in Fig. 2 ͑lower part͒.
III. DEFINITION OF CLUSTER MODELS AND OTHER
SETTINGS
For the purpose of classification of all the vibrational
states, we performed the ab initio study on the model cluster
illustrated in Fig. 1͑b͒ with the GAUSSIAN 2003 software.17
This is a medium sized layer model stacking one Cu–O layer
between the other two Ca–O layers. One of the difficulties
with the cluster model, besides the usual convergence problems and vast computational costs, is that the symmetry of
the local models is not the same as that of the real compound. This introduces several additional model-specific
lines into the output spectra. Those “phantom lines” can be
partly identified by investigating various models of different
[This article is copyrighted as indicated in the article. Reuse of AIP content is subject to the terms at: Downloaded to ] IP:
130.70.241.163 On: Tue, 23 Dec 2014 15:09:42
093524-3
J. Appl. Phys. 103, 093524 ͑2008͒
Hoang, Nguyen, and Nguyen
TABLE I. The Raman and IR frequencies ͑cm−1͒ for Ca2CuO3. Comparisons are given to the pure Ca2CuO3
͑Ref. 11͒, the Sr-doped Ca2CuO3 ͑Refs. 10 and 11͒ and to the theoretical values obtained by the lattice dynamic
calculation ͑Refs. 11͒. and the tight-binding approach ͑Ref. 14͒. For the Raman-forbidden lines, the values
presented in parentheses correspond to the additional features visible in Fig. 4 in Ref. 10 but not reported by its
authors.
Optical phonons in Ca2CuO3
Assignment
͑BV= breathing vibration͒
Refs. 10 and 11
Ca
O͑1͒
Cu
O͑1͒
O͑2͒
Cu ͑B3u͒
Cu ͑B1u͒
O͑1͒, O͑2͒ ͑B3u͒
O͑1͒ ͑B1u͒
O͑2͒ ͑B3u͒
O͑2͒ ͑B1u͒
O͑2͒ ͑B1u͒
?
Cu
?
T-point O͑2͒
235+ 235
O͑1͒, O͑2͒
?
O͑1͒, O͑2͒
Two phonon
Two phonon
Two phonon
Two phonon
Two phonon
Three phonon
Two phonon
This work
Expt.
Ref. 10
Ref. 11
Theor.
Ref. 13
Ref. 11
Ag-mode phonons ͑Raman active͒ ͑c axis͒
306
311
307
311
530
531
530
531
B2u-mode phonons ͑IR active͒ ͑b axis͒
Cu
215
225
215
201
O͑1͒
340
354
350
371
O͑2͒
660
682
670
673
B1u- and B3u-mode phonons ͑IR active͒ ͑c and a axes͒
194
155
Cu, Ca ʈ a + BV ͑B1u͒
260
278
272
291
O͑2͒ , O͑1͒ ʈ a ͑B3u͒
350
354
350
337
O͑1͒ ʈ c ͑B1u͒
410
412
415
400
O͑1͒ ʈ a ͑B3u͒
460
457
453
424
O͑2͒ ʈ c ͑B1u͒
540
530
532
O͑2͒ ʈ c ͑B1u͒
580
577
The Raman-forbidden lines
͑200͒
203
200
O͑2͒ ʈ a + BV
235
O͑2͒ ʈ a + Caʦ ͑b , c͒
O͑2͒ ʈ a
310
280
440
430
O͑1͒ ʈ c + BV
͑470͒
472
467
O͑1͒ ʈ c + O͑2͒ ʈ b + BV
O͑1͒ ʈ a + O͑2͒ ʦ ͑a , b͒
500
O͑2͒ ʈ b + CuO?
͑640͒
?
690
690
663
440+ 440
880
880
890
440+ 500
940
940
942
500+ 500 or CaO?
͑1000͒
440+ 690
1140
1142
500+ 690
1200
1217
440+ 440+ 440
1330
1337
690+ 690
͑1390͒
Ca
O͑1͒
shapes and sizes, but they cannot be avoided in principle. Six
different clusters were involved in the calculation: ͑1͒ Starting from the Ca4Cu2O8 cluster by adding a unit Ca2Cu2O6 to
form the twofold and threefold structures Ca6Cu4O14 and
Ca8Cu6O20 and ͑2͒ starting from a sixfold cluster
Ca18Cu8O28 ͓Fig. 1͑b͔͒ by adding a unit Ca6Cu4O12 to form
the ninefold and twelvefold structures Ca24Cu12O40 and
Ca30Cu16O52. The largest cluster contains 938 basis functions
͓molecular orbitals ͑MOs͔͒ for the UHF/STO-3G setting
͑746 paired electron occupied MOs and 192 unoccupied
MOs͒. It is reasonable that the higher level theories can be
used for the smaller clusters, such as the density functional
theory with some larger basis sets. However, for the larger
clusters ͑sixfold and above͒, the calculation was performed
using the self-consistent field ͑SCF͒ Hartree–Fock ͑HF͒
method with the unrestricted spin model ͑UHF͒ on the 3-21G
wave function basis set. The more compact restricted spin
HF model ͑RHF͒ was successful in the so-called single point
Ref. 14
This work
530
306
528
700
210
337
657
135
450
419
505
265
351
410
457
548
589
211
231
288
440
461
512
630
670
energy calculation ͑integral accuracy reduced to 10−5͒ but
usually failed in the second derivatives calculation ͑when the
integral accuracy increased to 10−8͒. For the smaller clusters,
the stability tests showed that there was a transition from the
RHF to UHF, i.e., the UHF wave functions usually provided
the lower energy minimum. With the increase in cluster size,
there was a considerable difference in the output spectra
when the smaller STO-3G set was substituted for the 3-21G
set. However, the difference was not large if the 6-31G set
replaced the 3-21G set. It is preferably to chose the larger
sets but for the relatively large sizes of the studied clusters,
the 3-21G set provided optimal computational efficiency at
the present time. Larger settings, e.g., the DFT/6-31G required an extra amount of storage which exceeded the 4 GB
limit for the file size in most file systems. The frequency
computation was accomplished with the Mulliken charge
analysis and the thermochemistry analysis for the vibrational
states.
[This article is copyrighted as indicated in the article. Reuse of AIP content is subject to the terms at: Downloaded to ] IP:
130.70.241.163 On: Tue, 23 Dec 2014 15:09:42
093524-4
Hoang, Nguyen, and Nguyen
J. Appl. Phys. 103, 093524 ͑2008͒
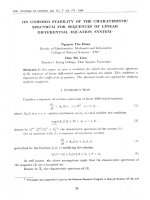
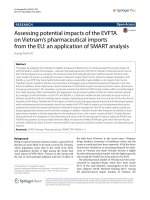
FIG. 3. The simulated IR and Raman spectra for the Ca18Cu8O28 cluster as
obtained from the ab initio calculation using the unrestricted spin HF SCF
model with 3-21G basis set.
IV. PHONONS FROM THE AB INITIO CALCULATION
Excluding the vibrations that are specifically associated
with the atoms lying at the cluster boundary, the final calculated Raman and IR spectra are shown in Fig. 3. These spectra belong to the medium sized cluster Ca18Cu8O28.
From the analysis of simulated vibrational states three
IR-active B2u frequencies 210, 337, and 657 cm−1 correspond to the vibration of Cu, O͑1͒, and O͑2͒ along b axis.
These lines have been assigned in Ref. 10 to the same atoms,
however, the ab initio results show some slight movement of
Ca with the 210 cm−1 line. The B3u phonon at 351 and the
B1u phonons at 548 and 589 cm−1 associate with the vibration of O͑2͒ along axis a and c respectively. The O͑1͒ atoms
also participate in the 351 line. The assignment here is again
the same as in Ref. 10. The other B1u phonon at 410 cm−1
and B3u phonon at 457 cm−1 originate in the moving of O͑1͒
along c or a. In Refs. 10 and 11, the O͑2͒ movement along
axis a has been assigned to the 457 cm−1 line. The rest peak,
i.e., the B1u phonon seen at 265 cm−1, follows from the
breathing vibration involving both Cu and Ca transition
along axis a. This peak has been considered as resulting from
the sole movement of Cu in the previous studies.10,11
The assignments for the two Raman-active Ag-mode
phonons 306 and 528 cm−1 are the same as in Ref. 10. These
phonons are caused by the moving of the Ca and O͑1͒ along
axis c in nearly static host lattice.
Among the Raman-forbidden lines that were considered
as the overtones in the previous studies,10,11 the peaks at 211,
231, and 288 cm−1 mainly follow from the movement of
O͑2͒ along axis a ͑288 line͒ plus the breathing vibration
͑211͒ or the movement of Ca in ͑b , c͒ plane ͑231͒. The peaks
440 and 461 cm−1 originate from the vibration of O͑1͒ along
c ͑440͒ plus O͑2͒ along b ͑461͒. The shift at 512 cm−1 ͓observed also in the Sr-doped Ca2CuO3 ͑Refs. 10 and 11͔͒ is
due to the displacement of both O͑1͒ along axis a and O͑2͒
in ͑a , b͒ plane. The sole O͑2͒ stretching motion along axis b
is responsible for the 630 cm−1 forbidden line. The illustration is given in Fig. 4 for the 211 and 512 cm−1 lines.
FIG. 4. ͑Color online͒ Two phases of the O͑2͒ vibration along axis a in the
forbidden 211 cm−1 Raman shift ͑a͒ and the phases of the O͑1͒ parallel
movement along a together with the O͑2͒ stretching motion in ͑a , b͒ plane
in 512 cm−1 shift ͑b͒.
It is worth noting that in Ca2CuO3, the Cu–O͑2͒ bands
showed the lower frequencies in comparison with the Cu–O
bands in pure CuO, e.g., 288 vs 298 cm−1 and 630 vs
632 cm−1. This agrees with the smaller force constant for the
Cu-O bonding in Ca2CuO3, which is partly demonstrated by
the longer average bond distance, 1.889 Å in Ca2CuO3 versus 1.875 Å in CuO. From the charge analysis, the valence
distributed within the Cu–O bonds in the pure CuO is also a
little higher than in the Ca2CuO3.
For the shifts associated with the Ca–O bands, two lines
are seen at 231 and 1000 cm−1. Although the 1000 cm−1
peak is suggested as the two phonon scattering from the
500 cm−1 line, there is no reason to exclude it from being
considered as originating from the impure CaO.
For the Raman shifts which correspond to the vibration
of the Cu, the ab initio results showed that there was no
simple vibration of Cu in the static host lattice. All vibrations
involving the Cu atoms are mainly the collective lattice vibrations in which the O͑2͒ atoms participate ͑e.g., the
211 cm−1 line͒. This observation agrees well with the structural analysis of rigidity of the Cu–O͑2͒ bonds ͑axis b͒ previously given in Refs. 13 and 15 and with the strong coupling of phonons in the 1D Cu–O͑2͒ chain with electron-hole
pairs created during excitation by light.10,14 Such coupling is
a very typical phenomenon in the superconducting cuprates.
The doping in Ca2CuO3 seems to have only a little effect on
its phonon structure as all known cases until now ͑i.e.,
Sr-doped10,11 and U-doped13͒ did not show any new features.
[This article is copyrighted as indicated in the article. Reuse of AIP content is subject to the terms at: Downloaded to ] IP:
130.70.241.163 On: Tue, 23 Dec 2014 15:09:42
093524-5
V. CONCLUSION
From the analysis given, the Cu–O͑2͒ bands in Ca2CuO3
are strongly coupled with the collective lattice breathing vibrations while most of the rest of the phonons originates
from the sole vibrations of the oxygen in nearly static host
lattice. For more accurate results, the density functional
theory calculation should be involved with some larger basis
sets such as the 6-31G. Considering computational costs at
the present time, we leave this for the future.
ACKNOWLEDGMENTS
The authors would like to thank Project Nos. QG-07-02
͑Vietnam National Univeristy͒ and DTCB 405 506 ͑Ministry
of Science and Technology, Vietnam͒ for the financial supports.
1
J. Appl. Phys. 103, 093524 ͑2008͒
Hoang, Nguyen, and Nguyen
K. Maiti, D. D. Sarma, T. Mizokawa, and A. Fujimori, Europhys. Lett. 37,
359 ͑1997͒; Phys. Rev. B 57, 1572 ͑1998͒.
2
H. Suzuura, H. Yasuhara, A. Furusaki, N. Nagaosa, and Y. Tokura, Phys.
Rev. Lett. 76, 2579 ͑1996͒.
3
R. Neudert, M. Knupfer, M.S. Golden, J. Pink, W. Stephan, K. Penc, N.
Motoyama, H. Eisaki, and S. Uchida, Phys. Rev. Lett. 81, 657 ͑1998͒.
4
C. Kim, A. Y. Matsuura, Z.-X. Shen, N. Motoyama, H. Eisaki, S. Uchida,
T. Tohyama, and S. Maekawa, Phys. Rev. Lett. 77, 4054 ͑1996͒.
5
Z. Hiroi, Z. Takano, M. Asuma, and Y. Takeda, Nature ͑London͒ 364, 315
͑1993͒.
6
T. Ami, M. K. Crawford, R. L. Harlow, Z. R. Wang, D. C. Johnston, Q.
Huang, and R. W. Erwin, Phys. Rev. B 51, 5994 ͑1995͒.
7
N. Motoyama, H. Eisaki, and S. Uchida, Phys. Rev. Lett. 76, 3212 ͑1996͒.
8
H. Rosner, H. Eschrig, R. Hayn, S.-L. Drechsler, and J. Malek, Phys. Rev.
B 56, 3402 ͑1997͒.
9
C. de Graaf and F. Illas, Phys. Rev. B 63, 014404 ͑2000͒.
10
M. Yoshida, S. Tajima, N. Koshizuka, S. Tanaka, S. Uchida, and S. Ishibashi, Phys. Rev. B 44, 11997 ͑1991͒.
11
G. A. Zlateva, V. N. Popov, M. Gyulmezov, L. N. Bozukov, and M. N.
Iliev, J. Phys.: Condens. Matter 4, 8543 ͑1992͒.
12
Ya. S. Bobovich, V. N. Denisov, B. N. Mavrin, and T. I. Chuvaeva, Opt.
Spectrosc. 89, 372 ͑2000͒.
13
N. N. Hoang, D. C. Huynh, D. T. Nguyen, T. T. Nguyen, D.T. Ngo, M.
Finnie, and C. Nguyen, Appl. Phys. A ͑submitted͒.
14
S.-L. Drechsler, J. Malek, M. Yu. Lavrentiev, and H. Koppel, Phys. Rev. B
49, 233 ͑1994͒.
15
D. C. Huynh, D. T. Ngo, and N. N. Hoang, J. Phys.: Condens. Matter 19,
106215 ͑2007͒.
16
J. Wada, S. Wakimoto, S. Hosoya, K. Yamada, and Y. Endoh, Physica C
244, 193 ͑1995͒.
17
M. J. Frisch, G. W. Trucks, H. B. Schlegel et al., GAUSSIAN 03, Revision
B.03, Gaussian, Inc., Pittsburgh PA, 2003.
[This article is copyrighted as indicated in the article. Reuse of AIP content is subject to the terms at: Downloaded to ] IP:
130.70.241.163 On: Tue, 23 Dec 2014 15:09:42