DSpace at VNU: Critical behavior of La0.7Ca0.3Mn1-xNixO3 manganites exhibiting the crossover of first- and second-order phase transitions
Bạn đang xem bản rút gọn của tài liệu. Xem và tải ngay bản đầy đủ của tài liệu tại đây (817.4 KB, 7 trang )
Solid State Communications ∎ (∎∎∎∎) ∎∎∎–∎∎∎
1
2
3
4
5
6
7
8
9
10
11
12
13
14
15
16
17
18
19
20
21
22
23
24
25
26
27
28
29
30
31
32
33
34
35
36
37
38
39
40
41
42
43
44
45
46
47
48
49
50
51
52
53
54
55
56
57
58
59
60
61
62
63
64
65
66
Contents lists available at ScienceDirect
Solid State Communications
journal homepage: www.elsevier.com/locate/ssc
Critical behavior of La0.7Ca0.3Mn1 À xNixO3 manganites exhibiting the
crossover of first- and second-order phase transitions
Q1
Q2
Q3
The-Long Phan a,b,1, Q.T. Tran b,e, P.Q. Thanh b,c, P.D.H. Yen b,d, T.D. Thanh b,e, S.C. Yu a,b
a
Department of Physics, Chungbuk National University, Cheongju 361-763, South Korea
Center for Science and Technology Communication, Ministry of Science and Technology, 113 Tran Duy Hung, Hanoi, Vietnam
c
Faculty of Physics, Hanoi University of Science, Vietnam National University, Hanoi, Vietnam
d
Faculty of Engineering Physics and Nanotechnology, VNU – University of Engineering and Technology, Xuan Thuy, Cau Giay, Hanoi, Vietnam
e
Institute of Materials Science, Vietnam Academy of Science and Technology, 18 Hoang Quoc Viet, Cau Giay, Hanoi, Vietnam
b
art ic l e i nf o
a b s t r a c t
Article history:
Received 29 October 2013
Received in revised form
28 December 2013
Accepted 29 December 2013
by F. Peeters
We used Banerjee0 s criteria, modified Arrott plots, and the scaling hypothesis to analyze magnetic-field
dependences of magnetization near the ferromagnetic–paramagnetic (FM–PM) phase-transition temperature (TC) of perovskite-type manganites La0.7Ca0.3Mn1 À xNixO3 (x ¼0.09, 0.12 and 0.15). In the FM
region, experimental results for the critical exponent β ( ¼0.171 and 0.262 for x ¼0.09 and 0.12,
respectively) reveal two first samples exhibiting tricriticality associated with the crossover of first- and
second-order phase transitions. Increasing Ni-doping content leads to the shift of the β value ( ¼0.320 for
x ¼ 0.15) towards that expected for the 3D Ising model (β ¼ 0.325). This is due to the fact that the
substitution of Ni ions into the Mn site changes structural parameters and dilutes the FM phase, which
act as fluctuations and influence the FM-interaction strength of double-exchange Mn3 þ –Mn4 þ pairs, and
the phase-transition type. For the critical exponent γ ( ¼0.976–0.990), the stability in its value
demonstrates the PM behavior above TC of the samples. Particularly, around TC of La0.7Ca0.3Mn1 À xNixO3
compounds, magnetic-field dependences of the maximum magnetic-entropy change can be described by
a power law of |ΔSmax| p Hn, where values n ¼0.55–0.77 are quite far from those (n ¼0.33–0.48)
calculated from the theoretical relation n ¼1 þ (β À 1)/(β þ γ). This difference is related to the use of the
mean-field theory for the samples exhibiting the magnetic inhomogeneity.
& 2014 Published by Elsevier Ltd.
Keywords:
A. Perovskite manganites
D. Critical behavior
D. Magnetic entropy change
1. Introduction
It is known that hole-doped lanthanum manganites of
La1 À x(Ca, Sr, Ba)xMnO3 with x¼ 0.3 (corresponding to Mn3 þ /
Mn4 þ ¼7/3) usually exhibit colossal magnetoresistance (MR) and
magnetocaloric (MC) effects around their the ferromagnetic–
paramagnetic (FM–PM) phase-transition temperature (the Curie
temperature, TC) [1]. With this doping content, double-exchange
(DE) FM interactions between Mn3 þ and Mn4 þ are dominant as
comparing with super-exchange anti-FM interactions of Mn3 þ –
Mn3 þ and Mn4 þ –Mn4 þ pairs. The strength of magnetic interactions thus depends on the average bond length 〈Mn–O〉, and bond
angle 〈Mn–O–Mn〉 of the perosvkite structure. Different compounds have different bond parameters, which are related to
Jahn–Teller lattice distortions due to strong electron–phonon
coupling [2]. In reference to the symmetry of MnO6 octahedra, it
has been noted that cooperative Jahn–Teller distortions are
E-mail address: (T.-L. Phan).
Tel.: þ82 43 261 2269.
1
present in an orthorhombic structure rather than in the rhombohedral one [3].
Among hole-doped manganites, orthorhombic La0.7Ca0.3MnO3
is known as a typical material exhibiting MR and MC effects much
greater than those obtained from the other compounds. Particularly, depending on bulk or nanostructured sample types, its TC in
the range of 222–265 K [3–9] can be tuned towards room
temperature by doping Sr, Ba or Pb [10–14]. Meanwhile, the
transition-metal doping (such as Co, Fe, Ni and so forth) lowers
TC [15–17]. Additionally, its discontinuous FM–PM transition at TC
is followed up with structural changes, and is known as a firstorder magnetic phase transition (FOMT) [8,9,12]. This discontinuous phase transition can be rounded to a continuous one of a
second-order magnetic phase transition (SOMT) upon the doping,
and reduced dimensionality (i.e., finite-size effects), and external
fields [5,7,11,12,16,18,19]. The assessment of a continuous SOMT
can base on the success in determining the critical exponents β, γ,
and δ associated with temperature dependences of the spontaneous magnetization, Ms(T), inverse initial susceptibility, χ0–1(T),
and critical isotherm at TC, respectively [20,21]. Distinguishing the
FOMT from the SOMT can be based on the criteria proposed by
0038-1098/$ - see front matter & 2014 Published by Elsevier Ltd.
/>
Please cite this article as: T.-L. Phan, et al., Solid State Commun (2014), />
67
68
69
70
71
72
73
74
75
76
77
78
79
80
81
82
83
84
85
86
87
88
89
90
91
92
93
Three polycrystalline perovskite-type manganites La0.7Ca0.3
Mn1 À xNixO3 with x ¼0.09, 0.12 and 0.15 were prepared by solidstate reaction as using purity commercial powders La2O3, CaO,
NiO, and MnCO3 (99.9%) as precursors. These powders combined
with stoichiometrical quantities were well mixed and ground, and
then pre-annealed at 900 1C for 24 h. After pre-annealing, three
mixtures were re-ground and pressed into pellets, and annealed at
1300 1C for 72 h in air. For reference, the parent compound
La0.7Ca0.3MnO3 was also prepared with the same conditions as
described. X-ray diffraction (XRD) patterns of the final products
checked by an X-ray diffractometer (Bruker AXS, D8 Discover)
revealed the single phase in an orthorhombic structure (the space
group Pbnm) of La0.7Ca0.3Mn1 À xNixO3 samples, see Fig. 1(a). Basing
on the XRD data, we calculated the lattice parameters (a, b, and c)
and unit cell (V), as shown in Table 1. The variation of these
parameters indicates the substitution of Ni ions (could be
Ni2 þ , Ni3 þ , and/or Ni4 þ ) for Mn in the perovskite structure.
Magnetic measurements were performed on a superconducting
quantum interference device magnetometer (SQUID). The TC
values obtained from the flexion points in temperature dependences of magnetization, M(T), with the applied field H ¼100 Oe,
Fig. 1(b) are about 200, 185 and 170 K for x ¼0.09, 0.12 and 0.15,
respectively, which are lower than the value TC E 260 K of the
parent compound.
3. Results and discussion
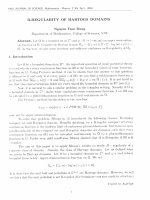
Fig. 2 shows M–H data and inverse Arrott plots (H/M versus M2)
at different temperatures around the FM–PM phase transition of
La0.7Ca0.3Mn1 À xNixO3. It appears from the M–H data that there is
no saturation magnetization value in spite of the H variation up to
40 kOe. This is assigned to the existence of the magnetic inhomogeneity or short-range FM order. At a given temperature, higher
Ni-doping content reduces the magnetization. With increasing
temperature, nonlinear M–H curves in the FM region become
linear because the samples enter the PM state. Different from the
parent compound [5,7–9,12], there is no S-like shape in the M–H
curves, and negative slopes in the H/M versus M2 curves, see Fig. 2.
These tokens demonstrate our Ni-doped samples undergoing the
FOMT [22,25].
(004)/(242)
(123)/(321)
x = 0.15
x = 0.12
x = 0.09
x=0
30
40
50
60
70
2θ (degree)
1.2
H = 100 Oe
0.9
2. Experimental details
(202)/(040)
(022)/(220)
Intensity (arb. units)
(121)
Banerjee [22], who performed H/M versus M2 curves (where H is
the field, and M is the magnetization) in the vicinity of TC, and then
suggested that their positive or negative slopes are indication of a
second- or first-order phase transition, respectively. Reviewing
previous
studies, one can see that many works focused on La0.7Ca0.3MnO3-based materials showing the FOMT and/or SOMT. However,
the crossover region from first-order to second-order phase
transitions, and some related physical properties, such as the
magnetic entropy change versus T and H, ΔSm(T, H), have not
been widely studied. Furthermore, there is no much attention
given to the assessment of a magnetic ordering parameter (n)
determined from the relations n ¼1 þ(β À 1)/(β þ γ) [23], and from
a power law |ΔSmax(H)| p Hn [24] (where |ΔSmax| is the maximum
magnetic entropy change around TC). To get more insight into the
above problems, we prepared La0.7Ca0.3Mn1 À xNixO3 compounds,
and have studied their critical behaviors upon Banerjee0 s criteria
[22], modified Arrott plots and the scaling hypothesis [20,21]. The
determined critical values are then discussed together with the
magnetic ordering parameter n.
Normalized M
1
2
3
4
5
6
7
8
9
10
11
12
13
14
15
16
17
18
19
20
21
22
23
24
25
26
27
28
29
30
31
32
33
34
35
36
37
38
39
40
41
42
43
44
45
46
47
48
49
50
51
52
53
54
55
56
57
58
59
60
61
62
63
64
65
66
T.-L. Phan et al. / Solid State Communications ∎ (∎∎∎∎) ∎∎∎–∎∎∎
2
x=0
x = 0.12
x = 0.09
x = 0.15
0.6
0.3
0.0
0
50
100
150
200
250
300
T (K)
Fig. 1. (Color online) (a) Room-temperature XRD patterns, and (b) normalized M(T)
curves with the applied field of H¼100 Oe for La0.7Ca0.3Mn1 À xNixO3 (x ¼0, 0.09,
0.12, and 0.15).
Table 1
Values of the lattice parameters and unit cell calculated from XRD analyses of
La0.7Ca0.3Mn1 À xNixO3 with x¼ 0.09, 0.12 and 0.15.
Sample, x
a (Å)
b (Å)
c (Å)
V (Å3)
0
0.09
0.12
0.15
5.473
5.467
5.461
5.474
4.461
5.451
5.450
5.450
7.711
7.707
7.719
7.713
230.46
229.70
229.73
230.10
According to the mean-field theory (MFT) proposed for a ferromagnet exhibiting the SOMT and long-range FM interactions [26],
the free energy GL is expanded in even powers of M: GL ¼ aM2 þ
bM4 þ⋯ – HM, where a and b are temperature-dependent parameters. Minimizing GL as ∂GL/∂M¼0 results in the relation H/M ¼
2a þ4bM2. It means that if magnetic interactions of the FM system
exactly obey the MFT, M2 versus H/M curves in the vicinity of TC
are parallel straight lines. At TC, the M2 and H/M line passes
through the origin [27,28]. However, these features are absent
from the Arrott performance shown in Fig. 2(b, d, and e). It means
that magnetic interactions in the samples could not be the longrange type. The critical exponents β ¼0.5 and γ ¼ 1.0 (in the normal
Arrott plots [20,27]) based on the MFT are thus not suitable to
describe magnetic interactions taking place in our samples. Within
the framework of the MFT, we need to find other sets of the
critical-exponent values reflecting more frankly the magnetic
properties of the samples. This work is based on the modified
Arrott plot (MAP) method [20], which is generalized by the
γ
β
scaling equation of state, (H/M)1/ ¼c1ε þc2M1/ , where c1 and c2
Please cite this article as: T.-L. Phan, et al., Solid State Commun (2014), />
67
68
69
70
71
72
73
74
75
76
77
78
79
80
81
82
83
84
85
86
87
88
89
90
91
92
93
94
95
96
97
98
99
100
101
102
103
104
105
106
107
108
109
110
111
112
113
114
115
116
117
118
119
120
121
122
123
124
125
126
127
128
129
130
131
132
T.-L. Phan et al. / Solid State Communications ∎ (∎∎∎∎) ∎∎∎–∎∎∎
182 K
80
8
182 K
ΔT = 2 K
60
6
220 K
220 K
4
40
2
20
0
10
20
30
M (emu/g)
80
40
50
0
2
4
6
168 K
168 K
60
0
8
8
206 K
6
206 K
40
4
20
2
0
0
10
20
30
40
50
0
2
4
8
ΔT = 2 K
60
0
6
152 K
152 K
190 K
6
190 K
40
4
20
0
H/M (102, Oe.g/emu)
0
ΔT = 2 K
1
2
3
4
5
6
7
8
9
10
11
12
13
14
15
16
17
18
19
20
21
22
23
24
25
26
27
28
29
30
31
32
33
34
35
36
37
38
39
40
41
42
43
44
45
46
47
48
49
50
51
52
53
54
55
56
57
58
59
60
61
62
63
64
65
66
3
2
0
10
20
30
H (kOe)
40
50
0
1
2
3
4
5
0
M2 (103, emu/g)2
Fig. 2. (Color online) M–H data and inverse Arrott plots for La0.7Ca0.3Mn1 À xNixO3 with (a, b) x ¼ 0.09, (c, d) x¼ 0.12, and (e, f) x ¼0.15.
are temperature-dependent parameters, and ε ¼(T À TC)/TC is the
reduced temperature. β and γ values can be obtained from the
asymptotic relations [18,20]
M s ðTÞ ¼ M 0 ð À εÞβ ;
χ 0À 1 ðTÞ ¼ ðh0 =M0 Þεγ ;
M ¼ DH 1=δ ;
ε ¼ 0;
ε o 0;
ε 40;
ð1Þ
ð2Þ
ð3Þ
where M0, h0, and D are the critical amplitudes. Additionally,
according to the static-scaling hypothesis [21], M is a function of ε
and H, MðH; εÞ ¼ jεjβ f 7 ðH=jεjβ þ γ Þ. This equation reflects that, with
β
β γ
determined β and γ values, plotting M/ε versus H/ε þ makes all
data points falling on the f À and f þ branches for T oTC and T 4TC,
respectively. Here, determining the critical parameters is based on
the MAP method, and started from the scaling equation of state.
Correct β and γ values make M–H data points falling on a set of
β
γ
parallel straight lines in the performance of M1/ versus (H/M)1/ .
1/β
1/γ
Moreover, the M
versus (H/M) line passes through the origin
at TC. Similar to the MFT case, our analyses indicated that the
exponent values β ¼0.365 and γ ¼ 1.336 expected for the 3D
Heisenberg model [21] do not match with the descriptions of
the MAP method. Only β ¼ 0.25 and γ ¼ 1.0 expected for the
tricritical MFT model (T-MFT), and β ¼ 0.325 and γ ¼1.241 expected
for the 3D Ising model [12,29] can be used as initially trial values
to find optimal exponent values for the samples with x¼ 0.09 and
0.12, and for x¼ 0.15, respectively. With these trial values, Ms(T)
and χ0(T) data would be obtained from the linear extrapolation in
the high-field region for the isotherms to the co-ordinate axes of
β
γ
γ
M1/ and (1/χ0)1/ ¼(H/M)1/ , respectively. The Ms(T) and χ0(T) data
obtained from the linear extrapolation are then fitted to Eqs. (1)
and (2), respectively, to achieve better β, γ and TC values, as can be
seen from Fig. 3. These new values of β, γ, and TC are continuously
used for next MAP processes until their optimal values are
achieved. Notably, the TC values of the samples obtained from
M–T measurements were also used as reference in the fitting. With
such the careful comparison, only the sets of critical parameters
with TC E199.4 K, β ¼0.171 70.006 and γ ¼0.9767 0.012 for x ¼
0.09; TC E184.4 K, β ¼0.262 70.005 and γ ¼0.979 70.012 for
x¼ 0.12; and TC E170 K, β ¼0.320 70.009 and γ ¼ 0.9907 0.082
for x¼ 0.15 are in good agreement with the MAP descriptions, see
Fig. 4. With the obtained critical exponents, the scaling perforβ
β γ
mance of M/|ε| versus H/ε þ curves, see Fig. 5 and their inset,
reveals the M–H data points at high-magnetic fields falling into
two f À and f þ universal branches for T oTC and T 4TC, respectively. These results prove the reliability in value of the critical
values obtained from our work. It should be noticed that the MAP
method only works well for the fields (HL) higher than 28, 24 and
Please cite this article as: T.-L. Phan, et al., Solid State Commun (2014), />
67
68
69
70
71
72
73
74
75
76
77
78
79
80
81
82
83
84
85
86
87
88
89
90
91
92
93
94
95
96
97
98
99
100
101
102
103
104
105
106
107
108
109
110
111
112
113
114
115
116
117
118
119
120
121
122
123
124
125
126
127
128
129
130
131
132
TC = 199.5 ± 0.1
β = 0.171 ± 0.006
185
190
195
200
205
210
40
2
30
0
170
215
TC = 184.3 ± 0.1
γ = 0.979 ± 0.012
TC = 184.5 ± 0.1
β = 0.262 ± 0.005
175
180
190
185
195
200
-1
2
TC = 199.4 ± 0.3
γ = 0.976 ± 0.012
4
50
χ0 (x102, Oe.g/emu)
64
Ms (emu/g)
4
72
56
60
0
3
50
2
40
1
30
TC = 169.6 ± 0.5 K
γ = 0.990 ± 0.082
TC = 170.0 ± 0.1 K
β = 0.320 ± 0.009
155
160
165
170
175
180
0
185
T (K)
Fig. 3. (Color online) Ms(T) and χ 0À 1 ðTÞ data fitted to Eqs. (1) and (2) for La0.7Ca0.3Mn1 À xNixO3 with (a) x ¼0.09, (b) x¼ 0.12, and (c) x ¼0.15.
x104
12
186 K
x = 0.09
β = 0.171
γ = 0.976
8
4
214 K
0
0
200
400
M1/β (x106, emu/g)1/β
1
2
3
4
5
6
7
8
9
10
11
12
13
14
15
16
17
18
19
20
21
22
23
24
25
26
27
28
29
30
31
32
33
34
35
36
37
38
39
40
41
42
43
44
45
46
47
48
49
50
51
52
53
54
55
56
57
58
59
60
61
62
63
64
65
66
T.-L. Phan et al. / Solid State Communications ∎ (∎∎∎∎) ∎∎∎–∎∎∎
4
174 K
0.6
β = 0.262
γ = 0.978
20
10
0
600
200 K
0
200
400
600
800
152 K x = 0.15
β = 0.320
γ = 0.990
0.4
180 K
0.2
0.0
x = 0.12
30
0
200
400
600
800
1000
(H/M)1/γ (Oe.g/emu)1/γ
Fig. 4. (Color online) MAPs of M1/β versus (H/M)1/γ with the critical exponents obtained for La0.7Ca0.3Mn1 À xNixO3 with (a) x ¼0.09, (b) x¼ 0.12 and (c) x ¼ 0.15.
12 kOe for x ¼0.09, 0.12 and 0.15, respectively. At the fields lower
than HL, there may be rearrangement of magnetic domains, the
effect due to the uncertainty in the calculation of demagnetization
factor, and/or the persistence of the FOMT (particularly for the
samples with x ¼0.09 and 0.12) [12,30]. Unexpected errors for
critical values can thus be occurred, leading to the scattering of the
M–H data points (at the fields lower than HL) from the universal
curves [5,12], as can be seen in Fig. 5. For the exponent δ, its value
can be obtained from fitting the isotherms at T ¼TC to Eq. (3).
Basically, the δ values determined from Eq. (3) would be equal to
those calculated from the Widom relation δ ¼1 þ γ/β [21]. In
our work, δ values are about 6.7, 4.7, and 4.1 for x ¼0.09, 0.12
and 0.15, respectively. Clearly, with increasing Ni concentration in
La0.7Ca0.3Mn1 À xNixO3, there is a shifting tendency of the exponent
values (β, γ and δ) towards those of the MFT (with β ¼0.5, γ ¼1 and
δ ¼ 3). This is tightly related to the FOMT–SOMT transformation.
The better applicability of the MAP method has been found for the
samples with high-enough Ni concentrations as x 40.12. We
believe that the substitution of Ni ions into the Mn site not only
changes structural parameters of 〈Mn–O〉 and 〈Mn–O–Mn〉, but
also leads to the additional presence of anti-FM interactions
related to Ni ions (for example, super-exchange pairs of Ni2 þ
–Ni2 þ , Ni3 þ –Ni3 þ , Ni4 þ –Ni4 þ , and/or Ni2 þ ,3 þ ,4 þ –Mn3 þ ,4 þ )
beside pre-existing anti-FM interaction pairs of Mn3 þ –Mn3 þ and
Please cite this article as: T.-L. Phan, et al., Solid State Commun (2014), />
67
68
69
70
71
72
73
74
75
76
77
78
79
80
81
82
83
84
85
86
87
88
89
90
91
92
93
94
95
96
97
98
99
100
101
102
103
104
105
106
107
108
109
110
111
112
113
114
115
116
117
118
119
120
121
122
123
124
125
126
127
128
129
130
131
132
T.-L. Phan et al. / Solid State Communications ∎ (∎∎∎∎) ∎∎∎–∎∎∎
102
102
M/|ε|β (emu/g)
1
2
3
4
5
6
7
8
9
10
11
12
13
14
15
16
17
18
19
20
21
22
23
24
25
26
27
28
29
30
31
32
33
34
35
36
37
38
39
40
41
42
43
44
45
46
47
48
49
50
51
52
53
54
55
56
57
58
59
60
61
62
63
64
65
66
101
100
104
5
101
100
105
106
107
104
102
101
100
104
105
106
107
H/|ε|β+γ (Oe)
Fig. 5. (Color online) Scaling performance of M/|ε|β versus H/|ε|β þ γ in the log scale at temperatures To TC and T 4TC for La0.7Ca0.3Mn1 À xNixO3 with (a) x¼ 0.09, (b) x¼ 0.12 and
(c) x ¼ 0.15. The insets plot the same data in the linear scale.
Mn4 þ –Mn4 þ . These factors act as fluctuations, reduce the strength
of Mn3 þ –Mn4 þ FM interactions (which thus reduce the magnetization and TC values), and influence the phase transition as well.
Comparing with the theoretical models [21,29], one can see
that the values of γ ( ¼0.976–0.990) are quite stable, demonstrating the complete PM state in the samples at temperatures above
TC. For the FM region, however, β ¼ 0.262 for x ¼0.12 is close to that
expected for the T-MFT (β ¼ 0.25). This sample thus exhibits
tricriticality associated with the crossover of first- and secondorder phase transitions. Similar results were also found in some
manganites [9,12,29]. A smaller value of β ¼ 0.171 for x¼0.09
reveals this sample lying in the region close to the crossover,
where the FOMT is still persistent. It is also known that the
MAP application for the materials with the presence of the FOMT
makes of their exponent values different from those expected for
the theoretical models, such as the cases of La0.7Ca0.3MnO3 and
La0.9Te0.1MnO3 [5,31]. With a higher Ni-doping content of x ¼0.15,
one can see that its β value (¼ 0.320) is close to that expected for
the 3D Ising model (β ¼0.325), indicating the existence of shortrange FM order associated with the magnetic inhomogeneity, and
FM/anti-FM mixed phase. It comes to our attention that the β
value tends to shift towards the values of the Heisenberg model
and MFT if Ni content (x) in La0.7Ca0.3Mn1 À xNixO3 is higher than
0.15. For inhomogeneous ferromagnets, the critical values usually
depend on the magnetic field ranges employed for MAP analyses
because of a significant field-induced change in the nature and
range of the FM interaction [9,32]. Performing a renormalization
group analysis of exchange-interaction systems, Fisher et al. found
the exponent values depending on the range of exchange interaction characterized by J(r)¼ 1/rd þ s (where d, and s are the dimension of the system, and the interaction range, respectively) [33].
The MFT exponents are valid for s o 1/2 while the Heisenberg
ones are valid for s 4 2. The exponents belong to other universality classes (such as the T-MFT and 3D Ising models) if 1/2 o s o2,
which can be the case taking place in our samples.
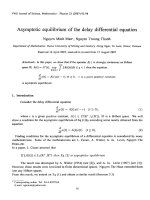
Together with assessing the critical behaviors of La0.7Ca0.3Mn1À xNixO3 samples, we have also considered the magnetic-entropy
change (ΔSm) and its field dependence, as shown in Fig. 6. At a
given temperature for each sample, À ΔSm increases with increasing
H. Around TC, À ΔSm(T) curves reach the maxima, |ΔSmax|. The
|ΔSmax| values determined for x¼0.09, 0.12, and 0.15 in the field
H¼ 40 kOe are about 7.1, 5.2, and 3.4 J kg À 1 K À 1, respectively, which
are smaller than those obtained from the parent compound [7].
Though the Ni doping reduces the |ΔSmax| value, the linewidth of the
À ΔSm(T) curves become broadened due to the FOMT–SOMT transformation, enhancing the refrigerant capacity (RC). Particularly, at TC
the H dependences of |ΔSmax| can be well described by a power law
of |ΔSmax|pHn [24], where values n¼0.55, 0.68, and 0.77 for x¼0.09,
0.12, and 0.15, respectively. These values are different from those
(n¼0.33, 0.41, and 0.48 for x¼ 0.09, 0.12, and 0.15, respectively)
calculated from the relation n¼1þ(β À 1)/(β þ γ) [23]. As shown in
Ref. [34], n is known as a function of T, H and |ΔSm|, which can also be
obtained from the relation n¼d ln|ΔSm|/d ln H. Depending on the
variation of these parameters, n would be different. It reaches the
minimum at temperatures in the vicinity of TC [23]. We believe that a
large deviation of the n values obtained from two routes is because
the exponent values β and γ determined from the MAP method are
much different from those expected for the MFT. In other words,
La0.7Ca0.3Mn1À xNixO3 samples are not conventional ferromagnets.
There are the magnetic inhomogeneity, and the existence of FOMT
and/or SOMT properties (particularly for two samples with x¼0.09
and 0.12 lying in the crossover region). For conventional ferromagnets obeyed the MFT, n is equal to 2/3. However, experimental
results based on the framework of the SOMT (MFT) theory for
inhomogeneous ferromagnets, like the present cases, introduce the
values n different from 2/3 [23,24].
4. Conclusions
We studied the critical behavior and related physical properties
of manganites La0.7Ca0.3Mn1 À xNixO3 (x ¼0.09, 0.12 and 0.15)
around their TC values. Detailed analyses of the M–H–T data based
on the MAP method revealed the stability in value of γ E1,
demonstrating the real PM behavior above TC in the samples.
However, in the FM region, experimental results revealed the
Please cite this article as: T.-L. Phan, et al., Solid State Commun (2014), />
67
68
69
70
71
72
73
74
75
76
77
78
79
80
81
82
83
84
85
86
87
88
89
90
91
92
93
94
95
96
97
98
99
100
101
102
103
104
105
106
107
108
109
110
111
112
113
114
115
116
117
118
119
120
121
122
123
124
125
126
127
128
129
130
131
132
8
8
6
6
4
4
40 kOe
|ΔSmax| α Hn
(with n = 0.55)
30 kOe
2
2
20 kOe
0
10 kOe
190
200
210
220
230
0
10
20
30
40
6
6
4
4
40 kOe
|ΔSmax| α Hn
(with n = 0.68)
30 kOe
2
20 kOe
0
170
2
0
10 kOe
180
190
200
210
|ΔSmax| (Jkg-1K-1)
0
-ΔSm (J.kg-1.K-1)
1
2
3
4
5
6
7
8
9
10
11
12
13
14
15
16
17
18
19
20
21
22
23
24
25
26
27
28
29
30
31
32
33
34
35
36
37
38
39
40
41
42
43
44
45
46
47
48
49
50
51
52
53
54
55
56
57
58
59
60
61
62
63
64
65
66
T.-L. Phan et al. / Solid State Communications ∎ (∎∎∎∎) ∎∎∎–∎∎∎
6
0
10
20
30
40
4
3
3
40 kOe
2
2
30 kOe
|ΔSmax| α Hn
(with n = 0.77)
20 kOe
1
1
0
10 kOe
150
160 170
180
190
0
10
T (K)
20
30
40
H (kO e)
Fig. 6. (Color online) À ΔSm(T) curves with the fields H¼ 10, 20, 30 and 40 kOe, and field dependences of |ΔSmax| at TC fitted to a power law |ΔSmax| pHn for
La0.7Ca0.3Mn1 À xNixO3 with (a, b) x¼ 0.09, (c, d) x¼ 0.12 and (e, f) x ¼ 0.15.
sample x ¼0.15 undergoing the SOMT. Its β exponent is close to
that expected for the 3D Ising model. For the samples with lower
Ni-doping contents, their exponents β ( ¼0.171 and 0.262 for
x ¼0.09 and 0.12, respectively) indicate the samples exhibiting
tricriticality associated with the FOMT–SOMT transformation; in
which, the FOMT is dominant at the fields lower than HL. Shortrange FM interactions are thus found in all the samples. Interestingly, around TC, field dependences of |ΔSmax| can be described by
a power law |ΔSmax| p Hn. The n values (¼ 0.55–0.77) obtained
from the power-law fitting are higher than those (n¼ 0.33–0.48)
calculated from the relation n ¼1 þ(β À1)/(β þ γ). We believe that
the deviation of the n values obtained from two ways is related to
the using of the approximate MFT (the MAP method) for unconventional ferromagnets (with the existence of the magnetic
inhomogeneity, and FOMT and/or SOMT properties), where the
exponent values β and γ determined are much different from
those expected for the MFT.
Acknowledgment
This research was supported by the Converging Research
Center Program through the Ministry of Science, ICT and Future
Planning, Korea (2013K000405).
References
[1] A.P. Ramirez, J. Phys.: Condens. Matter 9 (1997) 8171.
[2] A.J. Millis, B.I. Shraiman, R. Mueller, Phys. Rev. Lett. 77 (1996) 175.
[3] J. Mira, J. Rivas, L.E. Hueso, F. Rivadulla, M.A. Lopez Quintela, J. Appl. Phys. 91
(2002) 8903.
[4] A. Berger, G. Campillo, P. Vivas, J.E. Pearson, S.D. Bader, E. Baca, P. Prieto,
J. Appl. Phys. 91 (2002) 8393.
[5] H.S. Shin, J.E. Lee, Y.S. Nam, H.L. Ju, C.W. Park, Solid State Commun. 118 (2001)
377.
[6] S. Taran, B.K. Chaudhuri, S. Chatterjee, H.D. Yang, S. Neeleshwar, Y.Y. Chen,
J. Appl. Phys. 98 (2005) 103903.
[7] P. Lampen, N.S. Bingham, M.H. Phan, H. Kim, M. Osofsky, A. Pique, T.L. Phan,
S.C. Yu, H. Srikanth, Appl. Phys. Lett. 102 (2013) 062414.
[8] J. Mira, J. Rivsa, F. Rivadulla, C.V. Vazquez, M.A.L. Quintela, Phys. Rev. B 60
(1999) 2998.
[9] P. Zhang, P. Lampen, T.L. Phan, S.C. Yu, T.D. Thanh, N.H. Dan, V.D. Lam,
H. Srikanth, M.H. Phan, J. Magn. Magn. Mater. 348 (2013) 146.
[10] D.T. Hanh, M.S. Islam, F.A. Khan, D.L. Minh, N. Chau, J. Magn. Magn. Mater. 310
(2007) 2826.
[11] N. Moutis, I. Panagiotopoulos, M. Pissas, D. Niarchos, Phys. Rev. B 59 (1999) 1129.
[12] M.H. Phan, V. Franco, N.S. Bingham, H. Srikanth, N.H. Hur, S.C. Yu, J. Alloys
Compd. 508 (2010) 238.
[13] M.H. Phan, S.B. Tian, S.C. Yu, A.N. Ulyanov, J. Magn. Magn. Mater. 256 (2003)
306.
[14] T.D. Thanh, L.H. Nguyen, D.H. Manh, N.V. Chien, P.T. Phong, N.V. Khiem,
L.V. Hong, N.X. Phuc, Physica B 407 (2012) 145.
[15] S.H. Hua, P.Y. Zhang, H.F. Yang, S.Y. Zhang, H.L. Ge, J. Magn. 18 (2013) 34.
[16] P.J. Lampen, Y.D. Zhang, T.L. Phan, P. Zhang, S.C. Yu, H. Srikanth, M.H. Phan,
J. Appl. Phys. 112 (2012) 113901.
Please cite this article as: T.-L. Phan, et al., Solid State Commun (2014), />
67
68
69
70
71
72
73
74
75
76
77
78
79
80
81
82
83
84
85
86
87
88
89
90
91
92
93
94
95
96
97
98
99
100
101
102
103
104
105
106
107
108
109
110
111
112
113
114
115
116
117
118
119
120
121
122
123
124
125
126
127
128
129
130
131
132
T.-L. Phan et al. / Solid State Communications ∎ (∎∎∎∎) ∎∎∎–∎∎∎
1
2
3
4
5
6
7
8
9
10
11
12
[17] Y.D. Zhang, T.L. Phan, S.C. Yu, J. Appl. Phys. 111 (2012) 07D703.
[18] S. Rößler, U.K. Rößler, K. Nenkov, D. Eckert, S.M. Yusuf, K. Dörr, K.-H. Müller,
Phys. Rev. B 70 (2004) 104417.
[19] L.E. Hueso, P. Sande, D.R. Miguéns, J. Rivas, F. Rivadulla, M.A. López-Quintela,
J. Appl. Phys. 91 (2002) 9943.
[20] A. Arrott, J.E. Noakes, Phys. Rev. Lett. 19 (1967) 786.
[21] H.E. Stanley, Introduction to Phase Transitions and Critical Phenomena, Oxford
University Press, London, 1971.
[22] S.K. Banerjee, Phys. Lett. 12 (1964) 16.
[23] V. Franco, J.S. Blázquez, A. Conde, Appl. Phys. Lett. 89 (2006) 222512.
[24] H. Oesterreicher, F.T. Parker, J. Appl. Phys. 55 (1984) 4336.
[25] J. Mira, J. Rivas, M. Vazquez, J.M.G. Beneytez, J. Arcas, R.D. Sanchez, M.A.
S. Rodriguez, Phys. Rev. B 59 (1999) 123.
7
[26] J.M.D. Coey, Magnetism and Magnetic Materials, Cambridge University Press, Q4 13
2010.
14
[27] A. Arrott, Phys. Rev. 108 (1957) 1394.
15
[28] S. Mukherjee, P. Raychaudhuri, A.K. Nigam, Phys. Rev. B 61 (2000) 8651.
16
[29] D. Kim, B. Revaz, B.L. Zink, F. Hellman, J.J. Rhyne, J.F. Mitchell, Phys. Rev. Lett. 89
(2002) 227202.
17
[30] N. Khan, P. Mandal, K. Mydeen, D. Prabhakaran, Phys. Rev. B 85 (2012) 214419.
18
[31] J. Yang, Y.P. Lee, Y. Li, Phys. Rev. B 76 (2007) 054442.
19
[32] T.L. Phan, Y.D. Zhang, P. Zhang, T.D. Thanh, S.C. Yu, J. Appl. Phys. 112 (2012)
093906.
20
[33] M.E. Fisher, S.K. Ma, B.G. Nickel, Phys. Rev. Lett. 29 (1972) 917.
21
[34] A. Biswas, T.L. Phan, N.H. Dan, P. Zhang, S.C. Yu, H. Srikanth, M.H. Phan, Appl.
22
Phys. Lett. 103 (2013) 162410.
23
Please cite this article as: T.-L. Phan, et al., Solid State Commun (2014), />