DSpace at VNU: Dynamics of cyanobacteria and cyanobacterial toxins and their correlation with environmental parameters in Tri An Reservoir, Vietnam
Bạn đang xem bản rút gọn của tài liệu. Xem và tải ngay bản đầy đủ của tài liệu tại đây (774.27 KB, 14 trang )
699
© IWA Publishing 2016 Journal of Water and Health
|
14.4
|
2016
Dynamics of cyanobacteria and cyanobacterial toxins and
their correlation with environmental parameters in Tri An
Reservoir, Vietnam
Thanh-Son Dao, Jorge Nimptsch and Claudia Wiegand
ABSTRACT
This study evaluates the water quality from Tri An Reservoir, a drinking water supply for
several million people in southern Vietnam, in terms of cyanobacterial biomass and their potent
toxins, microcystins (MCs). Cyanobacteria, their toxins and environmental parameters were
monitored monthly for 1 year (April 2008–March 2009) at six stations covering a transect
through the reservoir. Dynamics of cyanobacterial abundance in relation to cyanobacterial biomass,
toxins and environmental factors were investigated. Environmental variables from Tri An Reservoir
favored algal and cyanobacterial development. However, cyanobacterial biomass and proportion
varied widely, influenced by physical conditions, available nutrients and nutrient competition among
the phytoplankton groups. Cyanobacterial biomass correlated slightly positively to temperature, pH
and biochemical oxygen demand (BOD5), but negatively to total inorganic nitrogen concentrations.
During most of the sampling times, MC concentrations in the reservoir were quite low ( 0.07 μg LÀ1
MC-LR equivalent), and presented a slight positive correlation to BOD5, total nitrogen:total
phosphorus ratio and cyanobacterial biomass. However, in cyanobacterial scum samples, which now
and then occurred in the reservoir, MC concentrations reached up to 640 μg gÀ1 DWÀ1. The
occurrence of MC in the reservoir poses a risk to local residents who use the water daily for domestic
purposes.
Key words
| cyanobacterial biomass, environmental factors, microcystins, phytoplankton
Thanh-Son Dao (corresponding author)
Environmental Engineering and Management
Research Group,
Ton Duc Thang University,
19 Nguyen Huu Tho Street, District 7,
Ho Chi Minh City,
Vietnam;
Faculty of Environment and Labour Safety,
Ton Duc Thang University,
Ho Chi Minh City,
Vietnam;
and
Ho Chi Minh City University of Technology,
268 Ly Thuong Kiet Street, District 10,
Ho Chi Minh City,
Vietnam
E-mail:
Jorge Nimptsch
Universidad Austral de Chile, Instituto de Ciencias
Marinas y Limnológicas,
Casilla 567,
Valdivia,
Chile
Claudia Wiegand
University Rennes 1,
UMR 6553 ECOBIO, Campus de Beaulieu,
35042 Rennes Cedex,
France
INTRODUCTION
As primary producers, algae and cyanobacteria play a key
Marinho & de Moraes Huszar ). Many dissolved chemi-
role in aquatic ecosystems. Their occurrence is defined by
cals, including nitrogen and phosphorus compounds, closely
aquatic environmental factors, but their mass proliferation
relate to the development of algae and cyanobacteria, as
also reacts to shifts in these factors. Light intensity and temp-
different phytoplankton species have different chemicals
erature in freshwater lakes and reservoirs regulate the
and nutrient requirements for their optimal growth (Sivonen
photosynthesis of phytoplankton (Wetzel ) so that these
; Wetzel ; Sabour et al. ). For diatoms’ abun-
two factors could shape the distribution as well as abundance
dance, silica is essential (Tilman et al. ). The ratio of
of phytoplankton temporally and spatially (Zhang & Prepas
total nitrogen to total phosphorus by weight (TN:TP) influ-
; Marinho & de Moraes Huszar ). Other physical
ences
factors such as turbulence, pH, and water current also have
species composition is reduced when this ratio exceeds
an influence on phytoplankton communities (Wetzel ;
29:1 (Smith ), while low ratios potentially favor blooms
doi: 10.2166/wh.2016.257
the
phytoplankton
community.
Cyanobacterial
700
T.-S. Dao et al.
|
Dynamics of cyanobacteria and cyanobacterial toxins in Tri An Reservoir, Vietnam
of heterocystous cyanobacteria (Havens et al. ), which
Journal of Water and Health
|
14.4
|
2016
MATERIALS AND METHODS
are able to fix atmospheric dinitrogen (Bothe ) to
enhance their competition over other phytoplankton in
Study area and sample collection
case of inorganic nitrogen depletion in the water.
Freshwater quality is decreasing due to intensification of
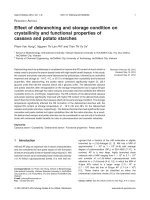
Tri An Reservoir is about 70 km northeast from Ho Chi
adjacent agriculture and pollution by anthropogenic activi-
Minh City. It has a surface area of 323 km2, is around
ties throughout the world. In many reservoirs and lakes
50 km long, 2–15 km wide, with mean and maximum
these phenomena induced eutrophication leading to mass
depths of 8.4 m and 27 m, respectively (Figure 1). It has a
proliferation of cyanobacteria (Carmichael ), of which
total volume of 2.7 billion m3 and an elevation approxi-
25–75% was estimated to be toxic (Sivonen & Jones ;
mately 62 m above sea level at its highest capacity. The
Zurawell et al. ). In freshwater bodies, toxic cyanobac-
annual rainfall and average temperature in the study area
teria are of concern owing to their detrimental effects on
are 2,400 mm and 25.4 C, respectively (Vietnam Ministry
aquatic organisms and notorious incidents of human illness
of Science Technology & Environment ). Receiving
in relation to the toxins (Zurawell et al. ). Cyanobacter-
water from Dong Nai and La Nga Rivers, Tri An is a reser-
ial toxins (e.g. microcystins (MCs)) have been recorded
voir used for multiple purposes such as hydroelectric power,
throughout the world and cause both acute and chronic toxi-
flood control, domestic and industrial water supply, fisheries
cities to animals and human (Metcalf & Codd ). Chronic
and irrigation of agricultural fields. In addition to the agri-
W
toxicity is of concern to the public due to the association
culture upstream, both fish caging and wastewater from
with cancer (Hernandez et al. ). To reduce the risk of
the sugar factory (located at the inflow of La Nga River)
human fatalities, the World Health Organization established
have led to nutrient enrichment supporting algal growth
a guideline value of maximum 1 μg microcystin-LR (MC-LR)
and cyanobacterial development in the reservoir.
(or equivalents of other MC forms) per liter of drinking
water (WHO ).
In Tri An Reservoir, samples of algae, cyanobacteria and
MC were taken monthly at six sites (TA1–TA6) at the water sur-
In Vietnam, toxic cyanobacteria, cyanobacterial blooms
face from April 2008 to March 2009, with the exception of
and their toxins were only recently reported in some lakes
January 2009 (Figure 1). Physical and chemical factors were
and reservoirs (Hummert et al. ; Nguyen et al. ;
also measured at the same six sites and times, except in April
Duong et al. ). Tri An Reservoir in southern Vietnam,
2008. Qualitative samples of algae and cyanobacteria were
where toxic cyanobacteria scum has been observed (Dao
taken with a conical net (25 μm), and quantitative samples
et al. ), is directly and indirectly supplying drinking
were taken at the surface and fixed with neutral Lugol solution
water for millions of local residents. Nevertheless, cyanobac-
(Sournia ) in the field. Surface water samples for nutrients
terial abundance dynamics and cyanobacterial toxins have
(inorganic nitrogen, phosphorus), BOD5 and MC analyses were
not been monitored in the reservoir. Despite the WHO
collected, kept on ice in the field until analyzed in the labora-
guideline of 1 μg LÀ1 for drinking water, cyanobacterial
tory the same day, or filtered and stored at –70 C until analysis.
W
toxins are not yet considered as important factors for
water quality in Vietnam. Processes for complete removal
of cyanobacterial toxins are not included in drinking water
Physical and chemical analysis
purification processes in Vietnam. Hence, local people
may be facing chronic health risks or hazards caused by
Physical and chemical factors of surface water were
the toxins via daily domestic use. Therefore, in this study,
measured in situ including pH (Metrohm 744), turbidity
monitoring of parameters such as temperature, pH, turbid-
(Hach DR/2010), conductivity and TDS (WTW LF197
ity, biochemical oxygen demand (BOD5), conductivity,
multi-detector), temperature and dissolved oxygen (DO)
total dissolved solids (TDS), nutrients, phytoplankton, and
(WTW Oxi197i multi-detector). Nutrients in surface water
in particular cyanobacterial abundance and toxin concen-
were analyzed colorimetrically with a spectrophotometer
tration in the waters of Tri An Reservoir was implemented.
(Hach DR/2010) and BOD5 was determined by the
701
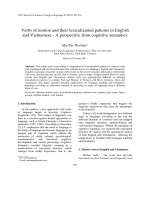
Figure 1
T.-S. Dao et al.
|
|
Dynamics of cyanobacteria and cyanobacterial toxins in Tri An Reservoir, Vietnam
Journal of Water and Health
|
14.4
|
2016
Map of Tri An Reservoir with sampling sites (TA1–TA6) for the monitoring of environmental factors, phytoplankton and cyanobacterial toxins.
difference of DO concentrations in samples after five days
() for diatoms, and other taxonomy books for green,
according to Standard Methods (). The detection
golden and yellow algae, dinoflagellates and euglenoids.
limits of nutrient parameters were 0.02 (nitrate), 0.002
For counting, 10 mL of sample was settled overnight in a tub-
(nitrite), 0.04 (ammonium), 0.06 (total Kjeldahl nitrogen)
ular counting chamber (Utermöhl-chamber; KC Denmark
and 0.05 mg L
À1
(for both orthophosphate and TP).
A/S). Algae and cyanobacteria were counted in an inverted
microscope. The biomass of cells and/or trichomes was cal-
Algal and cyanobacterial identification, counting and
culated based on geometrical formulae, and the algal
biomass estimation
biomass was estimated according to Olrik et al. ().
Phytoplankton was observed at 400–800 × magnification
MC determination
(Olympus BX51 microscope). Identification was based on
morphology following the system of Komárek & Anagnostidis
One liter of water was filtered on GF/C filters (Whatman). The
(, , ) for cyanobacteria, Krammer & Lange-Bertalot
filters were dried at 50 C overnight and kept at –70 C prior to
W
W
702
T.-S. Dao et al.
|
Dynamics of cyanobacteria and cyanobacterial toxins in Tri An Reservoir, Vietnam
Journal of Water and Health
|
14.4
|
2016
MC determination. Extraction of samples was prepared accord-
between 6.0 and 7.6 (Table 1), being lower in October–
ing to Fastner et al. () with minor modification. Briefly, the
December 2008. Conductivity values were 31–66 μS cmÀ1,
field samples on GF/C filters were homogenized and firstly
quite similar at each sampling time at most sites, except
extracted overnight in 70% MeOH (Carl Roth) containing 5%
site TA6. Water turbidity ranged from 2 to 305 NTU (nephe-
acetic acid (Merck) and 0.1% trifluoroacetic acid (TFA;
lometric turbidity unit), varying only slightly among sites
Merck) followed by 3 × 60 minutes in 90% MeOH containing
TA1–TA4 during September 2008–March 2009, but more
5% acetic acid and 0.1% TFA with 30 seconds sonication
variable in May–August 2008 and higher at sites TA5 and
during the last extraction. After centrifugation (4,500 rpm,
TA6. TDS values ranged from 17 to 35 mg LÀ1. DO values
W
10 min, 4 C), the supernatants of all extraction steps from
W
each sample were pooled, dried at 35 C, re-dissolved in
were in the range 6–8.2 mg LÀ1 with little change among
the sites during the monitoring. The BOD5 in the water com-
0.5 mL MeOH (100%) and centrifuged at 14,000 rpm, 1 C
monly ranged from 0.5 to 3 mg oxygen LÀ1 but increased to
for 10 min. MC in the supernatant was analyzed according to
7 mg oxygen LÀ1 at site TA4 in May 2008.
W
Pflugmacher et al. () by high performance liquid chromato-
In the reservoir, maximum concentrations of ammonium,
graphy (HPLC; Waters Alliance, Eschborn) on a reverse phase
nitrite and nitrate were 0.12 mg LÀ1, 0.108 mg LÀ1 and
column (RP18; 5 μM LiChrospher 100) by UV and photodiode
0.78 mg LÀ1, respectively (Table 1). The nitrate concentrations
array detection between 200 and 300 nm. Separation of 80 μL
were higher from June to August 2008 and lowest in March
W
injection volume was achieved at 40 C by a gradient of Milli-Q
2009 and, correspondingly, nitrite increased from June to
water and acetonitrile (ACN; Rathburn, Walkerburn, UK),
August 2008 and decreased afterwards. Concentrations of
both enriched with 0.1% (v/v) TFA at a flow rate of 1 mL
nitrate and nitrite did not vary much between the sites, except
minÀ1, starting at 35% ACN, increasing to 55% ACN within
site TA6. Concentrations of total Kjeldahl nitrogen (TKN)
15 min, cleaning at 100% ACN and 10 min equilibration to
ranged from 0.06 to 1.637 mg LÀ1, except those at sites TA2
start conditions. MC standard, MC-LR, was purchased from
(May 2008) and TA3 (August 2008) which were higher, 2.15
Axxora (Germany).
mg LÀ1 and 2.17 mg LÀ1, respectively. The TKN concentration
varied among the sampling sites; TKN was higher in August
2008 and lower in March 2009. TN (defined as the sum of
Statistical analysis
TKN, nitrite and nitrate) in Tri An Reservoir ranged from 0.25
Principal component analysis (PCA; Statistica 7.0, StatSoft)
to 2.63 mg LÀ1 varying among the sites and sampling times
and the Pearson correlation test (SPSS, version 16) were
(Table 1), higher in July, August and November 2008 and
implemented for examination of relationships between
lower in May 2008 and March 2009. Soluble phosphorus con-
cyanobacterial biomass or MC concentration and environ-
centration of up to 0.1 mg LÀ1 was detected only at site TA6,
mental parameters. The relationship between chlorophyll
in July, September and October 2008; otherwise it was below
and phosphorus concentration in Tri An Reservoir was
detection level. Concentrations of TP ranged from 0.05 to
equated according to the equation reported by Reynolds
0.33 mg LÀ1. Those at the sites TA1–TA4 were similar, a little
(): log[chlorophyll] ¼ 0.91 × log[TP]–0.435.
higher at site TA5 but more varied at site TA6 with the incoming
river (Table 1). The concentrations of TP were higher from June
to August 2008, but decreased from October to December 2008.
RESULTS
The TN:TP ratio values varied from 4.5:1 to 30:1 except one
value of 49:1 at site TA2, in May 2008. The ratio values varied
Chemical and physical parameters of water samples
W
Temperature of surface water ranged from 25 to 35 C,
among the sampling sites and during the monitoring (Table 1).
Phytoplankton composition and biomass
higher in September 2008 and lower in December 2008,
with little changes among the sampling sites and times of
During the monitoring period in Tri An Reservoir, 197 species
monitoring. The pH of water in Tri An Reservoir ranged
of phytoplankton were recorded belonging to seven classes,
703
Table 1
T.-S. Dao et al.
|
|
Dynamics of cyanobacteria and cyanobacterial toxins in Tri An Reservoir, Vietnam
Journal of Water and Health
|
14.4
|
2016
Physical and chemical parameters in Tri An Reservoir from May 2008 to March 2009
Sampling site
Parameter
TA1 min–max mean
TA2 min–max mean
TA3 min–max mean
TA4 min–max mean
TA5 min–max mean
TA6 min–max mean
Temperature ( C)
28.3–33.6
30.6
25.3–33.9
29.2
25.7–35.3
28.9
26.6–33.9
30.1
26.4–31
28.8
27.4–31.1
29.5
pH
6.5–7.4
6.8
6.0–7.5
6.9
6.2–7.5
6.9
6.4–7.4
6.9
6.4–7.4
6.9
6.4–7.6
6.9
Conductivity (μS/cm)
32–49
41
31–48
41
34–50
41
34–47
40
34–50
41
34–66
53
Turbidity (NTU)
4–78
25
2–79
28
2–134
44
6–122
39
8–182
81
11–305
114
TDS (mg/L)
18–25
21.7
17–26
21.8
19–27
22
19–25
21.6
18–27
22
18–35
28
DO (mg/L)
6.5–7.4
6.9
6–8.2
7.2
6.4–7.9
7
6.3–7.7
7.1
6.3–7.6
7
6.4–7.5
6.9
BOD5 (mg oxygen/L)
0.5–3
1.2
0.5–3
1.5
0.5–3
1.2
0.5–7
1.8
1–2
1.3
1–2
1.8
Ammonium (mg/L)
0.04–0.06
0.046
0.04–0.08
0.045
0.04–0.08
0.047
0.04–0.06
0.044
0.04–0.1
0.058
0.04–0.12
0.069
Nitrate (mg/L)
0.02–0.4
0.24
0.02–0.33
0.21
0.02–0.43
0.24
0.02–0.39
0.22
0.1–0.42
0.28
0.32–0.78
0.5
Nitrite (mg/L)
0.002–
0.047
0.014
0.002–
0.04
0.013
0.002–
0.035
0.015
0.002–
0.04
0.015
0.002–
0.052
0.017
0.007–
0.108
0.039
TKN (mg/L)
0.06–1.18
0.669
0.06–2.15
0.735
0.47–2.17
0.846
0.34–1.40
0.705
0.06–1.5
0.674
0.1–1.637
0.807
TN (mg/L)
0.28–1.12
0.865
0.25–2.24
0.913
0.47–2.63
1.099
0.44–1.63
0.896
0.46–1.5
0.893
0.61–1.93
1.299
PO3–
4 (mg/L)
BDL
BDL
BDL
BDL
BDL
0.05–0.1
0.56
TP (mg/L)
0.05–0.09
0.069
0.05–0.1
0.07
0.05–0.13
0.076
0.05–0.14
0.08
0.05–0.2
0.104
0.05–0.33
0.142
TN:TP ratio
6–22:1
13:1
5–22(49):1
14:1
6–25:1
15:1
5–20:1
12:1
5–25:1
10:1
5–30:1
12:1
W
Minima (min), maxima (max) and mean values. TDS, total dissolved solids; DO, dissolved oxygen; BOD5, biochemical oxygen demand (after 5 days); TKN, total Kjeldahl nitrogen; TN, total
nitrogen; PO3–
4 , orthophosphate; TP, total phosphorus; TN:TP, total nitrogen to total phosphorus ratio by weight; BDL, below detection limit (0.05 mg P/L).
Cyanophyceae (cyanobacteria), Chlorophyceae (green algae),
highest at site TA4 followed by TA1, TA2, TA3, TA5 and mini-
Bacillariophyceae (diatoms), Chrysophyceae (golden algae),
mal at site TA6 (Figure 3(a)–3(f)). Diatoms biomass consisted
Xanthophyceae (yellow algae), Euglenophyceae (euglenoids)
mainly of the genera Aulacoseira and Synedra, cyanobacteria
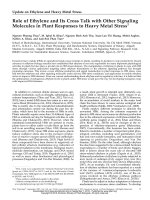
and Dinophyceae (dinoflagellates). Species number of phyto-
consisted of Microcystis and Anabaena, green algae were
plankton assemblages ranged from 28 to 75, of which
mainly from the orders Chlorococcales and desmids, dinofla-
cyanobacteria comprised 9–30% of the total (Figure 2).
gellates consisted mainly of the genera Ceratium and
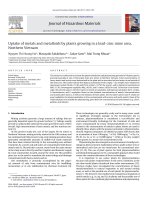
During the monitoring period, the total biomass of phyto-
Peridinium, and euglenoids were from the Trachelomonas
plankton in the reservoir strongly varied, from 0.013 to
and Euglena genera. The proportion of cyanobacterial
À1
7.717 mg L . Its maximal values were recorded in April–
biomass over total phytoplankton biomass ranged from 1 to
May 2008 and February–March 2009. The biomass was
98%. The proportion was higher at sites TA1, TA2, TA3 and
704
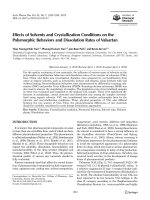
Figure 2
T.-S. Dao et al.
|
|
Dynamics of cyanobacteria and cyanobacterial toxins in Tri An Reservoir, Vietnam
Journal of Water and Health
|
14.4
|
2016
Phytoplankton diversity as number of species in Tri An Reservoir at sites: (a) TA1, (b) TA2, (c) TA3, (d) TA4, (e) TA5 and (f) TA6 throughout the sampling period.
TA5, and lower at sites TA4 and TA6 (Figure 3(g)–3(l)).
in the case of Tri An Reservoir was then equated as log
Generally, the proportion of cyanobacteria increased from
[chlorophyll] ¼ 0.91 × log[TP]–0.499.
May to September 2008. Absolute biomass was lowest at
most sites from August till December 2008 with the exception
MC concentrations
of site TA6, where the opposite phytoplankton development
occurred with maxima in December 2008 (Figure 3(a)–3(f)).
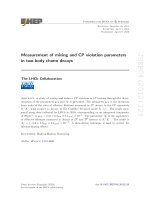
The cell-bound MC concentration from the reservoir
Cyanobacterial biomass during the monitoring period
reached up to 0.072 μg LÀ1. MC was detected at low concen-
À1
ranged from 0.009 to 0.834 mg L . The biomass was higher
tration at some sites in the reservoir (Figure 4(a)–4(f)).
at the sites TA1–TA4 and minimal at site TA6. After a peak
However, in most of the samples the concentration was
development in April–May at four out of six stations, phyto-
below the detection limit of HPLC-UV.
plankton biomass was reduced (Figure 3). Generally,
biomass of cyanobacteria was mostly attained from Chroo-
Correlation between cyanobacterial biomass, toxins
coccales and Nostocales (Figure 4(a)–4(d)).
and environmental factors
In Tri An Reservoir, the annual mean concentrations of
TP and chlorophyll were 0.09017 mg LÀ1 and 2.356 μg LÀ1,
The PCA indicated that cyanobacteria biomass seemed to be
respectively. The relationship between TP and chlorophyll
positively correlated with temperature, pH and MC
705
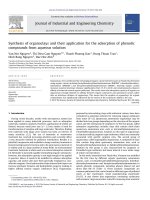
Figure 3
T.-S. Dao et al.
|
|
Dynamics of cyanobacteria and cyanobacterial toxins in Tri An Reservoir, Vietnam
Journal of Water and Health
|
14.4
|
2016
Spatial and temporal variation of phytoplankton biomass and proportion in Tri An Reservoir: (a)–(f) phytoplankton biomass at sites TA1–TA6, respectively (note: different scales
of phytoplankton biomass); (g)–(l) biomass proportion of phytoplankton at sites TA1–TA6, respectively.
706
Figure 4
T.-S. Dao et al.
|
|
Dynamics of cyanobacteria and cyanobacterial toxins in Tri An Reservoir, Vietnam
Journal of Water and Health
|
14.4
|
2016
Spatial and temporal variation of cyanobacterial biomass and MC concentration in Tri An Reservoir: (a)–(f) phytoplankton biomass and MC concentration at sites TA1–TA6,
respectively (note: different scales of cyanobacterial biomass).
concentration, and negatively correlated with total inor-
DISCUSSION
ganic nitrogen (Figure 5). The Pearson correlation test
showed that cyanobacterial biomass correlated positively
Chemical and physical parameters
with temperature (r ¼ 0.305; p < 0.05), pH (r ¼ 0.364; p <
0.01), DO (r ¼ 0.290; p < 0.05), BOD5 (r ¼ 0.494; p < 0.01),
Tri An Reservoir is a tropical water body, hence the tempera-
but negatively with total inorganic nitrogen (r ¼ – 0.358;
ture does not vary much diurnally and over the seasons.
p < 0.01) among the studied environmental parameters. In
Temperature ranged within the algal and cyanobacterial opti-
contrast, MC concentration only had a positive correlation
mum; hence conditions were favorable for phytoplankton
with BOD5 (r ¼ 0.408; p < 0.01), TN:TP ratio (r ¼ 0.324;
development (Wetzel ). Neutral and slightly acidic pH
p < 0.01) and cyanobacterial biomass (r ¼ 0.372; p < 0.01)
values during October–December 2008 (Table 1) were
(Table 2).
within the range of those in Nui Coc Reservoir in Vietnam
707
Figure 5
T.-S. Dao et al.
|
|
Dynamics of cyanobacteria and cyanobacterial toxins in Tri An Reservoir, Vietnam
Journal of Water and Health
|
14.4
|
2016
Principal component analysis based on cyanobacterial biomass, toxin concentration and environmental parameters from Tri An Reservoir; T, temperature; DO, dissolved oxygen,
MCs, microcystin concentrations; other abbreviations, please see Table 1.
(Duong et al. ) and in Juturnaiba and Botafogo Reservoirs,
Table 2
|
Correlations between cyanobacterial biomass and/or MC concentration and
environmental variables based on Pearson correlation test
Brazil (Marinho & de Moraes Huszar ; Lira et al. ).
During the rainy season (May–November in southern
Vietnam), the two incoming rivers bring organic and inor-
Cyanobacterial
biomass
MC concentration
ganic matter into the reservoir. Consequently, the water
turbidity strongly increased at sites TA5 and TA6, close to
Variables
r
p
df
r
p
df
Temperature
0.305
*
58
0.053
ns
58
their entry. The other sites (TA1–TA4) were less influenced,
pH
0.364
**
58
0.111
ns
58
and turbidity at these four sites was lower (Table 1). Conduc-
Turbidity
À0.179
ns
58
À0.145
ns
58
tivity and TDS in the reservoir revealed a low trophic state
TDS
À0.078
ns
58
À0.102
ns
58
(Wetzel ). DO concentrations in the waters of the reser-
Conductivity
0.027
ns
58
À0.047
ns
58
voir were high but not saturated. High BOD5 values
DO
0.290
*
58
0.134
ns
58
demonstrated a richness of organic compounds for hetero-
BOD5
0.494
**
58
0.408
**
58
trophic bacterial development. Despite the input of
Total inorganic nitrogen
À0.358
**
58
À0.174
ns
58
organic matter during the rainy season at the reservoir
TN
À0.017
ns
58
0.148
ns
58
entrance it was diluted out in the volume of the reservoir,
TP
À0.118
ns
58
À0.110
ns
58
and may also settle. However, during the dry season, the
TN:TP ratio
0.104
ns
58
0.324
*
58
input via the La Nga River was evident.
0.372
**
58
Cyanobacterial biomass
r, correlation coefficient; *, p < 0.05; **, p < 0.01; ns, not significant (p > 0.05); df, degree
of freedom (n–2).
Variations of total inorganic nitrogen concentrations (and
nitrate as the biggest part of them) were possibly due to the seasonal changes of input via the two rivers. The nitrogen
708
T.-S. Dao et al.
|
Dynamics of cyanobacteria and cyanobacterial toxins in Tri An Reservoir, Vietnam
Journal of Water and Health
|
14.4
|
2016
concentrations in the reservoir fall into the range of meso-
cyanobacteria. This could be explained as: (1) green algae
trophic to eutrophic water characteristics (Wetzel ).
have a higher competition capacity for phosphorus, nitrate
Additionally, fish caging activities and wastewater from a
uptake and light intensity than cyanobacteria; (2) diatoms
sugar factory located at the inflow of La Nga River have con-
have an advantage on energy safety for their frustule develop-
tributed
the
ment over other algal groups; and (3) many cyanobacteria are
concentration of orthophosphate in the reservoir was below
capable of buoyancy and nitrogen fixation, and capturing a
to
the
nutrient
enrichment.
Although
À1
detection limit (0.05 mg L ) for most samples, the TP concen-
broader light spectrum (Huisman & Hulot ; Visser
trations (0.05–0.33 mg LÀ1, Table 1) characterized eutrophic
et al. ). Besides, cyanobacterial dominance is related to
conditions according to Padisak () and Reynolds ().
water stability (Wicks & Thiel ); hence the lowest density
Nitrogen-fixing cyanobacteria are inferior competitors for
was found at the inflowing rivers (TA5, TA6).
phosphorus in comparison to other phytoplankton such as
Phytoplankton biovolume or biomass and phytoplankton
diatoms and green algae (Huisman & Hulot ). The
chlorophyll concentration are correlated in natural water
values of the TN:TP ratio in the reservoir (4.5:1–30:1 (45:1))
bodies (Felip & Catalan ). Besides, chlorophyll content
were mostly below the threshold of 29:1, where cyanobacteria
in phytoplankton biomass was strongly altered by light inten-
co-exist with microalgae and start to dominate phytoplankton
sity, cell size, phytoplankton structure and phosphorus
communities (Smith ). Besides, the structure of other
concentration (Desortova ; Kasprzak et al. ). As Tri
trophic levels (e.g. Cladocera, planktivorous fish) in a water
An Reservoir is located in a tropical region and phytoplank-
body could alter the response of phytoplankton to nutrients
ton samples were collected from the surface water, the light
(Cronberg ), and at the ratio values of TN:TP < 29:1
intensity in the reservoir can be assumed not to be the limiting
many environmental factors (e.g. light availability, tempera-
factor for the chlorophyll alteration during the monitoring
ture, CO2, TN, TP) should be involved in the development
period. In this study we did not measure phytoplankton chlor-
and dominance of cyanobacteria (Smith ).
ophyll concentration. However, assuming that phytoplankton
chlorophyll concentration gains around 0.505% of phytoplankton biomass (Kasprzak et al. ) or about 4.036 ×
Phytoplankton structure and biomass
(biovolume)0.66 (Felip & Catalan ), the annual average
The phytoplankton assemblage in Tri An Reservoir consisted
concentration of phytoplankton chlorophyll in Tri An Reser-
of most major taxonomic groups of freshwater algae and
voir could range from 2.356 μg LÀ1 (calculated according to
cyanobacteria. This record was similar to that in a previous
Felip & Catalan ) to 3.145 μg LÀ1 (calculated according
investigation of phytoplankton in tropical water bodies in
to Kasprzak et al. ).
northern Vietnam (Duong et al. ) and in Malaysia
Kasprzak et al. () reported that the proportion of
(Yusoff & McNabb ). According to the hypothesis of
chlorophyll over total phytoplankton biomass decreased
Smith (), physical and chemical conditions, especially
when the cyanobacterial biomass increased. However, chlor-
the TN:TP values in Tri An Reservoir (Table 1) were suitable
ophyll concentration and biomass of green algae are
for a diverse community of phytoplankton. During the moni-
positively correlated. Varying proportions of golden algae
toring period, cyanobacteria gained around 15% of the
did not influence the chlorophyll to biovolume ratio (Felip
species number of the phytoplankton assemblage. However,
& Catalan ). Although Felip & Catalan () and Kaspr-
this percentage varied at each sampling site, from 9 to 30%
zak et al. () built up relationships between phytoplankton
(Figure 2), with the changing TN:TP ratio and temporal and
biovolume and chlorophyll concentration, Felip & Catalan
spatial alteration of environmental conditions.
() did not include diatoms and cyanobacterial groups in
Total phytoplankton biomass in the reservoir was quite
À1
variable, from 0.013 to 7.717 mg L
their calculation, whereas all main phytoplankton groups
(mean value of
(green algae, diatoms, cyanobacteria, Dinophyceae, Crypto-
0.623 mg LÀ1), decreased in the rainy season and increased
phyceae, etc.) were brought into the equation by Kasprzak
in the dry season. In the total biomass, biomass of green
et al. (). Phytoplankton abundance in Tri An Reservoir
algae and diatoms was dominant, followed by that of
was mainly contributed by three groups, green algae, diatoms
709
T.-S. Dao et al.
|
Dynamics of cyanobacteria and cyanobacterial toxins in Tri An Reservoir, Vietnam
|
Journal of Water and Health
14.4
|
2016
and cyanobacteria (Figure 3). Hence, the chlorophyll concen-
of Kotak et al. (). This weak and negative correlation
tration from Tri An Reservoir extrapolated from the
could be explained by heterocystous (nitrogen-fixing, e.g.
phytoplankton biomass would be calculated more accurately
Anabaena spp.) and gas-vacuole containing cyanobacterial
with the equation of Kasprzak et al. () than that of Felip &
species (able to shift vertically, e.g. Microcystis spp.) mainly
Catalan ().
contributing to cyanobacterial biomass in Tri An Reservoir
Reynolds () formulated the relationship between TP
(Figure 4). Heterocystous cyanobacteria are stronger competi-
and chlorophyll concentration (mostly) based on data from
tors than algae in depleted nitrogen concentrations in the
temperate lakes and reservoirs, log[chlorophyll] ¼ 0.91 ×
reservoir as manifested elsewhere (Huisman & Hulot ).
log[TP]–0.435. From Tri An Reservoir, this relation was
Cyanobacterial
À1
biomass
ranged
from
0.0009
to
equated as log[chlorophyll] ¼ 0.91 × log[TP]–0.499. Hence,
0.834 mg L
our study confirmed the formulation with the data from a
than that reported from a reservoir in central Vietnam
tropical water body.
(Nguyen et al. ), but similar or lower than that recorded
(Figure 4) which was comparable or higher
Cyanobacterial biomass in Tri An Reservoir was posi-
at many tropical and temperate lakes throughout the world
tively correlated with water temperature (Table 2), a
(Trimbee & Prepas ; Zhang & Prepas ; Marinho &
cyanobacterial characteristic reviewed by Paerl & Huisman
de Moraes Huszar ). More than 10 genera of cyanobac-
(). The positive correlation between pH and DO con-
teria were recorded and several of them commonly
centration and cyanobacterial biomass is a result of
occurred in Tri An Reservoir (Dao et al. ). However,
photosynthetic activity, especially at favorable temperature.
only Microcystis and Anabaena were dominant, while the
A high biomass releases organic compounds, which in
proportion of other genera (e.g. Cylindrospermopsis, Aphani-
turn could be decomposed by bacteria, resulting in elevated
zomenon) was minor in cyanobacterial biomass. This could be
BOD5 values. However, correlations between cyanobacter-
because not all cyanobacteria have the capacity for buoyancy
ial biomass and temperature, pH and DO, BOD5 remained
regulation and nitrogen-fixing or a similar phosphorus uptake
low in our study (r
rate resulting in different competitive abilities for occurrence
0.49).
Phosphorus concentration and in particular the TN:TP
and development. Although Cylindrospermopsis and Aphani-
ratio support cyanobacterial abundance, growth and bloom
zomenon demonstrated a lower demand for nitrogen for
development (Tilman et al. ; Zhang & Prepas ). How-
development than Anabaena (Dao et al. ), their biomass
ever, Kotak et al. () showed that biomass of the
in the reservoir was lower. This might be related to the prefer-
cyanobacterium Microcystis aeruginosa was negatively corre-
ence of Cylindrospermopsis for shallow and turbid water
lated with TN:TP ratio. Unexpectedly, in Tri An Reservoir,
bodies (Stuken et al. ), while Tri An Reservoir is on aver-
cyanobacterial biomass did not correlate with the TN:TP
age 8.4 m and at its deepest point 27 m deep. Together with
ratio and TP during the monitoring period (Table 2). Jensen
low orthophosphate concentration (Table 1), the phosphorus
et al. () found that in shallow temperate lakes TP was clo-
uptake competition among phytoplankton might have limited
sely related to dominance of cyanobacteria up to TP < 0.8 mg
the mass development of cyanobacteria in Tri An Reservoir.
À1
À1
and green algae from TP > 1 mg L . During our monitor-
Furthermore, algal and cyanobacterial assemblages and abun-
ing, the maximum TP was 0.33 mg LÀ1 (Table 1) and
dance are strongly connected to phytoplankton grazers,
cyanobacterial biomass was higher than green algal biomass
which were excluded in our study, and need further
from April until September (Figure 3). At TA5, cyanobacteria
investigation.
L
benefited from the introduction of nutrients from the rivers,
whereas at TA6, the river characteristics dominated. Further
MC concentrations and their correlation with
into the reservoir, with increasing lacustrine characteristics,
environmental parameters and cyanobacterial biomass
biomass increases and the phytoplankton community
becomes lake typical. Total inorganic nitrogen concentrations
In Tri An Reservoir, both toxic and non-toxic strains of
were weakly negatively correlated with cyanobacterial bio-
Microcystis sp. were co-existing (Dao et al. ). The low
mass (r ¼ –0.358), which was in agreement with the results
MC concentrations correspond to low abundance of
710
T.-S. Dao et al.
|
Dynamics of cyanobacteria and cyanobacterial toxins in Tri An Reservoir, Vietnam
Journal of Water and Health
|
14.4
|
2016
cyanobacteria and the co-existence of toxin-producing and
consumers. Hence, via drinking water and fish consumption,
non-producing strains, as also found by Nguyen et al.
local residents might be at risk from chronic low exposure to
() in another reservoir in central Vietnam where no
cyanobacterial toxins. Moreover, as the reservoir is continu-
MC was detected at very low cyanobacterial biomass con-
ously being enriched with nutrients and other anthropogenic
À1
centrations (<0.006 mg L ).
pollutants (from fish caging, wastewater from the sugar factory,
Effects of environmental factors on toxin production of
and agricultural activities upstream of the reservoir), the
cyanobacteria have been reported with controversial results:
dynamics of cyanobacterial communities, abundance and
in the field, temperature, pH, and DO were strongly and posi-
toxins could change to a dominance of toxic strains. Hence
tively correlated to total MC concentration of Microcystis sp.
regular monitoring of cyanobacteria and their toxins and
while orthophosphate concentration was weakly and nega-
further studies related to toxin accumulation in fish from the
tively correlated (Wicks & Thiel ). However, Jacoby et al.
reservoir is strongly recommended.
() showed a positive correlation between phosphorus concentrations and MC concentrations from Microcystis and
Anabaena. In Planktothrix, Jann-Para et al. () suggested
CONCLUSIONS
a negative relationship between MC and light intensity, temperature, pH and phosphorus content but a positive
During the monitoring in Tri An Reservoir, temperature and
correlation between MC and TN:TP ratio. MC production by
pH were stable while the water turbidity changed season-
Oscillatoria isolates correlated with high nitrogen concen-
ally. Nitrogen, phosphorus and TN:TP ratio were favorable
trations, and also depended on phosphorus concentrations if
for phytoplankton development. Phytoplankton assemblage
those were below 0.4 mg LÀ1 (Sivonen ). TP strongly corre-
in the reservoir consisted of the major taxonomic groups of
lated with MC concentration in the field (Kotak et al. ). In
freshwater algae and cyanobacteria. Phytoplankton biomass
the mentioned investigations, different environmental factors
and proportion varied temporarily and spatially, influenced
and cyanobacterial species/strains were used for correlative
by physical conditions, available nutrients and nutrient com-
assessment, hence resulting in variable outcomes.
petition among the phytoplankton groups. Phytoplankton
The proportion of toxic cyanobacterial strains to non-
chlorophyll and TP concentrations were closely related as
toxic ones can have a wide range: from 6 to 86% (Shirai
previously formulated by Reynolds (). Cyanobacterial
et al. ). Consequently, several cyanobacterial biomass
biomass correlated positively with temperature, pH, BOD5
samples were dominated by toxin-producing strains,
but negatively with total inorganic nitrogen concentrations.
whereas others were entirely non-toxic (Orr & Jones ;
MC concentrations in the reservoir were low and weakly
Wiedner et al. ). In case the proportion does not
positively correlated with BOD5, TN:TP ratio and cyanobac-
change, toxin production would more or less be correlated
terial biomass. Additionally, co-existence and competition
with cyanobacterial biomass, which requires further investi-
for nutrients of both toxic and non-toxic strains in the reser-
gations in Tri An Reservoir.
voir influenced the toxin concentration. Further studies on
Although MC concentrations in Tri An Reservoir were far
zooplankton and planktivorous fish should be implemented
below the WHO guideline (WHO ), toxic cyanobacteria
for evaluation of phytoplankton communities and biomass
and their toxins were evidenced (Dao et al. ). The reservoir
dynamics in the reservoir. Regular monitoring of cyanobac-
is also used for fisheries with an annual fish yield of more than
teria and their toxins is recommended for implementation in
350 tonnes (personal communication with the director of the
future.
reservoir management board), which are consumed daily by
local people. Cyanobacterial toxins accumulate in fish muscle
and in particular in the liver at concentrations beyond the rec-
ACKNOWLEDGEMENTS
ommended WHO () consumption guideline value
(Magalhaes et al. ). Dangerously, the viscera of fish such
The authors thank Professor Ngoc-Lam Nguyen, Institute
as the liver and heart are a favorite food for many Vietnamese
of Oceanography Nha Trang, Vietnam, for providing
711
T.-S. Dao et al.
|
Dynamics of cyanobacteria and cyanobacterial toxins in Tri An Reservoir, Vietnam
laboratory conditions for phytoplankton counting. This
study was financially supported by the Swiss Agency for
Development and Cooperation Project.
REFERENCES
Bothe, H. Nitrogen fixation. In: The Biology of Cyanobacteria
(N. G. Carr & B. A. Whitton, eds). Blackwell, Berkeley and
Los Angeles, pp. 87–104.
Carmichael, W. W. Cyanobacterial secondary metabolites:
the cyanotoxins. Applied Bacteriology 72, 445–459.
Cronberg, G. Phytoplankton changes in lake Trummen
induced by restoration: long-term whole-lake studies and
food-web experiments. In: Folia Limnologica Scandinavica.
Dao, T. S., Cronberg, G., Nimptsch, J., Do-Hong, L. C. & Wiegand,
C. Toxic cyanobacteria from Tri An Reservoir, Vietnam.
Nova Hedwigia 90, 433–448.
Desortova, B. Relationship between chlorophyll-a
concentration and phytoplankton biomass in several
reservoirs in Czechoslovakia. International Review of
Hydrobiology 66, 153–169.
Duong, T. T., Le, T. P. Q., Dao, T. S., Pflugmacher, S., RochelleNewall, E., Hoang, T. K., Vu, T. N., Ho, C. T. & Dang, D. K.
Seasonal variation of cyanobacteria and microcystins in
the Nui Coc Reservoir, Northern Vietnam. Applied
Phycology 25, 1065–1075.
Fastner, J., Flieger, I. & Neumann, U. Optimal extraction of
microcystin from field samples: a comparison of different
solvent and procedures. Water Research 32, 3177–3181.
Felip, M. & Catalan, J. The relationship between
phytoplankton biovolume and chlorophyll in a deep
oligotrophic lake: decoupling in their spatial and temporal
maxima. Plankton Research 22, 91–105.
Havens, K. E., James, R. T., East, T. L. & Smith, V. H. N:P
ratios, light limitation and cyanobacterial dominance in a
subtropical lake impacted by non-point source nutrient
pollution. Environmental Pollution 122, 379–390.
Hernandez, J. M., Lopez-Rodas, V. & Costas, E. Microcystins
from tap water could be a risk factor for liver and colorectal
cancer: a risk intensified by global change. Medical
Hypotheses 72, 539–540.
Huisman, J. & Hulot, F. D. Population dynamics of harmful
cyanobacteria: factors affecting species composition.
In: Harmful Cyanobacteria (J. Huisman, H.C.P. Matthijs &
P. M. Visser, eds). Springer, Dordrecht, The Netherlands, pp.
143–176.
Hummert, C., Dahlmann, J., Reinhardt, K., Dang, H. P. H., Dang,
D. K. & Luckas, B. Liquid chromatography–mass
spectrometry identification of microcystins in Microcystis
aeruginosa strains from Lake Thanh Cong, Ha Noi, Vietnam.
Chromatographia 54, 569–575.
Journal of Water and Health
|
14.4
|
2016
Jacoby, J. M., Collier, D. C., Welch, E. B., Hardy, F. J. & Crayton,
M. Environmental factors associated with a toxic bloom
of Microcystis aeruginosa. Canadian Journal of Fisheries and
Aquatic Science 57, 231–240.
Jann-Para, G., Schwob, I. & Feuillade, M. Occurrence of
toxic Planktothrix rubescens blooms in lake Nantua, France.
Toxicon 43, 279–285.
Jensen, J. P., Jeppesen, E., Olrik, K. & Kristensen, P. Impact
of nutrients and physical factors on the shift from
cyanobacterial to chlorophyte dominance in shallow Danish
lakes. Canadian Journal of Fisheries and Aquatic Science 51,
1692–1699.
Kasprzak, P., Padisak, J., Koschel, R. & Kriennitz, L.
Chlorophyll a concentration across a trophic gradient of
lakes: an estimator of phytoplankton biomass. Limnologica
38, 327–338.
Komárek, J. & Anagnostidis, K. Modern approach to the
classification system of cyanophytes. 4. Nostocales. Archiv
fur Hydrobiologie Supplement 82/Algol. Stud. 56.
Komárek, J. & Anagnostidis, K. Cyanoprokaryota 1. Teil:
Chroococcales. In: Süβwasserflora von Mitteleuropa
(H. Ettl, G. Gärtner, H. Heynig & D. Mollenhauer, eds).
19/1, Gustav Fischer Verlag, Jena, Germany, pp. 1–548.
Komárek, J. & Anagnostidis, K. Cyanoprokaryota 1. Teil:
Oscillatoriales. In: Süβwasserflora von Mitteleuropa
(B. Büdel, G. Gärtner, L. Krienitz & M. Schagerl, eds).
19/2, Gustav Fischer Verlag, Jena, Germany.
Kotak, B. G., Lam, A. K. Y., Prepas, E. E. & Hrudey, S. Role of
chemical and physical variables in regulating microcystin-LR
concentration in phytoplankton of eutrophic lake. Canadian
Journal of Fisheries and Aquatic Science 57, 1584–1593.
Krammer, K. & Lange-Bertalot, H. Süβwasserflora von
Mitteleuropa, Bacillariophyceae 3. Teil: Centrales,
Fragilariaceae, Eunotiaceae. Gustav Fischer Verlag, Jena,
Germany.
Lira, G. A. S. T., Bittencourt-Oliveira, M. C. & Moura, A. N.
Structure and dynamics of phytoplankton community in the
Botafogo Reservoir, Pernambuco, Brazil. Brazilian
Archives of Biology and Technology 52, 493–501.
Magalhaes, V. F., Marinho, M. M., Domingos, P., Oliveira, A. C.,
Costa, S. M., Azevedo, L. O. & Azevedo, S. M. F. O.
Microcystins (cyanobacteria hepatotoxins) bioaccumulation
in fish and crustaceans from Sepetiba Bay (Brazil, RJ).
Toxicon 42, 289–295.
Marinho, M. M. & de Moraes Huszar, V. L. Nutrient
availability and physical conditions as controlling factors of
phytoplankton composition and biomass in a tropical
reservoir (Southeastern Brazil). Archiv fur Hydrobiologie
153, 443–468.
Metcalf, J. S. & Codd, G. A. Cyanotoxins. In: Ecology of
Cyanobacteria II: Their Diversity in Space and Time (B. A.
Whitton, ed.). Springer Science & Business Media B.V,
Dordrecht, The Netherlands.
Nguyen, T. T. L., Cronberg, G., Annadotter, H. & Larsen, J.
Planktic cyanobacteria from freshwater localities in
712
T.-S. Dao et al.
|
Dynamics of cyanobacteria and cyanobacterial toxins in Tri An Reservoir, Vietnam
Thuathien-Hue Province, Vietnam II. Algal biomass and
microcystin production. Nova Hedwigia 85, 35–49.
Olrik, K., Blomqvist, P., Brettum, P., Cronberg, G. & Eloranta, P.
Methods for Quantitative Assessment of Phytoplankton
in Freshwater, Part 1: Sampling, Processing and Application
in Freshwater Environmental Monitoring Programmes.
Naturvardsverket Forlag, Stockholm.
Orr, P. T. & Jones, G. Relationship between microcystin
production and cell division rates in nitrogen-limited Microcystis
aeruginosa cultures. Limnology & Oceanography 43, 1604–1614.
Padisak, J. Phytoplankton. In: The Lakes Handbook: Volume
1 Limnology and Limnetic Ecology (P. E. O’Sullivan & C. S.
Reynolds, eds). Blackwell, Malden, USA, pp. 251–308.
Paerl, H. W. & Huisman, J. Blooms like it hot. Science 320,
57–58.
Pflugmacher, S., Wiegand, C., Beattie, K. A., Krause, E., Steinberg,
C. E. W. & Codd, G. A. Uptake, effects, and metabolism
of cyanobacteria toxins in the emergent reed plant
Phragmites australis (Cav.) Trin. ex Steud. Environmental
Toxicology & Chemistry 20, 846–852.
Reynolds, C. S. Ecology of Phytoplankton. Cambridge
University Press, Cambridge, UK, pp. 397–341.
Sabour, B., Loudiki, M. & Vasconcelos, V. Growth responses
of Microcystis ichthyoblade Kuetzing and Anabaena
aphanizomenoides Forti (cyanobacteria) under different
nitrogen and phosphorus conditions. Chemistry and Ecology
25, 337–344.
Shirai, M., Ohtake, A., Sano, T., Matsumoto, S., Sakamoto, T.,
Sato, A., Aida, T., Harada, K. I., Shimada, T., Suzuki, M. &
Nakano, M. Toxicity and toxins of natural blooms and
isolated strains of Microcystis spp. (Cyanobacteria) and
improved procedure for purification of cultures. Applied and
Environmental Microbiology 57, 1241–1245.
Sivonen, K. Effects of light, temperature, nitrate,
orthophosphate, and bacteria on growth of and hepatotoxin
production by Oscillatoria agardhii strains. Applied and
Environmental Microbiology 56, 2658–2666.
Sivonen, K. & Jones, G. Cyanobacterial toxins. In: Toxic
Cyanobacteria in Water: A Guide to their Public Health
Consequences, Monitoring and Management (I. Chorus &
J. Bartram, eds). E & FN Spon, London, pp. 41–111.
Smith, V. H. Low nitrogen to phosphorus ratios favor
dominance by blue-green algae in lake phytoplankton.
Science 221, 669–671.
Smith, V. H. Light and nutrient effects on the relative
biomass of blue-green algae in lake phytoplankton. Canadian
Journal of Fisheries and Aquatic Science 43, 148–153.
Sournia, A. Phytoplankton Manual. UNESCO, UK.
Standard Methods for the Examination of Water and Wastewater
21st edn. American Public Health Association,
Journal of Water and Health
|
14.4
|
2016
American Water Works Foundation, Water Environment
Federation, Washington, DC.
Stuken, A., Rucker, J., Endrulat, T., Preussel, K., Hemm, M., Nixdorf,
B., Karsten, U. & Wiedner, C. Distribution of three alien
cyanobacterial species (Nostocales) in northeast Germany:
Cylindrospermopsis raciborskii, Anabaena bergii and
Aphanizomenon aphanizomenoides. Phycologia 45, 696–703.
Tilman, D., Kiesling, R., Sterner, R., Kilham, S. S. & Johnson, F. A.
Green, blue-green and diatom algae: differences in
competitive ability for phosphorus, silicon and nitrogen.
Archiv fur Hydrobiologie 106, 473–485.
Trimbee, A. M. & Prepas, E. E. Evaluation of total
phosphorus as a predictor of the relative biomass of blueGreen algae with emphasis on Alberta Lakes. Canadian
Journal of Fisheries and Aquatic Science 44, 1337–1342.
Vietnam Ministry of Science, Technology and Environment
The Valuable Biodiversity and Environment Wetlands in
Vietnam. Agricultural Publishing House, Hanoi.
Visser, P. M., Ibelings, B. M., Mur, L. R. & Walsby, A. E. The
ecophysiology of the harmful cyanobacterium Microcystis:
features explaining its success and measures for its control.
In: Harmful Cyanobacteria (J. Huisman, H. C. P. Matthijs &
P. M. Visser, eds). Springer, Dordrecht, The Netherlands.
Wetzel, R. G. Limnology: Lake and River Ecosystems, 3rd
edn. Academic Press, San Diego.
Wicks, R. J. & Thiel, P. G. Environmental factors affecting
the production of peptide toxins in floating scums of the
cyanobacterium Microcystis aeruginosa in a hypertrophic
African reservoir. Environmental Science and Technology 24,
1413–1418.
Wiedner, C., Nixdorf, B., Heinze, R., Wirsing, B., Neumann, U. &
Weckesser, J. Regulation of cyanobacteria and
microcystin dynamics in polymictic shallow lakes. Archiv fur
Hydrobiologie 155, 383–400.
World Health Organization (WHO) Guidelines for Safe
Recreational Waters, Volume 1: Coastal and Fresh Waters,
Chapter 8: Algae and Cyanobacteria in Fresh Water. WHO
Publishing, Geneva, pp. 136–158.
Yusoff, F. M. & McNabb, C. D. The effects of phosphorus and
nitrogen on phytoplankton dominance in tropical fish ponds.
Aquaculture Research 28, 591–597.
Zhang, Y. & Prepas, E. E. Regulation of the dominance of
planktonic diatoms and cyanobacteria in four eutrophic
hardwater lakes by nutrients, water column stability and
temperature. Canadian Journal of Fisheries and Aquatic
Science 53, 621–633.
Zurawell, R. W., Chen, H., Burke, J. M. & Prepas, E. E.
Hepatotoxic cyanobacteria: a review of the biological
importance of microcystins in freshwater environments.
Toxicology and Environmental Health Part B 8, 1–37.
First received 27 August 2015; accepted in revised form 26 January 2016. Available online 11 March 2016