Volume 1 photovoltaic solar energy 1 06 – feed in tariffs and other support mechanisms for solar PV promotion
Bạn đang xem bản rút gọn của tài liệu. Xem và tải ngay bản đầy đủ của tài liệu tại đây (1.85 MB, 37 trang )
1.06 Feed-In Tariffs and Other Support Mechanisms for Solar PV
Promotion
D Jacobs, Freie Universität Berlin, Berlin, Germany
BK Sovacool, Vermont Law School, South Royalton, VT, USA
© 2012 Elsevier Ltd. All rights reserved.
1.06.1
1.06.2
1.06.2.1
1.06.2.2
1.06.2.3
1.06.2.4
1.06.2.5
1.06.2.6
1.06.3
1.06.3.1
1.06.3.2
1.06.3.2.1
1.06.3.2.2
1.06.3.2.3
1.06.3.2.4
1.06.3.2.5
1.06.3.3
1.06.4
1.06.4.1
1.06.4.2
1.06.4.2.1
1.06.4.2.2
1.06.4.2.3
1.06.4.2.4
1.06.4.2.5
1.06.4.3
1.06.5
1.06.5.1
1.06.5.2
1.06.5.3
1.06.5.4
1.06.6
1.06.6.1
1.06.6.2
1.06.6.3
1.06.6.4
1.06.6.5
1.06.6.6
1.06.6.7
1.06.6.8
1.06.6.9
1.06.6.10
1.06.6.11
1.06.6.12
1.06.6.12.1
1.06.7
1.06.7.1
1.06.7.2
References
Introduction
Overview of Support Mechanisms for Renewable Electricity
Quota-Based Support (TGC and RPS)
Tender Systems
Net Metering
Feed-In Tariffs
Tax and Investment Incentives
Assessment of Support Mechanisms (Effectiveness and Efficiency)
Singapore
Introduction
Existing Support Schemes
Solar capability scheme
Clean energy research and test-bedding program
Clean energy program office
Clean energy research program
Other efforts
Challenges and Prospects for the Future
United States
Introduction
Existing Support Schemes
Renewable portfolio standards
Net metering
Green power programs
Tax credits
Feed-in tariffs
Challenges and Prospects for the Future
European Union (Germany and Spain)
Introduction: Europe
Support Mechanisms
Germany
Spain
Common Features of Best Practice Promotion Schemes
Eligible Producers
Purchase Obligations
Tariff Calculation Methodology
Duration of Tariff Payment
Financing Mechanism
Progress Report
Tariff Differentiation According to Plant Size
Tariff Differentiation According to Plant Type (Location)
Tariff Degression
Inflation Indexation
Design Options for Better Market Integration
Challenges and Prospects for the Future
Managing volume success with price response
Conclusion and Outlook
Leveling the Playing Field
Investment Structure and Actor Groups on Future Electricity Markets
Comprehensive Renewable Energy, Volume 1
doi:10.1016/B978-0-08-087872-0.00104-9
74
75
76
77
77
77
78
78
79
79
79
80
81
81
81
81
82
83
83
84
85
86
86
87
88
89
90
90
91
91
91
93
94
94
94
97
97
98
98
99
99
101
102
103
103
103
105
106
106
73
74
Economics and Environment
1.06.1 Introduction
This chapter explores support mechanisms for the promotion of solar photovoltaic (PV) electricity. Over the years, a range of
support instruments have been applied in order to foster the deployment of solar PV installations around the world, including
research and development (R&D) spending, investment and tax incentives, and market-based support instruments such as net
metering and feed-in tariffs (FITs). In this chapter we will analyze existing support mechanisms in Singapore, the United States,
Germany, and Spain.
The promotion of solar PV started to be of large interest for policymakers in the 1970s. After the oil crises of the 1970s, the quest
for alternative energy sources became a major goal for energy policy strategies worldwide. However, the market for solar PV has
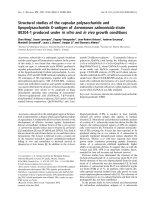
really started to expand only in the past 10–15 years. While the global cumulative PV capacity was less than 1 GW in 1998, 10 years
later it had already reached almost 15 GW (see Figure 1), about 23 GW in 2009, and more than 35 GW in 2010 [1]. This
development is largely due to innovative support schemes that will be discussed in this chapter.
One record year is following another. In 2008, the newly installed capacity reached 5.5 GWp, and solar PV produced about
15 TWh of electricity. In 2009, about 7.2 GW new capacity was added. According to the European Photovoltaic Industry Association
(EPIA), the global solar PV market could reach almost 30 GW annually by 2014 if appropriate policy frameworks are established in
key markets [2].
Despite the fact that solar PV only supplies less than 1% of total electricity demand, the worldwide installed capacity of solar PV
has experienced impressive growth rates over the last decade. Although the capacity increased by an average of 24% in the years
1998–2003, this figure jumped to 39% in the following 5 years (2003–08). Between 1999 and 2008, the installed capacity has
increased by more than 10-fold [3] (see Figure 2).
There is a clear correlation between increasing markets and decreasing module prices. According to one recent assessment, a
doubling of the cumulative installed PV capacity has led to price reduction for modules of 22% (see Figure 3). Based on these
observations, further significant price reductions can be expected in the future [4].
Similarly, worldwide R&D spending has increased from about US $250 million in 2000 to US $500 million in 2007. At the same
time, the generation costs for solar PV have decreased by more than 50% [5]. Based on these figures, the International Energy Agency
(IEA) projected generation cost for solar PV until 2050 [6]. Accordingly, at good locations the costs for electricity from solar PV
might be as low as 12 US¢ (kWh)−1 in 2020, 7 US¢ (kWh)−1 in 2030, and 4.5 US¢ (kWh)−1 in 2050. Besides the cost reduction
through mass markets, technological learning also took place regarding the average cell efficiency. In the case of crystalline cells, the
average efficiency increased from 14.5% in 2004 to 16.5% in 2008. These efficiency gains will most likely continue in the future.
Notwithstanding the impressive development of the global PV market, world market growth in the last decade was substantially
driven by a limited number of countries, namely Germany, Spain, and (to a certain extent) Japan. When looking at the regional
distribution of the global PV market in 2009, the dominant role of Europe with respect to the rest of the world becomes apparent
[5]. Of all newly installed capacity, about 70% was located in Europe, with Germany accounting for 54% of that world market.
The lesson appears to be that global market development depends crucially on the policy framework conditions within
countries. Germany, Spain, and Japan make up about ¾ of the total installed capacity worldwide. Whereas Germany and Spain
primarily relied on FITs for the promotion of solar power, Japan for the most part relied on investment subsidies and net metering
mechanisms.
Cumulative photovoltaic installations (MWp)
25 000
Spain
Rest of Europe
United States
Rest of world
Germany
Japan
20 000
15 000
10 000
5000
0
2000
2001
2002
2003
2004
2005
2006
2007
2008
2009
Figure 1 Accumulated, worldwide installed solar capacity per region (2000–09). Source: JRC (2010) PV status report 2010. Ispra, Italy: Joint Research
Centre, Institute for Energy, European Commission [1].
Feed-In Tariffs and Other Support Mechanisms for Solar PV Promotion
75
EU 27
Global
14 730
2003–2008
+39%
MW
9162 9405
6770
1998–2003
+24%
5167
4765
3847
948
139
108
1998
1428
1150
1999
189
2000
1762
2201
2001
1981
1089
394
286
2971
2795
2002
605
2003
2004
2005
2006
2007
2008
Figure 2 Cumulative installed PV capacity in EU-27 and in the world. Source: EPIA (2009) Set for 2020 – Solar photovoltaic electricity: A mainstream
power source in Europe by 2020, executive summary [3].
100
PV modules prices (S/W)
1980
1990
10
2000
Historical Price
Experience Curve
Doubing of cumulative
production reduces
prices by 22%
2006
0
0
1
10
100
1000
Cumulative module production (MW)
10 000
100 000
Figure 3 Photovoltaic module price experience curve since 1976 ($ W−1). Source: EPIA (2009) Set for 2020 – Solar photovoltaic electricity: A
mainstream power source in Europe by 2020, executive summary [3].
In this chapter, we elaborate on the reasons for success in promoting solar PV deployment. We focus on FITs with a special eye on
design in Germany and Spain as these countries have been most successful in bringing about new PV capacity and because they have
frequently been identified as international best practice. However, we do not exclusively focus on FITs. As will be shown, also
Germany and Spain used other support mechanisms at an early stage of market development. Similarly to Germany in the 1980s,
Singapore is (still) primarily focusing on R&D and investment subsidies. In the United States, a sort of evolutionary process of
support instruments occurred, including R&D spending and tax credit schemes up to net metering and, most recently, FITs. In
Singapore, a similar progression occurred from R&D spending to investment subsidies. However, before going into the more
detailed case studies, we will give a more general overview about support instruments for renewable electricity in the following
section.
1.06.2 Overview of Support Mechanisms for Renewable Electricity
The promotion of renewable energy sources has become a priority for scores of governments around the world. (This section draws
largely on a policy paper which David Jacobs has prepared for an OSCE (Organization for Security and Co-operation in Europe)
seminar paper (Baku, Azerbaijan).) As of 2010, more than 80 countries worldwide have adopted targets for the development of
76
Economics and Environment
Table 1
Overview of support mechanisms from renewable electricity
Support mechanisms
Price-based support
Quantity-based support
Investment focused
Research and development
Investment subsidies
Tax incentives
Soft loans
FITs
Net metering
Tender mechanism
Generation focused
Tender mechanism
Quota obligations (TGC/RPS)
RPS, renewable portfolio standard; TGC, tradable green certificate scheme.
renewable energy sources. Medium or long-term targets are an advantage as they increase investment security for power producers.
In order to reach these targets, governments around the world have adopted a wide range of policies for the promotion of renewable
energy sources. At least 85 countries have implemented specific policies for renewables. The most frequently used support
mechanisms for renewable electricity are public R&D, tax and investment incentives, FITs, net metering, quota-based mechanisms
(based on certificate trading), and tender systems [7]. These mechanisms can be grouped into price-based and quantity-based
support (see Table 1). Furthermore, one can differentiate between capacity-focused and production-focused incentives [8].
In recent years, many studies have found that the actual design of support mechanisms is more important for effective and
efficient support than the mere choice of support schemes. Therefore, it is essential to take international best practice into account
when designing a national support instrument. Well-designed support mechanisms guaranteeing a maximum of investment
security can reduce costs for renewable energies by 10–30% [6]. If the investor is able to foresee the income revenue of a project,
financial institutions will provide capital at lower cost, thus lowering the costs for renewable electricity.
1.06.2.1
Quota-Based Support (TGC and RPS)
Under quota-based mechanisms, the legislator obliges a certain market actor (consumers, producers, or suppliers) to provide a
certain share of electricity from renewable energy sources. The choice of the obliged party (consumer, producer, or supplier) usually
depends on the national market design. The obliged party can either produce electricity itself or buy it from other green electricity
producers. In order to increase the flexibility of the system, in many countries the obliged party is also allowed to reach the share by
trading certificates, which serve as proof for compliance [9]. Therefore, these mechanisms are often called tradable green certificate
(TGC) schemes. In the United States and other parts of the world, they are often called renewable portfolio standards (RPSs), as
supply companies are obliged to provide a certain share of the electricity portfolio from renewable energy sources. RPS mechanisms
sometimes operate without certificate trading. They can also be combined with tender mechanisms or FITs.
In the case of certificate trading, renewable electricity producers have two income sources. First, they sell their electricity at the
spot market for electricity at the given market price. Second, they can sell their certificates at the national green certificate market. In
theory, the certificate sales shall compensate for ‘greenness’ of the electricity, that is, the positive attribute of renewable electricity
compared with conventionally produced ‘gray electricity’. The obliged party can either obtain certificates by producing renewable
electricity itself or by buying them on the certificate market. The certificates allow the obliged party to prove that they have
‘produced’ a certain share of their electricity from renewable energy sources. If they cannot prove this, that is, they do not have a
sufficient number of certificates, they have to pay a penalty.
In theory, quota-based mechanisms have the advantage of being cost-efficient as they focus on the least cost technologies and
spur competition between green power producers. Producers will install only the cheapest renewable energy technologies as this
support mechanism does not take the differences in generation costs for different renewable energy technologies into account.
Theoretically, quota obligations are also thought to be most appropriate to reach a certain target, without overfulfilling or
undergoing it. Besides, certificate trading gives the obliged party flexibility of how to reach particular policy goals, requirements,
and targets. The can produce ‘green’ electricity themselves, buy certificates on the certificate market, and freely decide upon which
technology to chose for meeting those targets. Unlike tax exemptions, publicly financed R&D, and other support mechanisms,
quota-based mechanisms cost the legislator no money as the additional costs are passed on to the final consumer.
However, in practice, quota-based mechanisms face some disadvantages. In the case of certificate trading, they convey a high risk
for renewable electricity producers as both revenue sources – the electricity spot price and the certificate price – are volatile. Due to
fluctuations of the electricity price and the certificate price, long-term rates of return are difficult to predict, thus making the
financing of renewable energy projects more expansive. In practice, the increased investors risk can offset the theoretical benefits
from competition between renewable electricity producers. In the United Kingdom, not even one-third of all projects has actually
been installed, see Reference 10. As quota-based mechanisms are generally technology neutral, they only support the least costly
renewable energy sources. Therefore, less mature technologies, such as solar power, geothermal, and certain types of biomass, are
not being developed. Nontechnology-specific certificate trading creates large excess profits for producers of relatively mature
technologies, thus making the support of renewable electricity unnecessarily expensive [11]. By focusing on the least cost
technologies and not promoting other, less mature technologies, technological learning is de facto penalized. Moreover, empiric
Feed-In Tariffs and Other Support Mechanisms for Solar PV Promotion
77
findings suggest that European TGC schemes favor large players and especially incumbent industries. Therefore, small-scale,
independent power producers have difficulties entering the market. Finally, renewable electricity producers will always try not to
achieve the targets fixed by the quota obligation as this would mean that the certificate price will drop to zero. Therefore,
quota-based mechanisms can even limit the expansion of renewable energy sources.
1.06.2.2
Tender Systems
Tender or bidding systems are quantity-based support instruments where the legislator issues a call for tender, that is, an auctioning
mechanism, for a certain renewable energy project of a specific size. The financial support can be based either on the total
investment cost or on the power generation cost per electricity unit. Instead of offering up-front support (investment cost), tender
mechanisms are usually based on the power generation costs per unit of electricity, that is, bidders provide renewable electricity at a
predefined price per kilowatt-hour over a certain number of years. The bidder with the lowest necessary financial support wins the
tender and has the exclusive right to profit from the support granted.
In theory, tender schemes have a number of advantages. First and foremost, they are cost-effective, as the tender process initiates
competition between producers. As the bidder with the lowest bid wins the contract for power generation, the total additional cost
for the society can, in theory, be limited. Besides, the government has direct control over the amount of renewable electricity that is
produced under the support mechanism.
However, in practice tender schemes have revealed considerable problems. The major disadvantage of tender schemes is their
limited effectiveness in empirical practice. Due to competitive bidding process, projects are often not actually built as competitors
issue bids which are too low for actually running power plants profitably. Therefore, these projects are frequently abandoned by
developers. Besides, tender mechanisms have been criticized for not promoting local renewable energy development as all necessary
equipments are imported from other countries. Moreover, tenders have created stop-and-go development cycles in the renewable
energy industry as legislators have called for tenders irregularly.
1.06.2.3
Net Metering
Net metering is a concept mostly applied for the promotion of decentralized solar electricity. Theoretically, also other technologies
can be eligible under net metering mechanisms. Generally speaking, independent power producers have the right to get connected
to the grid, and the local utility or grid operator is obliged to purchase all excess electricity. The name of the support instrument
refers to the meter measuring the electricity consumption. In the case of most net metering schemes, the meter starts turning
‘backward’ once excess electricity is fed into the grid. If the consumer has produced more electricity than consumed, the local utility
or grid operator has to pay for the net production at the end of each month or year. The ‘remuneration’ for the excess electricity varies
from one net metering program to the other. In some cases, excess electricity is paid according to the retail electricity price; in other
cases, the wholesale electricity price is the benchmark. Further variations are possible.
Historically, consumers who intended to produce renewable electricity at home and sell the excess power to the grid had to use
separate meters. This ‘double metering’ led to unfair conditions for consumers as utilities only wanted to pay very small rates for the
electricity fed into the grid. With net metering, ostensibly the consumer at least gets the retail electricity price (as the meter simply
turns backward).
Theoretically, net metering has a number of advantages. Solar PV is usually produced at daytime when electricity demand is
highest in many countries. Therefore, consumers can provide valuable electricity during peak demand periods. If net metering is
coupled with time of use electricity rates for final consumer (i.e., higher electricity tariffs during high demand periods), these
mechanisms can generate considerable incomes for consumers.
However, in most cases, these incomes are not high enough in order to finance the solar modules. Therefore, using renewable
electricity locally and not feeding it into the grid is inherently promoted by this support mechanism. Besides, net metering
frequently focuses on small-scale solar PV systems, as only excess electricity is being accepted. Therefore, large-scale renewable
energy plants – which are necessary for transforming the global energy system – are not being supported. In contrast to other
price-based support mechanisms, namely FITs, investment security is still rather low as the profitability of a plant largely depends on
the long-term development of electricity prices for final consumers.
1.06.2.4
Feed-In Tariffs
FITs set a fixed price for the purchase of one unit renewable electricity. This rate reflects the actual power generation cost of each
renewable energy technology (plus a reasonable rate of return). Tariffs are usually guaranteed for a long period of time (e.g., 15–20
years). FITs normally require grid operators to purchase all renewable electricity, independent of total electricity demand. They are
generally financed via a small top-up on the electricity price for final consumers, that is, additional costs are distributed between all
rate payers via national burden-sharing mechanisms. When designing FITs, legislators are looking for a balance between investment
security for producers and reduced costs for the final consumer.
The success of FITs largely depends on the high degree of investment security. Investors’ risks (volume and price risk) can be
significantly reduced by providing fixed tariff payment over a long period of time. Besides, renewable electricity producers are
generally not subject to balancing risk (providing prenegotiated amounts of electricity at a given moment in time), as FITs include a
78
Economics and Environment
purchasing obligation. The biggest advantage of FITs over other support mechanisms is the technology-specific approach. By being
able to promote all renewable energy technologies according to their stage of technological development, the policymaker also has
the chance to promote technologies which are still rather costly but have a large mid- or long-term potential (e.g., solar PV). Besides,
mature technologies such as wind energy can be promoted in a cost-efficient manner.
Nonetheless, even FITs have some disadvantages. Especially in countries with liberalized energy markets, FITs have sometimes
been criticized for not conforming to the principle of competition as the idea of ‘fixing’ tariffs is associated with state-dominated,
monopolistic energy markets. Fixing tariffs has also been criticized for hindering technological learning. However, tariff degression
and frequent assessments of tariff levels can help to address this problem. Besides, a purchase obligation, that is, the purchase of all
renewable electricity independent of electricity demand patterns, can lead to network balancing problems and increased grid
operation costs. Moreover, it might be difficult to predict the number of market players and consequently renewable electricity
projects which are attracted by a certain tariff level. Therefore, emerging economies and developing countries have often chosen to
operate with capacity caps.
1.06.2.5
Tax and Investment Incentives
Investment incentives, that is, capital grants, tax incentives, tax credits, and soft loans, were the major support mechanisms for
renewable energies in the 1980s and at the start of the 1990s [12]. They were mostly used for the realization of demonstration
projects. The above-mentioned support schemes, especially FITs, quota-based mechanisms, and tender schemes, are generally
supplemented by additional tax and investment incentives at an early stage of market development. Investment incentives are
normally capacity-based incentives and investment focused, that is, the state grants a certain financial incentive based on the size,
that is, the installed capacity, of the power plant.
Capital grants are often given in the form of contributions to the total investment costs. Producers of renewable electricity are
often exempted from certain taxes. This can be carbon taxes in the case of industrialized countries or taxes for imports of renewable
energy equipment in developing countries. Tax exemptions are normally justified by the unfair competition with conventional
energy sources due to the lack of internalizing the negative external costs. Many countries also operate with accelerated depreciation
for renewable energy projects. This allows people investing in renewable energy projects to earlier profit from tax benefits [13]. In
the United States, tax credit mechanisms have been used frequently to promote renewable energy sources. They can be separated
into investment tax credits (ITCs) and production tax credits (PTCs). As implied by the name, ITCs guarantee favorable tax treatment
to actors deciding to invest into renewable energy projects by providing a partial tax write-off. When buying renewable energy
equipment, investors can receive a 5–50% tax credit [14].
Capital grants and tax incentives have the advantage of enabling clear and predictable investment incentives to renewable energy
investors. They can be applied to one specific or a whole range of technologies. In contrast to governmental R&D funding, private
actors are usually targeted by those mechanisms. As mentioned above, tax and investment incentives have proven to be a successful
supplementary and/or complementary instrument for renewable energy deployment. Similar to all the above-mentioned support
schemes, they socialize the costs from renewable electricity promotion by distributing them amongst all tax payers.
However, these support mechanisms also have certain drawbacks. Most obviously, investment incentives are (naturally) geared
toward spurring investment in a technology only, and they do not offer any incentive to improve the long-term operating
performance of renewable energy power plants. This has sometimes led to a situation where investors have profited from
governmental grants but never operated renewable energy power plants properly. Such a situation occurred with wind energy in
India, where the legislator now decided to move away from investment-based support toward production-based support instru
ments. Tax incentives such as accelerated depreciation and tax credit schemes also tend to favor large-scale power plants (due to
economies of scale) and wealthy people as one needs to have sufficient income to use tax credits effectively. Therefore, they
implicitly exclude individuals and small businesses from participating in the renewable energy market.
1.06.2.6
Assessment of Support Mechanisms (Effectiveness and Efficiency)
Support mechanisms for electricity from renewable energy sources have been frequently analyzed. From economic theory, priceand quantity-based mechanisms are ought to have the same impact. Both approaches create an artificial market in order to stimulate
renewable electricity deployment. In the case of price-based support, the legislator fixes the ‘price’ and the market decides about the
‘quantity’ of renewable energy projects. In the case of quantity-based support, the legislator fixes the amount of renewable electricity
that shall be produced and the market decides about the price [15]. However, in reality some support instruments have proven to be
more successful than others.
Most recently, the European Commission and the IEA have evaluated the above-mentioned support instruments for green
electricity. Their evaluations have found that the success of support mechanisms can be best measured by effectiveness and
efficiency. Effectiveness refers to the ability of a support mechanism to deliver an increase of the share of renewable electricity,
while efficiency is related to cost-efficiency, that is, a comparison of the total amount of support received and the generation cost.
In the following section, the most prominent renewable electricity support mechanisms will be compared, namely quota-based
mechanisms, tender schemes, net metering, and FITs. (Investment and tax incentives are not being considered as they are
generally applied as additional support mechanisms and their success significantly depends on the specific design in each
country.)
Feed-In Tariffs and Other Support Mechanisms for Solar PV Promotion
79
By now, technology-specific support mechanisms, namely FITs, have proven to be most effective. This is especially true
in the case of wind energy, biogas, and solar PV. In the case of biomass, some quota-based mechanisms have also been
able to bring about renewable electricity deployment, due to the fact that these mechanisms generally promote the
least costly technologies, for example, landfill gas plants. The European Commission also stresses that production-based
support is far more important for the development of renewable energy projects than investment-based support. This
confirms that tax and investment incentives should be used as supplementary support instruments but not as the major
policy for support.
The superiority of FITs is clearly related to the high degree of investment security, by guaranteeing fixed tariff payment
over a long period of time. In the case of quota-based mechanisms, insecurity about the future rates of return slowed down
investment, while tender-based mechanisms suffered from the fact that many projects had been abandoned because of low
bids.
A similar picture emerges when comparing the efficiency of support mechanisms. Generally speaking, FIT countries made better
use of the money dedicated to renewable electricity support. The higher degree of efficiency of FITs is also due to the high degree of
investment security. By guaranteeing tariff for a long period of time, project developers have fewer difficulties financing the
renewable energy projects, and financing conditions are generally better than with other support instruments. In the case of
quota-based support instruments, capital is generally more expansive as banks normally take a risk premium for the uncertain
development of the certificate price and the electricity price.
Furthermore, the higher degree of efficiency of FITs is also related to technology-specific support. As shown above, well-designed
FITs calculate the tariff payment based on the generation costs for each technology, normally assuming an internal rate of return
between 5% and 9%. By doing this, windfall profits can be avoided. In contrast, technology-neutral quota-based mechanisms grant
the same support to all technologies. Therefore, cost-efficient technologies can normally count on very high internal rates of return
while less mature technologies will not be developed at all.
With an eye for which mechanisms have proven most successful on the ground, as well as an appreciation that mechanisms are
seldom implemented in isolation and instead policymakers often rely on a bundle of support schemes at once, the next section
explores four case studies. It explores what the governments of Singapore, the United States, and Germany and Spain (in the
European Union) have each done to promote solar PV.
1.06.3 Singapore
1.06.3.1
Introduction
Singapore, with better solar radiation than Germany, had installed only a few kilowatts of solar PV capacity by 2005 but has since
shown a remarkable speed of policy and technology development. In 2004 the country had only ‘token’ efforts to attract
manufacturing and R&D, but since then has signaled a strategic intent to invest in renewable energy generally and solar PV as a
‘core’ sector [16]. In the past few years, the country has seen a new Solar Energy Research Institute of Singapore (SERIS) launched,
manufacturing and research companies established, a $350 million fund for clean energy created, and a variety of test-bed projects
along with a solar capability scheme (SCS) to fund private sector projects. As Figure 4 shows, installed solar PV capacity has
increased more than 100-fold from 18 kWp in 2000 to 2000 kWp in 2009.
1.06.3.2
Existing Support Schemes
Singapore has a number of factors that make it well suited for solar PV and especially building integrated solar PV. Singapore’s
annual global solar radiation is 50% larger than Germany’s and the provision of solar energy there is even, whereas other countries
suffer from seasonal changes in output, and its high diffuse ratio in Singapore means vertical surfaces receive high solar radiation
independent of their orientation. Amorphous silicon performs well under Singapore’s tropical hot and humid conditions. Second,
the ways that buildings are designed and constructed hold advantages for PV integration. Building orientation is often designed with
respect to the sun in Singapore, meaning that subexposed facades have fewer windows to prevent solar heat from entering the
interior and plentiful unused surfaces, especially roofs, available for installation. Moreover, Housing Development Board buildings
are mostly prefabricated, meaning installations can be the same size and efficiently applied in large numbers. Third, PV systems can
offer a variety of important ancillary services, including the shading of facades and rainwater collecting devices such as butterfly
roofs, adding value to buildings [17].
Despite these potential benefits, up until 2004 the largest impediment to solar PV systems in Singapore was cost. With few
government incentives, a homeowner investing in a solar panel had to wait about 50 years to make their money back (unlike
3–10 years in places such as Japan and Germany) [18]. A similar study also concluded that given current economics and rate
structures, power generation solar PV is costlier than fossil fuels in Singapore because many of its positive attributes, such as
improved reliability or security, were not valued [19]. The government has long adhered to an approach to energy and
electricity regulation that avoided promoting any single source of electricity. Singapore’s electricity market framework has
attempted to ensure a ‘level playing field’ for all types of generation technology and fuel mixes. Central to this strategy is
ensuring that the wholesale and retail electricity markets are competitive, and that the markets harness competition to drive
down costs through improvements in innovation and efficiency. Both the electricity and natural gas markets are liberalized, an
80
Economics and Environment
1800
2500
2000
1400
1200
1500
1000
800
1000
600
400
500
Total installed PV capacity (in kWp), line graph
Annual installed PV capacity (in kWP), bar graph
1600
200
0
0
2005
2006
2007
2008
2009
Figure 4 Annual and total installed PV capacity in Singapore, 2005–09. Source: Sovacool BK.
environment spurred by several important acts of legislation (including the Energy Market Authority of Singapore Act, the Gas
Act, and the Electricity Act).
The 2001 Energy Market Authority of Singapore Act formally established (perhaps unsurprisingly) the Energy Market
Authority (EMA), a statutory board in charge of regulating the electricity and gas markets in Singapore and promoting
competition in these markets. Singapore’s big three power companies – PowerSeraya, Senoko Power, and Tuas Power – were
also all divested to the Singapore government’s investment arm Temasek Holdings [18]. The EMA aims to protect the
interests of consumers with regard to prices, reliability, and quality of electricity supply and services and performs the
functions of economic and technical regulator. The EMA also promotes economic efficiency in the electricity industry and
oversees a regulatory framework for the electricity industry that promotes competition and fair and efficient market conduct.
The 2001 Gas Act extended EMA oversight to cover the shipping, retailing, management, and operation of natural gas and
liquefied natural gas facilities. The 2001 Electricity Act, the most sweeping of the three, restructured the retail market for
electricity, began the process of privatizing government-owned electric power plants, and encouraged private investment in
the electricity sector.
Informally, while Singaporean regulators have added a host of voluntary agreements, two are the most notable: The Singapore
Green Plan 2012 and the National Climate Change Strategy. The Singapore Green Plan 2012 focuses on promoting cleaner power
plants, refineries, and vehicles as a way to improve ambient air quality. It sets voluntary standards to reduce energy consumption,
states the government’s preference for cleaner forms of electricity supply, and publicizes the importance of recycling and maintain
ing air pollution levels within ‘good’ ranges at least 85% of the year. The government has also formulated a progressive National
Climate Change Strategy noting the importance of a variety of different mechanisms, ranging from energy audits and appliance
standards to managing traffic congestion and improving the fuel economy of vehicles, to cut energy use and greenhouse gas
emissions [20].
In terms of explicit support for solar PV, the SCS and Clean Energy Research and Test-bedding (CERT) program have been the
most direct and influential followed by the creation of a clean energy research program and a clean energy program office (CEPO),
along with a host of peripheral policies and programs.
1.06.3.2.1
Solar capability scheme
The SCS is a $20 million fund for nongovernment projects that provides a grant worth 30–40% of the capital cost for solar PV
systems meeting formal criteria. It is capped at $1 million per project and requires that the building must achieve at least a Green
Mark Gold certification by the Building Construction Authority, who recently introduced a Green Mark Scheme for landed
properties. A minimum size of 10 kWp is required, putting it out of reach of most homeowners wanting to dabble in small-scale
systems, but it has attracted many developers for commercial, industrial, and large-scale residential projects such as condominiums.
Table 2 presents a list of solar projects funded by SCS to date [21].
Feed-In Tariffs and Other Support Mechanisms for Solar PV Promotion
Table 2
1.06.3.2.2
81
Solar projects funded by the SCS, 2008–09
Name
Building type
System size
(kilowatt-peak)
Applied materials manufacturing facility
CDL Tampines Grande
Lend Lease Retail 313@Somerset
Lonza Biologics manufacturing facility
Robert Bosch Southeast Asia HQ Building
Industrial
Commercial
Commercial
Industrial
Commercial
366
107
76
181
88
Clean energy research and test-bedding program
The CERT allocates $17 million to test-bed and integrate clean technologies making Singapore a ‘field laboratory’. It was launched in
August 2007 and primarily supports projects involving buildings and facilities of government agencies. It has so far funded a
sizeable number of solar projects over the course of 2007–09, as described in Table 3. As of December 2009, the scheme has been
fully apportioned.
1.06.3.2.3
Clean energy program office
Regulators established the CEPO as Singapore’s key interagency working group responsible for planning and executing Singapore’s
strategy to become a clean energy hub. It was created in April 2007 to coordinate various research and test-bedding programs,
including those of the National Research Foundation and Research, which identified clean energy as a key growth area for Singapore
and announced a target of generating $1.7 billion of added value and 7000 jobs by 2015.
1.06.3.2.4
Clean energy research program
The clean energy research program has budgeted $170 million to accelerate R&D efforts to support the expansion of a clean energy
industry in Singapore. It is a competitive funding initiative aimed at supporting ‘upstream’ and ‘downstream’ research efforts
through demonstration projects. Most research projects to date have included a focus on solar energy, and $25 million has so far
been awarded to research teams exploring thin-film PV and high-efficiency concentrator cells.
1.06.3.2.5
Other efforts
Indirect support for solar PV comes from a variety of areas, including BCA’s Green Mark Award, which awards up to 20 bonus points
for new commercial buildings that include solar PV. The EMA’s Market Development Fund (MDF) also allocates $5 million to
facilitate test-bedding of clean energy systems including solar PV, with support given for 5 years per project. The EMA and Building
Construction Authority have also featured a series of PV system handbooks aimed at informing installers and homeowners about
solar energy (see Figure 5).
Desiring to further support research on solar PV, the government launched the SERIS and hired Prof. Joachim Luther, former
director of the Fraunhofer Institute for Solar Energy Systems in Germany, to lead it. SERIS will conduct industry-focused and
application-oriented research on solar energy, aiming to become a ‘world class’ institute by working at the nexus of science and
industry.
There is some evidence that these efforts are beginning to pay dividends. In January 2008, Oerlikon, the Swiss-based supplier of
thin-film manufacturing equipment, chose to locate its Asian manufacturing hub in Singapore, and Norway’s Renewable Energy
Corporation (REC) has committed to establishing the largest solar manufacturing complex in the world there. The first phase of the
REC facility involves $3 billion in investment and 1300 employees, and it will be producing silicon wafers, solar cells, and solar
Table 3
Solar projects funded by CERT
Name
System size
(kilowatt-peak)
BCA Zero Energy Building
HDB Sembawang and Serangoon North
NParks Gardens by the Bay
PUB Marina Barrage
Singapore Polytechnic
Changi Airport Budget Terminal
Khoo Teck Puat Hospital
Ngee Ann Polytechnic
NEA Meteorological Services Building
190
146
TBC
70
47
250
150
14
25
TBC, to be confirmed.
82
Economics and Environment
Figure 5 Various Singapore handbooks for solar PV systems.
modules in early 2010. Once it is fully scaled up, REC intends to manufacture 1.5 GW of solar products in Singapore each year for
global markets. The managing director of the Economic Development Board is hoping that the REC project will be “a queen bee to
attract a hive of solar activities to Singapore” [22].
1.06.3.3
Challenges and Prospects for the Future
One challenge to solar PV penetration in Singapore is that the government is somewhat committed to fossil fuels. Singapore consumed
763 000 barrels of oil per day in 2005 but hosted crude refining capacity of 1.3 million barrels per day, making it one of the biggest
refiners of oil in the world. In addition to three large refineries (ExxonMobil’s Jurong/Pulau Ayer Chawan facility, Royal Dutch Shell’s
Pulau Bukom complex, and Singapore Petroleum Company’s Pulau Merlimau refinery), Singapore also stores 112.4 billion barrels of
oil and hosts the regional headquarters for many large oil companies. This has precipitated a general agreement amongst policymakers
that oil and gas are intertwined with Singapore’s future. When asked why Singapore has not decided to push more heavily for solar
energy in 2008, one official working for the energy division of the Ministry of Trade and Industry explained that
the core reason is economics. Gas-fuelled power generation is more competitive than oil-fired power generation (the primary source of electricity in
Singapore before we started to switch to gas). Large scale renewable energy is not available to Singapore. Solar power is viable, but there are cost and
technological issues, besides the issue of scale too. Coal power is cost competitive, but the environmental concerns need to be addressed. Therefore, we
firmly believe fossil fuels will continue to be the best options for Singapore
(Research Interview at the Energy Division of the Ministry of Trade and Industry, 10 June 2008).
A secondary challenge concerns existing excess electricity capacity. Singapore only uses about 5200 MW worth of power plants to
generate most of its power but has more than 10 200 MW installed. (Put another way, roughly 57% of capacity does not operate
continually.) Because current installed electricity capacity in Singapore far exceeds existing peak demand, less incentive exists to
push solar PV and other alternatives. Part of this is connected to the Asian financial crisis of 1997. Before the crisis, power plant
operators, government planner, and nearly everyone else expected the Singaporean economy to grow much more rapidly than it did
Feed-In Tariffs and Other Support Mechanisms for Solar PV Promotion
83
(along with almost every other Southeast Asian economy). Thus, developers committed to building a large amount of electricity
capacity that was completed but has not yet been needed. If all existing power plants are taken into account, and assuming that
electricity demand grows at a rate of 5% yr−1, Singapore will not need to build any new capacity until about 2018. Given that a
power plant that is already built is usually cheaper than one you have to build, such a large amount of excess capacity serves as a
disincentive toward investing in more electricity supply, including solar PV and BIPV.
Third, the Singaporean government is generally wary of subsidies and support schemes. As one energy consultant working in
Singapore explained, “there is a general belief in this country that decisions about energy should be left to the market, and that the
market knows best” (Research interview with Andrew Symon, Asia Director for Menas Associates, 11 October 2008). As one
executive of a solar company puts it (anonymous source)
Many senior Singaporean policymakers recognize the potential of clean energy technology, and realize that PV is the best one applicable for Singapore.
They understand that it needs some incentives to get going, because it is not yet ready to compete against established fossil-fuel based power generation.
They suspect that feed in tariffs are the most efficient way of administering support because they replicate post-grid-parity market conditions and
minimize government interference in the procedure. But they are not yet convinced enough of the short, medium and long-term economic value for
Singapore to make a strong case for feed-in tariffs and the like. More conservative officials cannot let go of 1980s ideology that relies on pure market
forces. They are prepared to be ‘technology blind’ and remove almost all administrative barriers to connecting solar PV units to the grid. But they refuse
on principle to contemplate subsidizing it in any way, because that would violate their golden principle of not distorting the market. Never mind that
the ‘distortion’ would be too small to measure, or could even bring net benefits to Singaporean customers and businesses.
The government is also hesitant to raise electricity prices through an FIT or other types of support schemes, since electricity rate
increases are seen to hurt low-income families the hardest and to potentially jeopardize political relationships with Singaporean
middle-class voters [23].
Overall, then, the future of solar PV in Singapore is uncertain. They have done an exceptional job attracting investments in solar
PV manufacturing and in growing the local PV market from a few kWp in 2005 to 2000 kWp in 2009. Yet the government still lacks
any type of sustained target for solar PV or renewable energy and has no FIT. The key challenge seems to be how to deploy more PV
in Singapore and create incentives for residential and commercial users without raising electricity prices or creating subsidies. In the
absence of any such support, it will remain unlikely that solar PV can compete commercially with conventionally generated
electricity and unlikely to be widely embraced.
1.06.4 United States
1.06.4.1
Introduction
Installed cost (2008$/WDC)
The market for solar photovoltaics in the United States is somewhat mixed. The US market is the fourth largest in the world, and the
US Department of Energy (DOE) estimates that 65–75% of US water heating and about half of residential space heating needs could
be met with solar-based energy [24, 46]. The DOE also estimates that solar PV erected on just 7% of the country’s available roofs,
parking lots, highway walls, and buildings (without substantially altering appearances or requiring currently unused land) could
supply every kWh of the nation’s current electricity requirements [26]. However, most PV capacity in the country is not integrated
into buildings or configured for homes, but owned and operated by utilities and power providers in large and centralized
installations, and more than 75% of US market for solar PV is in one state, California [27]. Although Figure 6 shows that
$16
Capacity-weighted average
$14
Simple average +/– Std. dev.
$12
$10
$8
$6
$4
$2
$0
1998
1999
2000
2001
2002
2003
2004
2005
2006
2007
2008
n = 39 n = 180 n = 217 n = 1308 n = 2489 n = 3526 n = 5527 n = 5193 n = 8677 n = 12 103 n = 3 097
0.2 MW 0.8 MW 0.9 MW 5.4 MW 15 MW 34 MW 44 MW 57 MW 90 MW 122 MW 197 MW
Installation year
Figure 6 Installed solar PV costs in the United States, 1998–2008. Wiser R, Peterman GBC, and Darghouth N (2009) Tracking the Sun II: The installed
cost of solar photovoltaics in the United States from 1998 to 2008. LBNL–2674E, February. Berkeley, CA: Lawrence Berkeley National Laboratory [28].
84
Economics and Environment
installation costs for solar PV systems in the United States have declined over time [28], the country has a total capacity of
grid-connected solar of 478 MW, more than 100 times less than Germany [29].
1.06.4.2
Existing Support Schemes
Fixed-price incentives for solar energy have been around since the 1970s, although these early programs do not closely resemble
modern FITs. The two most commonly mentioned historical policies are the Public Utility Regulatory Policies Act (PURPA) of 1978
and standard offer contracts in California.
As a consequence of the oil crises of the 1970s, PURPA was one of five statutes that were included in President Jimmy Carter’s National
Energy Plan as an attempt to reduce US dependence on foreign oil and vulnerability to supply interruptions and to develop renewable
and alternative sources of energy. (For excellent summaries of PURPA, see References 30–32.) After the passage of PURPA, electricity
suppliers were no longer able to hold a monopoly over power generation. PURPA enabled new actors, such as small power producers or
‘qualifying facilities’, to generate electricity on their own and forced the incumbent utilities to purchase this power at a reasonable fixed
rate based on the ‘avoided costs’ to the utility. PURPA was a breakthrough in the sense that it opened the door to nonutility producers of
power, although it did not catalyze widespread use of renewables because the ‘avoided costs’ were still too low, often ranging from a mere
2–5 ¢ kWh−1. Despite its limitations, PURPA was perhaps the first major piece of legislation to offer a fixed payment to small-scale
renewable power producers, and from 1980 to 1992 (before the next major legislative act relating to electricity was passed), about
40 000 MW of nonutility generating capacity was added to the country’s grid [33]. The state of California, for example, implemented
PURPA through standard offer contracts that saw the addition of 1200 MW of wind capacity between 1984 and 1994 [34].
Other states and utilities throughout the country have since experimented with ‘performance-based incentive payments’ to
promote renewable electricity. Among the truly massive number of programs, the most significant ones are presented in Table 4; the
programs were responsible for installing more than 52 000 systems constituting 566.3 MWp of capacity from 1998 to 2008. As just a
few examples, Minnesota passed its ‘Community-Based Energy Development Proposal’ in 2005 to allow utilities to give wind
projects within the state 5.5 ¢ kWh−1, and the state of Washington signed a solar PV program into law that pays as much as
Table 4
Summary of state-level PV incentives in the United States [35]
State
PV incentive program
AZ
APS Solar & Renewables Incentive Program
SRP EarthWise Solar Energy Program
Anaheim Solar Advantage Program
CEC Emerging Renewables Program
CEC New Home Solar Partnership
CPUC California Solar Initiative
CPUC Self-Generation Incentive Program
LADWP Solar Incentive Program
Lompoc PV Rebate Program
SMUD Residential Retrofit and Commercial PV
Programs
Governor’s Energy Office Solar Rebate Program
CCEF Onsite Renewable DG Program
CCEF Solar PV Program
MRET Commonwealth Solar Program
MEA Solar Energy Grant Program
MSEO Solar Electric Rebate Program
NJCEP Customer Onsite Renewable Energy
Program
NJCEP Solar Renewable Energy Credit Program
NPC/SPPC RenewableGenerations Rebate
Program
NYSERDA PV Incentive Program
ODOD Advanced Energy Fund Grants
ETO Solar Electric Program
SDF Solar PV Grant Program
RERC Small Scale Renewable Energy Incentive
Program
Klickitat PUD Solar PV Rebate Program
Port Angeles Solar Energy System Rebate
Focus on Energy – Renewable Energy
Cash-Back Rewards
CA
CO
CT
MA
MD
MN
NJ
NV
NY
OH
OR
PA
VT
WA
WI
Total
No. of
systems
Total
MWp
912
346
69
27 947
539
11 533
796
1 463
5
170
6.2
1.7
0.3
146.4
1.6
146.7
144.9
17.6
0.02
1.0
16
66
557
1 091
230
145
3 167
% of Total MWp
(%)
Size range
(kWp)
Year range
1.1
0.3
0.1
25.9
0.3
25.9
25.6
3.1
0.0
0.2
0.4–255
0.7–36
1.4–18
0.1–670
1.3–92
1.2–1308
33–1239
0.6–1200
3.0–5.3
1.3–97
2002–08
2005–08
2001–08
1998–2008
2007–08
2007–08
2002–08
1999–2008
2008–08
2005–08
0.1
5.6
3.1
8.1
0.8
0.5
54.2
0.0
1.0
0.5
1.4
0.1
0.1
9.6
2.0–5.4
1.6–480
0.8–17
0.2–460
0.5–45
0.5–40
0.8–702
2008–08
2003–08
2005–08
2002–08
2005–08
2002–08
2003–08
58
393
8.4
2.0
1.5
0.3
1.0–1588
0.5–31
2007–08
2004–08
1 158
35
878
164
225
7.2
0.3
6.6
0.7
0.8
1.3
0.0
1.2
0.1
0.1
0.7–51
1.0–122
0.8–859
1.2–12
0.6–38
2003–08
2005–08
2003–08
2002–08
2004–08
5
2
386
0.01
0.004
1.7
0.0
0.0
0.3
0.3–3.0
1.4–2.7
0.2–38
2008–08
2007–08
2002–08
52 356
566.3
0.1–1588
1998–2008
100
Feed-In Tariffs and Other Support Mechanisms for Solar PV Promotion
85
54 ¢ kWh−1 to produce solar electricity. California piloted a modest PV tariff in 2005 of 50 ¢ kWh−1 (funded out of their systems
benefits charge), and Wisconsin, Vermont, and the Tennessee Valley Authority at the utility scale offer various types of fixed tariffs as
part of their green power programs at the utility scale [36–41].
These state programs, however, do not have the key components that other successful FIT schemes do. Many are not based on the
costs of solar energy generation and do not offer rates high enough to make investments in solar energy profitable. Most set caps on
project size or cost. The majority do not differentiate tariffs by size of the project or type of technology. They are usually voluntary
and do not guarantee access to the grid. And, crucially, they do not spread costs of the tariff amongst all customers, instead spreading
it only amongst those willing to pay a premium. The Minnesota tariff for wind energy, for example, was initially limited to 100 MW,
capped project size at 2 MW, did not have components guaranteeing interconnection and priority grid access, and did not mandate
that utilities have to offer it.
The most significant mechanisms for driving renewables in the United States in recent years have included three state mechanisms,
one federal mechanism, and one emerging tool: solar energy/portfolio standards, net metering, and green power programs at the state
or interstate level; tax credits at the national level. A fifth mechanism, FITs, is just beginning to emerge at the local and state level.
1.06.4.2.1
Renewable portfolio standards
RPSs, sometimes called ‘solar energy standards’ or ‘sustainable energy portfolio standards’, are mandates for utilities to source a
specific amount of their electricity sales (or generating capacity) from renewable sources (see References 42–44).
Efforts to mandate targets for renewable electricity generation at the federal level have been unsuccessful to date (as of printing).
But, as noted above, more than half of US states have enacted RPS laws. Iowa was the first US state to pass such a policy in 1985,
when legislation was enacted to
encourage the development of alternate energy production facilities and small hydro facilities in order to conserve our finite and expensive energy
resources and to provide for their most cost effective use [45].
The law mandated that utilities enter into power purchase agreements with solar energy producers and set the upper limit on
aggregate purchases of solar energy at 105 MW. As of March 2009, 30 states and the District of Columbia had adopted some form of
renewable electricity mandate or goal (Table 5).
Table 5
States with RPS, 2009
State
Amount
Year
Organization administering RPS
Arizona
California
Colorado
Connecticut
District of Columbia
Delaware
Hawaii
Iowa
Illinois
Massachusetts
Maryland
Maine
Minnesota
Missouri
Montana
New Hampshire
New Jersey
New Mexico
Nevada
New York
North Carolina
Ohio
Oregon
Pennsylvania
Rhode Island
Texas
Utah
Vermont
Virginia
Washington
Wisconsin
15%
20%
20%
23%
11%
20%
20%
105 MW
25%
4%
9.5%
10%
25%
11%
15%
16%
22.5%
20%
20%
24%
12.5%
12.5%
25%
18%
15%
5880 MW
20%
10%
12%
15%
10%
2025
2010
2020
2020
2022
2019
2020
Arizona Corporation Commission
California Energy Commission
Colorado Public Utilities Commission
Department of Public Utility Control
DC Public Service Commission
Delaware Energy Office
Hawaii Strategic Industries Division
Iowa Utilities Board
Illinois Department of Commerce
Massachusetts Division of Energy Resources
Maryland Public Service Commission
Maine Public Utilities Commission
Minnesota Department of Commerce
Missouri Public Service Commission
Montana Public Service Commission
New Hampshire Office of Energy and Planning
New Jersey Board of Public Utilities
New Mexico Public Regulation Commission
Public Utilities Commission of Nevada
New York Public Service Commission
North Carolina Utilities Commission
Public Utility Commission of Ohio
Oregon Energy Office
Pennsylvania Public Utility Commission
Rhode Island Public Utilities Commission
Public Utility Commission of Texas
Utah Department of Environmental Quality
Vermont Department of Public Service
Virginia Department of Mines, Minerals, and Energy
Washington Secretary of State
Public Service Commission of Wisconsin
2025
2009
2022
2017
2025
2020
2015
2025
2021
2020
2015
2013
2021
2025
2025
2020
2020
2015
2025
2013
2022
2020
2015
86
Economics and Environment
Early RPS mandates were intended to promote the development of solar energy technologies and diversify the fuels that America
relies on for generating its electricity. As with other solar energy support mechanisms, policymakers meant for these regulations to
correct three major failures of the existing market for electricity fuels: (1) electricity prices do not reflect the social costs of generating
power; (2) energy subsidies have created an unfair market advantage for conventional fuels and technologies; and (3) solar energy is
a ‘common good’ and thus is subject to a ‘free rider’ problem, enabling society at large to benefit from the investments of individuals
without paying for them.
RPS policies provide electric utilities with choices similar to the way emissions control strategies implemented in the 1970s and
1980s worked to reduce lead pollution from refineries and chlorofluorocarbons from aerosols and in the 1990s lowered nitrogen
oxide and sulfur dioxide emissions. Cap-and-trade policies set an upper limit for emissions for a given time period and emission
limits declined over time. Polluters could either reduce their own pollution or buy certificates that represented emissions reductions
beyond mandated targets. In a similar way, an RPS allows generators to generate their own solar energy, purchase solar energy from
others, or buy credits. It therefore blends the benefits of a ‘command and control’ regulatory paradigm with a ‘free’ market approach
to environmental protection.
While RPS mandates have done much to stimulate a market for renewable resources and spur additional research, they are not
without problems. Impacts have varied from state to state depending on policy design and implementation, including what share of
the market is affected and the existence or level of penalties for noncompliance. In addition, uncertainty about the bidding process
and the future value of solar energy credits can increase risk for investors. RPS systems are best suited for large centralized plants, and
they tend to promote the cheapest, most mature technologies (which is why some states have recently adopted solar ‘carve-outs’,
see, e.g., [46]).
1.06.4.2.2
Net metering
Net metering enables owners of grid-connected renewable electricity systems to be credited for the electricity that they provide to the
grid – in effect, to spin their meters in reverse. As of March 2009, net metering was available in 44 states plus Washington, DC (Note
that four of these states have net metering programs that are offered voluntarily by one or more electric utilities.) [47]. Most states
limit the aggregate capacity to a small percentage of a utilities’ peak load. Also, in most states, producers are credited only up to the
amount of electricity that they consume; any excess beyond the level of consumption goes to the utility. However, net metering has
played a significant role in encouraging investment in distributed solar energy systems. Under two of the most successful net
metering regimes, customers in California and New Jersey had installed more than 20 000 and 3000 distributed solar systems,
respectively, by early 2008. Net metering has been described as “providing the most significant boost of any policy tool at any level
of government…to decentralize and ‘green’ American energy sources” [48]. By compensating customers for reducing demand and
sharing excess electricity, net metering programs are powerful, market-based incentives that states have utilized to promote solar
energy.
One recent evaluation of state net metering programs found that the most successful programs did not set limits on maximum
system capacity or restrictions on eligible renewable resources. These programs required that all utilities participate and included
all classes of customers. They went hand-in-hand with interconnection standards and had little to no application fees, special
charges, or tariffs [49]. As expected, since not all net metering programs meet these requirements, their effectiveness varies from
state to state.
In addition, most metering programs only allow a ‘credit’ equivalent to the price of conventional electricity, therefore failing to
reflect the full environmental benefits of solar energy. While net metering does tend to stimulate deployment of distributed solar
energy systems at the residential and commercial scale, it does virtually nothing to promote large solar energy power plants. In no
country has net metering managed to bring about a substantial shift in overall capacity to renewable resources. The explanation may
be that the investment security for solar energy producers is relatively low compared with the fixed rates offered by FITs. We do not
recommend linking the remuneration of solar energy projects to electricity prices because these prices will fluctuate. Net metering
does not reduce or eliminate this form of uncertainty and volatility.
1.06.4.2.3
Green power programs
As of September 2008, more than 850 utilities in 40 states offered some type of green power program. While the numbers vary based
on who does the counting, about 850 000 residential and commercial customers participated in these green power programs and
purchased 18 TWh of electricity in 2007. Top municipal buyers of ‘green power’ included the city of San Diego, Austin Independent
School District, and buying groups in Montgomery County, Maryland, New York State, and East Bay Municipal Utility District in
California. Top commercial purchasers were the US Air Force followed by a list that includes Whole Foods Market, Johnson &
Johnson, Starbucks, HSBC North America, University of Pennsylvania, and the World Bank Group.
Green power programs have two primary strengths. First, they have the advantage of allowing customers in places that do not
have significant renewable resources to support the development of solar energy technologies elsewhere. Second, they do not
impose the costs of solar energy on those that do not wish to pay for them.
These strengths, however, are offset by substantial weaknesses. First, green power marketing schemes provide no guarantee that
additional solar energy capacity will be built. The most common experience with green power programs growing rapidly has been
for program sponsors to cap or limit the program, not build more capacity. In 2005, for example, Xcel Energy and Oklahoma Gas &
Electric quickly and fully subscribed their green power programs but then had to refuse to let additional customers participate.
Feed-In Tariffs and Other Support Mechanisms for Solar PV Promotion
Table 6
87
Number of utility green power participants for the 10 most successful programs, 2008
Rank
Utility
Program(s)
Participants
1
Xcel Energy
71 571
2
Portland General Electric
3
PacifiCorp
4
5
6
7
8
9
10
Sacramento Municipal Utility District
PECO
National Grid
Energy East (NYSEG/RGE)
Puget Sound Energy
Los Angeles Department of Water & Power
We Energies
Windsource
Solar Energy Trust
Clean Wind
Green Source
Blue Sky Block
Blue Sky Usage
Blue Sky
Habitat
Greenergy
PECO WIND
GreenUp
Catch the Wind
Green Power Program
Green Power for a Green LA
Energy for Tomorrow
69 258
67 252
45 992
36 300
23 668
22 210
21 509
21 113
19 615
Similarly, Austin Energy was forced to implement a lottery when its GreenChoice product fell below standard electricity rates [50].
The lesson seems to be that green power program managers have little incentive to improve or expand their programs if they are
already receiving a stable revenue stream from customers.
Second, green power programs rarely represent a significant fraction of energy use or electricity sales. For those programs run by
electric utilities, participation rates rarely exceed 5%, and the most popular programs have never exceeded 20% [51]. Green power
programs, in other words, are being used by a very small fraction of customers. In 2008, the top 10 largest green power programs,
the ones with the highest participation rates, had only 398 488 customers enrolled (see Table 6). This number may sound
impressive, but it represents less than half a percent of the nation’s 120 million residential electricity customers. The problem
here is that because green power programs are not mandatory, customers can opt for dirty and conventional electricity at cheaper
rates and ‘free ride’ on the environmental benefits provided by those actually subscribing to the programs [52].
Third, green power programs, because they try to avoid charging consumers too much, tend to promote only the lowest cost
renewable resources. Indeed, the programs in the United States have almost exclusively promoted large-scale wind farms, but not
distributed solar panels, small-scale wind turbines, or other alternatives. In Europe, voluntary markets for green power have been
primarily based on cheap hydroelectric power mostly produced and certified in Scandinavian countries and sold in central
Europe.
Fourth, and ironic given the point above about keeping costs low, green power programs do tend to be more expensive than
other policy mechanisms. This is because the programs need firms to certify credits, match buyers with sellers, track trades, and
ensure no ‘double counting’ occurs (i.e., that the same credit is not used more than once). Some of these problems are discussed
further below when talking about solar energy credits, but these extra transaction costs do add to the expense of green power
programs. In 2009, for example, the average purchase price for wind electricity from a green power program in the United States was
9.1 ¢ kWh−1 [53] when the US DOE reports that the average cost of producing and transmitting that electricity was less than
7.0 ¢ kWh−1 [54]. This implies an extra cost of about 2 ¢ kWh−1 merely to manage the program.
Unfortunately, these extra costs mean green power programs are also the first to be cut during economic downturns. From 2007
to 2008, when the global economy was relatively healthy, local governments and municipalities increased their green power
purchases by 200 GWh. From 2008 to 2009, in the midst of the global financial crisis, they increased their purchases by only
17 GWh. The City of Durango, Colorado, for example, used to buy electricity for all government buildings from green power
programs, but the City Council canceled the program in 2009 to revert to electricity from coal plants to save money.
1.06.4.2.4
Tax credits
At the federal level, most support for solar energy has come in the form of investment and PTCs. ITCs provide a partial tax write-off
to those who invest in a particular solar energy technology. PTCs, by contrast, provide the investor or owner of a qualifying property
with an annual tax credit based on the amount of electricity generated by the facility during the course of a year. In the United States,
this credit has been available to eligible wind, hydro power, landfill gas, municipal solid waste, and biomass facilities [35, 55].
The ITC currently covers up to 30% of the cost of a commercial solar or wind project and 10% of the cost of a geothermal project.
It has tended to favor commercial installations. From the start of the credit until 31 December 2008, the ITC in the United States
capped residential investments in solar energy at $2000 but had no upper limit for commercial installations, creating an asymmetry
that heavily favored centralized and large-scale projects [56].
One drawback is that many homeowners and manufacturers lack sufficient income to use the ITC efficiently, since they must
have all of the capital up-front for investment and can only claim the credit when filing for taxes [57]. Perhaps because of these
reasons, ITCs have played a supplemental, but by no means primary or driving role in investment in solar PV [58].
88
Economics and Environment
In 2008, the PTC reduced the price of renewable electricity by about 2 ¢ kWh−1 (the initial credit was 1.5 ¢ kWh−1, inflation
adjusted) on a 20-year basis, in order to make investments in solar PV more attractive. To accomplish this incentive, however, the
PTC also imposes a cost to US taxpayers in the form of displaced tax revenue. PTC disbursements amounted to about $4 million in
1995 but more than $210 million in 2004, and wind projects accounted for about 90% of all PTC-related tax credits [59]. A second
shortcoming is that 90% of these expenditures were for one technology, wind, implying that the PTC does not promote
diversification of the renewable resource base or investments in solar energy.
1.06.4.2.5
Feed-in tariffs
As of mid-2009, discussions for comprehensive FIT programs at the legislative or regulatory level were occurring in no less than 18
states (Figure 7): Arkansas, California, Florida, Hawaii, Illinois, Indiana, Iowa, Maine, Michigan, Minnesota, New Jersey, New
Mexico, New York, Oregon, Rhode Island, Vermont, Virginia, and Washington.
The only formal FITs in the United States as of May 2009 were in Gainesville, Florida, and the state of Vermont. In Florida, the
board of directors for the regional utility, the Gainesville City Commission, unanimously approved the creation of ‘Solar Energy
Purchase Agreements’ in February 2009. The Gainesville FITs give eligible small solar projects (below 25 kW) 32 ¢ kWh−1 for the
electricity they export to the grid and larger ground-mounted projects (greater than 25 kW) 26 ¢ kWh−1, and they guarantee the rate
for 20 years. Under the program, Gainesville regional utilities will purchase all of the electricity produced by these systems and then
sell it back to residential and commercial customers for 12 ¢ kWh−1. The tariff of 32 ¢ kWh−1 was designed to give investors in solar
energy a 5% return on investment for larger projects. The difference in cost between the two tariffs will be paid for by all Gainesville
utility customers, and it is expected that the extra costs will not exceed $4–5 per month (less than a large cup of Starbucks coffee;
correspondence with Gainesville regional utilities official, 10 May 2009). The only caveat is that the Gainesville FIT does set a cap on
total installations at 4 MW yr−1, and even though the utility only serves 90 000 customers, the FIT has already been fully subscribed
(Wilson Rickerson, correspondence with author, 22 May 2009) [60]. According to officials at Gainesville regional utilities, as of
April 2009 the utility had received applications for more than 40 MW of solar PV capacity in their service area and have more or less
booked projects through 2012 (Toby Courtre, correspondence with one of the authors, 24 May 2009).
Vermont became the first state to implement a full system of FITs in late May 2009, when they passed legislation (H. 446)
altering the state’s Sustainably Priced Energy Enterprise Development Program, or SPEED. The changes to SPEED provide FITs
intended to cover generation costs plus a reasonable profit, with the costs of the program distributed by Vermont electricity
ratepayers. The Vermont FITs provide long-term contracts for 20 years and provide a specific tariff for small-scale wind turbines less
States with
pending FIT
legislation
States with pending
regulatory
initiatives for FITs
States with
both types of
pending action
States with
actual FITs
Figure 7 Locations in the United States with FIT legislation and/or regulatory initiatives (as of 2009).
Feed-In Tariffs and Other Support Mechanisms for Solar PV Promotion
Table 7
89
Vermont’s recently enacted FITs
Program cap
Project size cap
Contract term
Rate of return
Program evaluation
Specific tariffs
Wind energy < 15 kW
Wind energy > 15 kW
Landfill and biogas
Solar
50 MW
2.2 MW
20 years
Profit set at same rate of return for Vermont electric utilities
Every 2 years
20 ¢ kWh−1
14 ¢ kWh−1
12 ¢ kWh−1
30 ¢ kWh−1
than 15 kW (see Table 7). Tariffs are differentiated by technology and size, and the program will be reviewed periodically. The FIT
legislation instructs the Vermont Public Service Board to review and reset the tariffs every 2 years to keep the program efficient. The
executive director of Vermont, one of the groups that campaigned for the FITs, argued that “this law puts Vermont in a leadership
role on solar energy policy and will help to bring vibrant growth and development to our local solar energy industry” [61].
State and city action has so far not been matched by serious commitment in the US Congress for an FIT at the federal level. In
March 2008, representative Jay Inslee from Washington introduced a proposal for a national FIT under legislation named the ‘Clean
Energy Buy-Back Act’, which was later renamed as the ‘Solar energy Jobs & Security Act’ (HR 6401) in June 2008. Inslee’s proposal
was backed by more than 70 solar energy companies and organizations, but never even passed committee in the US House of
Representatives. Another federal bill was introduced in 2009 but would create tariffs below the avoided cost of generating electricity,
hardly an FIT by our standards. Hopefully, as more cities and states enact their own FITs in the United States, that will start to
change.
1.06.4.3
Challenges and Prospects for the Future
One challenge to investments in solar PV in the United States is the mismatch between government programs. For instance, federal
research on solar energy systems has focused on centralized, large-scale, and utility-owned technologies whereas legislation has
advanced decentralized, small-scale, and independently owned technologies. Legislations including the 1935 Public Utility Holding
Company Act (PL 74-333), 1980 Wind Energy Systems Act (PL 96-345), 1984 Solar Energy Industry Development Act (PL 98-370),
and provisions of the Energy Policy Act of 1992 (PL 102-486) were allowed to expire or never fully implemented. One study found
that energy policy in the United States was the most inconsistent out of a sample of 17 countries [62].
Also, incentives for community ownership are largely absent in the United States. Large, investor-owned utilities and companies
operate most of the country’s renewable electricity capacity, and less than one-in-ten solar systems are used by ordinary people.
Indeed, one recent study from the National Solar Energy Laboratory on the effectiveness of policy mechanisms for residential solar
panels argued that policies have been completely ineffective at promoting small-scale, residential applications [63]. The United
States also does not generally permit open market entry and access. Utilities and transmission operators have been able to oppose
independent interconnection or access to the grid without extensive feasibility studies or exorbitant insurance rates.
As a broader financial constraint on the rapid uptake of solar PV in the United States, many homeowners simply do not have the
resources to purchase their own solar panel. Connected to lack of capital is a concept known as the discount rate, or how consumers
make investment decisions when they do have capital available. One study found a general aversion against solar PV systems in the
housing market for precisely these reasons [64]. Such systems greatly add to the initial cost of purchasing a home. Moreover, when
times are good and houses are selling well, builders and real estate agents view it as an indicator that alternative energy technologies
are not needed to make sales. When times are bad, they place even more emphasis on minimizing costs and keeping house prices
low. Homeowners also worry about project delays (and thus rising costs) associated with PV availability, installation scheduling,
and utility interconnection. Builders believe that most homebuyers are not interested in PV, given its extra cost, and that many may
even be opposed to it for concerns of aesthetics, maintenance, or reliability.
A recent 2008 study from the Harvard Business School is most telling here. After surveying hundreds of builders and contractors,
given an extra $10 000 in construction budget to spend on discretionary items, more than 25% interviewed said they would do
granite countertops while less than 15% said solar panels. The reasons had to do with the fact that granite countertops were
perceived as less risky and more visible than solar panels [65]. The survey also found that consumers had unrealistic expectations
about payback, many expecting a $4000 investment in solar PV to save more than 50% on monthly utility bills (when in reality it
would tend to save 10–15%).
Political and regulatory obstacles play a role as well. One in-depth study of the ‘red tape’ involved in renewable energy projects
found that systems installers frequently faced planners and building inspectors with little to no experience permitting solar PV
systems [66]. The study noted that complex permitting requirements and lengthy review processes result in project delays and
substantially add to the costs of projects. Multiple permitting standards across jurisdictions, such as competing or convoluted city,
county, state, and national building codes, only add to the complexity. The study concluded that “these remaining bureaucratic
90
Economics and Environment
hurdles stymie efforts by homeowners and business owners to install systems and hinder development of a national market for
distributed renewable energy systems” [60].
1.06.5 European Union (Germany and Spain)
1.06.5.1
Introduction: Europe
Renewable energy promotion is at the core of EU energy policy in the twenty-first century. The European Union boasts the leading
market for solar PV worldwide. There, legislation to increase the share of renewable energies was first implemented in the electricity
sector. In 1996, the legislative process was initiated by the European Commission with the green paper on renewable energies [67]
and the respective white paper a year later [68]. In the following years, a lengthy debate amongst the European institutions and the
member states postponed the implementation of a European Directive several times. Finally, in 2001, the first Directive on the
promotion of electricity produced from renewable energy sources (RES-e) was approved [69].
The Directive established indicative targets for all member states which amounts to the overall target of 21% of electricity
consumption by 2010. Despite earlier efforts, no consensus was reached on mandatory targets, which would have required penalties
in the case of noncompliance. This will be different under the new European Directive on renewable energies (2009/28/EC), which
is setting the legislative framework for the years 2010–20. Besides the fact that in contrast to the Directive 2001/77/EC, now all
sectors – electricity, heating/cooling, and transport – are included, the new Directive also includes mandatory national targets.
Targets have proven to be important, as they signal long-term political commitment to investors. They indicate that support
mechanisms will remain in place for a certain period of time and increase the likelihood of remuneration being sufficiently high.
Even though the Directive does not include specific targets for the electricity sector, member states will be obliged to issue
so-called national action plans, including sector-specific targets and policy measures that will be taken to achieve the targets [70]. In
line with the economic potential, the resource potential, and the already achieved potential, the European Commission has
proposed and set targets for the EU member states (see Table 8).
Table 8
Share of energy from renewable sources in EU member states (2005 and 2020 targets)
Belgium
Bulgaria
Czech Republic
Denmark
Germany
Estonia
Ireland
Greece
Spain
France
Italy
Cyprus
Latvia
Lithuania
Luxembourg
Hungary
Malta
The Netherlands
Austria
Poland
Portugal
Romania
Slovenia
Slovak Republic
Finland
Sweden
United Kingdom
Share of energy from renewable
sources in gross final consumption of
energy, 2005 (S2005)
(%)
Target for share of energy from
renewable sources in gross final
consumption of energy, 2020 (S2020)
(%)
2.2
9.4
6.1
17.0
5.8
18.0
3.1
6.9
8.7
10.3
5.2
2.9
32.6
15.0
0.9
4.3
0.0
2.4
23.3
7.2
20.5
17.8
16.0
6.7
28.5
39.8
1.3
13
16
13
30
18
25
16
18
20
23
17
13
40
23
11
13
10
14
34
15
31
24
25
14
38
49
15
Source: EU (2009) Directive 2009/28/EC of the European parliament and the council of 23 April 2009 on the promotion of the use of energy
from renewable sources and amending and subsequently repealing Directives 2001/77/EC and 2003/30/EC. Official Journal of the European
Union L 140/16 [70].
Feed-In Tariffs and Other Support Mechanisms for Solar PV Promotion
1.06.5.2
91
Support Mechanisms
Neither in the realms of the Directive 2001/77/EC nor during the negotiations of the current renewable energy framework Directive
2009/28/EC has consensus been reached on a harmonized European support scheme. According to the principle of subsidiarity,
member states, therefore, have the right to implement the support mechanism of their choice.
In the European Union, essentially two support mechanisms have been applied to foster the electricity generation from
renewable energy sources (RES-e): TGCs and FITs. The latter are currently established in 22 member states and are based on the
payment of a (fixed) tariff in combination with a purchase obligation (price-based support mechanism). Only six member states
make use of quota obligations. The FIT design in two especially successful countries will be discussed in the following section, the
case studies Germany and Spain.
Even though the development of solar PV in Germany and Spain largely depended on the establishment and amendment of
nationally implemented FITs in the 1990s and 2000s, market development was first stimulated by other support mechanisms.
Similar to Singapore and the United States, European countries started promoting solar PV with R&D initiatives and investment
subsidies. These were the primary support mechanisms for renewable electricity in the 1970s and 1980s. Especially in Germany,
solar PV profited from extensive market development programs, including investment subsidies and state-drive soft-loan programs.
The German 1000 roof program for photovoltaics from 1989 granted investment aid of 60–70% of total costs. It was successful
but did not lead to similar market development as in the case of wind energy because of the small market volume [72]. In January
1999, the new Red-Green coalition wanted to further enhance support for the PV market by setting up a 100 000 roof program. The
new program was intended to breach the time gap between the finalized 1000 roof program and a new FIT law. The program
intended to promote the installation of 100 000 photovoltaic plants with an average capacity of 3 kW. By those means, the installed
capacity was to increase to 350 MWp by 2003 [73]. The program consisted of preferential financing conditions for private persons,
self-employed people, and small and medium-sized companies. They were able to profit from a nominal interest rate of 1.9% p.a.
over 10 years. The maximum amount of credit was limited at €6.500 kW−1 [74].
Only in 2003, additional support mechanisms in terms of investment subsidies and soft loans faded out. At the same time, the
FIT level was increased significantly so that all costs could be covered by tariff payment alone. However, in the 1990s more and more
European countries moved toward FITs for promotion of renewable electricity – nowadays the major success factors for the leading
role of European countries in solar PV promotion. As FITs have proven to be the most successful support instrument, in the
following section we are going to explore general design features of successful FIT legislation, including specific examples from
Germany and Spain. (Further design options, which have not been implemented in Spain or Germany, will not be discussed in this
chapter. For a more detailed description of all FIT design options, including design options for developing countries and emerging
economies, see Reference 14.)
1.06.5.3
Germany
Germany was one of the first countries to set up an FIT scheme (only Portugal started at an earlier stage in 1988, see Reference 75)
and can therefore be considered a forerunner with respect to innovative renewable energy policy [76]. The country started its support
of electricity from renewable energy sources at the start of the 1990s. The Feed-in law (Stromeinspeisegesetz) established the major
characteristics of a German FIT policy: a fixed tariff payment and a purchase obligation on the grid operator. Thereafter, the policy
tool was amended several times. The FIT scheme was substantially changed in 2000 by passing the Renewable Energy Source Act
(Erneuerbare-Energien-Gesetz). Subsequently, the support mechanism was amended periodically, every 4 years, in 2004 and 2008.
The next amendment is expected to enter into force in January 2012.
Nowadays, Germany is the largest market for solar PV in terms of totally installed capacity. In 2008, the total installed capacity
increased by 1.9 GW to about 5.3 GW. In 2009, about 3.8 GW was added and in 2010 about 7.4 GW. As of January 2011, the total
installed PV capacity in Germany was about 17 GW – more than half of the worldwide installed capacity (see Figure 8; data based
on BMU [77]; BSW [78]; Fulton et al. [79]).
Besides a robust support mechanism, the German market also relies on good financing opportunities and low interest
loans provided by the state bank KfW, good availability of skilled PV companies, and a high degree of awareness of solar PV
technologies [80].
1.06.5.4
Spain
The first major impulse for the development of electricity generation from renewable energy sources in Spain derived from Law 82/
1980 on Energy Conservation [81]. The intention for promoting renewable energy sources at that time was clearly to diversify the
energy portfolio and to reduce energy import dependency. At that time, environmental issues did not yet influence the political
agenda in the energy sector [82].
The RD 2366/1994 on electricity produced by hydro sources, cogeneration, and RES [83] established basic contractual relations
between the RES-e producer and the distribution companies. The 1994 legislation can be considered being the first feed-in style
support mechanism in Spain. For the first time, fixed tariffs were set depending on technology and plant size. The technology
differentiation, however, was relatively modest. The RD 2366/1994 established one overall tariff for almost all renewable energy
technologies and a slightly lower tariff for biomass and municipal solid waste. The tariff payment was related to the average
92
Economics and Environment
18 000
16 000
14 000
12 000
10 000
8000
6000
4000
2000
1990
1991
1992
1993
1994
1995
1996
1997
1998
1999
2000
2001
2002
2003
2004
2005
2006
2007
2008
2009
2010
0
Figure 8 Installed solar photovoltaic capacity (MW) in Germany (1990–2010).
electricity price, which was established via a national decree on an annual basis. The RD 2818/1998 [84] can be seen as the turning
point in the Spanish RES-e policy, since for the first time all RES-e regulations were gathered in a single piece of legislation, including
fixed or premium tariffs for different technologies. (The Spanish FIT scheme only grants tariff payment for installations with a
maximum capacity of 50 MW. This limitation is historically grounded. In the past, it was believed that renewable energy could only
cover a small share of the electricity mix and that, by definition, renewable energy power plants had to be small-scale and
decentralized installations. The recent experience in many countries, however, contradicts these assumptions. Even though the
decentralized application is still one of the major advantages of renewable energies, the development in wind energy shows that
wind farms with several hundred megawatts of installed capacity are feasible and economically viable. Large-scale plants are also
expected for other technologies, such as PV, solar thermal, geothermal, and biomass)
A major revision of the Spanish FIT scheme took place in 2007. The RD 661/2007 was implemented after a lengthy debate
between various Spanish actors, including the Ministry, the renewable energy associations, and the National Energy Council CNE.
As a consequence, the decree entered into force almost 1 year later than expected [85]. The changes in the year 2007 have become
necessary because of the rapidly increasing share of renewable power. However, the growth of the renewable energy sector as a
whole was driven by very few technologies, mostly wind power. Other technologies, including biomass, biogas, and solar thermal
power, were still far from reaching the 2010 targets as set out in the Spanish renewable energy plan. Therefore, tariff for these
technologies needed to be increased.
In 2007, the target for solar PV set out in the National Renewable Energy Plan was reached. In September 2007, the MITYC issued
a resolution which prolonged the payment period of the tariff for 1 year [86] – as it was foreseen by the RD 661/2007. At the same
time, the Ministry of Industry started to work on transitional decree for the years 2008–10. Therefore, a new Royal Decree for solar
PV was issued in 2008. The new Royal Decree RD 1578/2008 attempted to slow down market expansion [87]. Within the previous
decree, the targets as set out in the Renewable Energy Plan PER have been exceeded by far. Under the new Royal Decree, tariffs for PV
were reduced by 20–30%.
In Spain, the market development is traditionally limited by short- and mid-term caps, for example, targets determined by the
National Plans for Renewables (PER). The Royal Decree for solar PV 1578/2008 has, for instance, limited newly installed capacity
to 500 MW annually, whereas 233 MW is reserved for free-standing PV systems. This annual cap is increased by 10% every year.
Even though Spain has a long tradition in regulating the newly installed capacity of renewable energy sources – the first national
plan for the development of renewable energy sources was issued in the 1990s – the Spanish renewable energy industry wanted to
avoid the cap by implementing flexible degression (see below). However, the tariff level, which in the case of some solar PV
applications offered internal rates of return far above the envisaged 7%, forced the legislator to take drastic measures to control
the costs by implementing a capacity cap (The Spanish Minister of Industry, Sebastián, stated that in 2008 alone, PV would cost
Spanish taxpayers €800 million. In 2009, the figure could rise to more than €1.3 billion, see Reference 88.). It has been estimated
that profits in Spain were about 50% higher than in Germany. Therefore, some observers have argued that the Spanish renewable
energy industry itself was partly responsible for the implementation of a cap by calling for the highest possible tariffs in the first
place [71].
Further changes were implemented in 2010 and came into effect in early 2011. Due to considerable cost reduction of solar PV
systems and modules, the legislator further reduced the tariff payment via RD 1565/2010. The tariff for small-scale, roof-mounted
systems was reduced by 5% and the tariff for larger-scale, roof-mounted systems by 25%. The remuneration for free-standing solar
PV systems was reduced by 45%. Besides, the legislator tried to further avoid windfall profits by limiting the number of operating
hours a PV producer is remunerated for. In very sunny areas, for instance, the maximum number of reference operating hours per
year has been fixed at 1232 equivalent hours per year. If a solar PV system in this area should produce more electricity, the exceeding
part will no longer be remunerated according to the FIT but instead according to the wholesale market price.
Feed-In Tariffs and Other Support Mechanisms for Solar PV Promotion
93
4500
4000
3500
3000
2500
2000
1500
1000
500
0
1990 1992 1994 1996 1998 2000 2002 2004 2006 2008 2010
Installed capacity (MW)
Figure 9 Installed solar PV capacity in Spain (1990–2010).
Still, at the end of 2008, the Spanish market was the second biggest worldwide. This was almost exclusively due to enormous
market growth rates in the years 2007 and 2008. In 2008 alone, the installed capacity increased by more than 2.5 GW, reaching
3342 MW by the end of 2008 (see Figure 9, data based on CNE 2011 (CNE publishes all data from the so-called special regime on a
monthly basis, see Reference 89)).
The extraordinary market growth in 2007 and especially 2008 was not only due to the high level of remuneration but also due to
market distortions caused by the capacity limit as set out by the National Renewable Energy Plan. (The Spanish experience with very
high growth rates of PV is also a showcase of ‘negative’ learning amongst European member states. A report of the French parliament
stated that the objective of the French support scheme should be to control the growth of the PV sector and avoid ‘anarchic growth’
as it was experienced in Spain in 2007 and 2008, see Reference 90.) There was literally a race in the construction of PV plants in order
to still be eligible under the significantly higher remuneration of RD 661/2007. An equity research institute estimated that the
Spanish FIT scheme is almost “twice the value of funds received under the German solar subsidy program” [91]. After the capacity
cap was reinforced in 2008, the market collapsed in 2009. Only 188 MW capacity was newly installed. In 2010, the Spanish market
grew by 661 MW.
1.06.6 Common Features of Best Practice Promotion Schemes
This part of the chapter identifies 11 common elements of best practice FIT promotion schemes. It draws largely from examples
from Germany and Spain, since these countries were amongst the first European countries to implement an FIT scheme. Following
Portugal in 1988, Germany implemented FIT legislation in 1990 and Spain followed 4 years later. Both countries are still operating
with this type of support instrument today and are therefore the two countries worldwide with the longest experience. (Other
countries that have implemented FITs before, like Portugal and Denmark, have also experienced with other support instruments
over the years.) Over the years – Germany is now working with an FIT mechanism for two decades – the complexity of the system
has increased significantly. In Germany, for instance, the number of chapters of the FIT legislation increased from 5 chapters in 1990
to 13 chapters in 2000, 21 chapters in 2004, and even 66 chapters in 2009.
As both countries are leading in the promotion of renewable energy technologies and their support framework has frequently
been identified as international best practice (For an analysis of FIT design options, please refer to Reference 92.) [14, 92–94, 96,
97], in the following the detailed design of the FIT in Germany and Spain will be analyzed. (The analysis of FIT design options in
Germany and Spain is largely based on the PhD project of David Jacobs, which is sponsored by the German Federal Environmental
Foundation (DBU) and will be published by Ashgate in 2012.)
When designing FITs, the idea is to provide a balance between investment security for producers, on the one hand, and the
elimination of windfall profits (in order to reduce the additional costs for the final consumer), on the other hand. We isolate 11
separate factors common to successful FITs, supported by examples mostly from Germany and Spain. In order to increase
investment security, the legislator has to (1) clearly define eligible producers, (2) establish a purchase obligation, (3) set up a
clear and transparent tariff calculation methodology, and (4) guarantee tariff payment for a long period of time (duration of tariff
payment). Additionally, (5) a robust financing mechanism needs to be established and (6) the success of the national FIT evaluated
periodically (progress report). In order to decrease the costs for the final consumer, (7) policymakers can differentiate tariff payment
according to the technology or (8) the size of power plants and the type of installations. Furthermore, (9) tariffs are generally
reduced automatically on an annual basis (tariff degression) but (10) at the same time adjusted to inflation. More recently, (11)
legislators have established a number of design options for market integration. All these design options are presented in this section.
94
Economics and Environment
1.06.6.1
Eligible Producers
At the start of each legal document, the policymaker defines which technologies will be eligible under the FIT mechanism. This decision
generally depends on the availability of resources in a given country. To this respect, legislators often start with establishing national
solar maps. Not all FIT schemes promote solar PV. Some developing countries have chosen to focus on the least costly renewable energy
technologies. Kenya, for instance, has established an FIT scheme for small hydro, biomass, and wind energy in 2008 [98].
In most cases, including Germany and Spain, FIT schemes support a large basket of renewable energy technologies. As
technology-specific support is one of the major advantages of FITs over other support mechanisms – e.g., quota-based support
mechanisms such as RPS and TGC schemes – this generally also includes less mature and more expansive technologies, such as
geothermal, tidal power, and solar PV. As an FIT mechanism can be considered a tool for technology development and cost
reduction, the promotion of less mature technologies today enables us to use them in a cost-effective manner tomorrow. By
supporting both fluctuating technologies, for example, wind energy and solar, and technologies that are more firm, for example,
biomass, solar thermal, geothermal, and hydroelectric, the legislator can pave the pathway toward an energy system fully based on
renewable energy sources [99]. Technology-specific support is necessary because of the large differences in generation costs amongst
renewable energy technologies.
However, some countries or regions have chosen to promote exclusively solar PV with the FIT scheme. This is the case in
jurisdictions where other support mechanisms are in place for the promotion of other technologies. In Italy, for instance, renewable
energy technologies are promoted via a quota-based mechanism. As solar PV is more expensive than most other renewable energy
technologies, they cannot be supported with a technology-neutral support instrument. Therefore, the Italian legislator has
established an FIT exclusively for solar PV electricity producer. An FIT scheme for only one technology such as PV, however,
includes certain risks which are most of all related to public acceptance. As the electricity costs for PV are significantly higher than
that of conventional energy sources and other renewable energy technologies and the amount of electricity produced is compara
tively small, the additional costs as distributed by financing mechanisms might seem rather high to the final consumer. In contrast,
if a large portfolio of technologies is eligible under the FIT legislation, the average cost for one unit of renewable electricity is rather
low. To a certain extent, more mature technologies such as wind power will help less mature technologies such as PV to be
developed. In this way, public acceptance can be strengthened.
1.06.6.2
Purchase Obligations
Besides fixed tariff payment over a long period of time, the purchase obligation is one of the most important ‘ingredients’ for all FITs
as it assures investment security. It obliges the nearest grid operator to purchase and distribute all electricity that is produced by
renewable energy sources, independent of power demand. This means that, for instance, in times of low demand, the grid operator
will reduce the amount of ‘gray’ electricity while all ‘green’ electricity is incorporated into the electricity mix. The purchase obligation
is especially important for more variable renewable energy technologies, such as wind and solar PV, as the producer cannot control
when the electricity will be generated. In contrast, gas- and coal-fired and nuclear-based power plants can increase and reduce
output, along with hydroelectric dams, biomass facilities, and geothermal power stations.
The purchase obligation protects renewable electricity producers in monopolistic or oligopolistic markets where the grid
operator might also dispatch power generation capacity. When it comes to electricity dispatch, when decisions are made concerning
which power generation sources are used to meet electricity demand, such grid operators might be biased and dispatch power from
power plants other than their own first. Therefore, the German legal text (Section 8, paragraph 1 of EEG 2009) states that the “grid
system operators shall immediately and as a priority purchase, transmit and distribute the entire available quantity of electricity
from renewable energy sources …” [100].
In Spain, the purchase obligation only applies for renewable energy producers who have chosen to be remunerated under the
fixed tariff payment option. In the case of a premium FIT, for example, selling electricity on the spot market and receiving a reduced
FIT payment on top of it (see further below), the renewable electricity producers are subject to the same conditions as any other
electricity producer. In other words, the selection of power plants for meeting the hourly electricity demand depends on the
short-term generation costs (the merit order). As solar power does not require any sort of fuel except sunlight (which is for free), the
short-term generation costs are close to zero so that these technologies will always be accepted first in the merit order. Only if there is
a risk of grid instabilities, these renewable energy sources might not be taken into consideration by the system operator.
1.06.6.3
Tariff Calculation Methodology
The tariff calculation methodology is one of the most crucial aspects when designing an FIT scheme. The methodology indirectly
determines the level of remuneration for each technology. A tariff that is too low will not spur any investment in the field of
renewable energies while a tariff that is too high might cause unnecessary profits and higher costs for the final consumer. In
Germany and Spain, the methodology changed significantly over the period from 1990 to today.
In the 1990s, both Germany and Spain used a tariff calculation methodology which was based on the avoided costs for
conventional power generation. Therefore, less mature technologies such as solar PV could not profit from the national FIT scheme
in the same way as other technologies. Besides, in both countries the tariff level was determined as a percentage of the price of
conventionally produced electricity.
Feed-In Tariffs and Other Support Mechanisms for Solar PV Promotion
95
In December 1990, German legislators passed an act on feeding renewable energy into the grid, in its Stromeinspeisungsgesetz
(StrEG) [101]. According to this new law, beginning 1 January 1991, utilities in Germany were required by law to purchase
electricity from nonutility generators of renewable energy at a fixed percentage of the retail electricity price. The percentage ranged
from 65% to 90% depending on the technology type and the project size.
Similarly, the early Spanish FIT scheme of 1994 and the previous regulation for hydro power generation [102] based tariff
calculation on the avoided cost for conventional power generation. The RD 2366/1994 even explicitly states that the tariffs for
power feed into the grid should “take the avoided costs of the electricity sector into account, based on the concept of power
generation, transport and distribution” [103]. Spain’s Law of the Electricity Sector in 1997 [104] established prices for RES-e that
ranged between 80% and 90% of the average retail price. Exceptions, that is, higher tariffs, were only possible for solar PV plants.
In the following years, both Germany and Spain (as well as most other countries which have been successful in promoting
renewable electricity) have switched toward a tariff calculation methodology based on the generation costs of each technology.
These FIT schemes offer a tariff payment based on the generation costs plus a small premium and thus offered sufficient returns on
investment. In order to describe this methodology, different names have been used in Germany and Spain. While the German
support scheme is based on the notion of ‘cost-covering remuneration’, the Spanish support mechanism speaks of a ‘reasonable rate
of return’. Despite the variety in names and notions, in all cases the legislator sets the tariff level in order to allow for a certain
internal rate of return, usually between 5% and 10% return on investment per year.
This ‘generation cost’ tariff calculation methodology generally takes a number of common cost factors into account. This
includes investment costs for each plant (including material and capital costs), grid-related and administrative costs (including
grid connection cost, costs for the licensing procedure, etc.), operation and maintenance costs, fuel costs (in the case of biomass and
biogas), and decommissioning costs (where applicable). Based on these cost factors, the policymaker can then calculate the
nominal electricity production costs for each technology. Knowing the average operating hours of a standard plant and the duration
of tariff payment, the legislator can fix the nominal remuneration level. For the estimate of the average generation costs, regulators
can use standard investment calculation methods (such as the annuity method). The Spanish legislator even obliges renewable
electricity producers to disclose all costs related to electricity generation in order to have optimal information when setting the tariff.
In Germany, this method of ‘cost-covering remuneration’ was first implemented on the local level in the case of solar PV in 1993.
The cities of Freising, Hammelburg, and Aachen established an FIT scheme for solar PV, which allowed for full cost recovery. In the
coming years, these early local FIT schemes became the role model for many other communities and later regions. In 1999, the
Red-Green coalition decided to implement this scheme at the national level and apply the approach of cost-covering remuneration
to all renewable energy technologies [105]. In 2000, the level of FITs was already exclusively based on the cost-covering remunera
tion approach (kostendeckendeVergütung) in order to guarantee sufficient returns on investment.
In 2000, a transparent, national tariff calculation methodology was developed. This methodology is used by the German
Ministry for the Environment (BMU) for the initial tariff proposal in the framework of the so-called progress report. This report is
issued every 4 years and serves as the base for the periodical revision of the FIT scheme. It has to be noted, however, that the initial
tariff proposal of the BMU is sometimes changed during the consecutive political decision-making process. In contrast to many
other countries, the German FIT scheme has the legal rank of a law – in contrast to Royal Decrees or Ministerial Orders. Therefore,
the initial proposal of the Ministry has to pass the government and the parliament and might therefore be subject to modifications.
For the setting of the tariff, both the Ministry for the Economy and the Ministry for the Environment commission studies that are
conducted by various independent research institutes. In addition, wide-ranging surveys on costs are conducted amongst producers
of renewable electricity. The results are cross-checked with published cost data and empirical values from project partners of the
ministries. In this way, the Ministry evaluates the average generation cost of plants. To finally determine the tariff level, several basic
data and parameters are compiled. Generally, tariff payment is guaranteed for 20 years. For the tariff calculation of solar PV, the
interest rate for capital is set at a nominal basic value of 5–8%. The expected annual inflation is 2%. The costs for specialized
personnel and the expected annual operating hours are also taken into consideration. The detailed assumptions and data are
summarized in Table 9 (BMU [106]).
The German Ministry of the Environment applies this ‘annuity method’ to calculate the electricity generation costs for all
renewable energy technologies except wind energy. This method of dynamic investment calculation allows for translating one-off
payments and periodic payments of varying amount into constant, annual payments. All costs for renewable electricity generation
are calculated on a real basis, adjusting them to inflation based on a specific reference year.
Besides the above-mentioned parameters, further input variables have to be taken into account for the specific cost calculation.
This includes output data of average plants which are currently in operation, the purchasing costs for fuel in the case of biomass and
biogas, investment cost (machinery, construction, grid connection, etc.), and operation costs (see Figure 10). Because of the unique
regulatory environment in Germany, special investment cost subsidies from financial institutions are not included in the calcula
tion, and the German FITs are based on pretax calculations.
Even though the electricity law of 1997 can be interpreted as a first step from the ‘avoided cost’ approach toward the ‘generation
cost’ approach in Spain, the shift toward a tariff calculation approach based on the generation cost of each technology was triggered
by the National Energy Commission CNE. In 2003, the CNE tabled a proposal for an objective methodology for tariff calculation
which was sent to the Ministry of the Economy [107]. The methodology was applied for the first time for the FIT scheme of 2004
[108]. The tariff calculation methodology of the CNE was clearly based on a generation cost approach. For each technology, the
generation costs consisted of three components (A + B + C). In the case of the premium FIT option, the generation cost minus the
expected market price determines the premium tariff level.
96
Economics and Environment
Table 9
Summary of basic data and parameters used for profitability calculation
Landfill, sewage,
and mine gas
Hydropower
Blomass
Imputed period under
review
30 a/15 a
20 a
Nominal composite
interest rate
Small plants 7%/a Large-scale
plants 8%/a
Inflation rate
Remuneration for heat (for
CHP; ex-plant)
Specialist personnel costs
Equivalent operating hours
at full capacity of
electricity-led plants
Equivalent operating hours
at full capacity of
heat-led plants
2%/a
Basic case: € 25/MWh (Variation within sector € 10–40/MWh)
€ 50 T per person-year
Dependent on
7700 h/a
degree of
utilization
–
Dependent
on model
case
Basic case: 20 a
(6 a variant for
landfill gas)
8%/a
Landfill gas 7000 h/
a, sewage/mine
gas 7700 h/a
–
Geothermal
Wind
Photovoltaics
20 a
Basic case:
20 a (variant 16 a)
20 a
8%/a
8%/a
Variation
within
sector
5–8%/a
7700 h/a
Dependent on conditions at location
–
–
–
Source: BMU (2008) Depiction of the methodological approaches to calculate the costs of electricity generation used in the scientific background reports serving as the basis for the
renewable energy source act (EEG) progress report 2007, extract from renewable energy source act (EEG), progress report 2007, Chapter 15.1 [106].
• Investment costs for plant and
peripherals
• Interest on capital (composite
interest)
• Service costs
• Review period
• Replacement investment
• Operating life
• Etc.
Capital costs
• Market price for inputs
• Specific fuel requirement
• Equivalent hours of operation
at full capacity
• Requirement for ancillary
inputs and energy
• Residual materials and
disposal costs
• Etc.
Consumption-related costs
• Cleaning and maintenance
costs
• Personnel requirement
• Insurance and administration
• Other variable ancillary costs
(e.g. lubricating oil)
• Unforeseen costs
• Etc.
Operating and other costs
Total annual costs ( /a)
Financial/mathematical
framework assumptions
• Revenue from heat generated
in CHP plants
• Savings on disposal costs of
sewage slurry and
fermentation residues
• Specific product prices
• Etc.
Proceeds
Total annual proceeds ( /a)
Calculation model
(annuity-based)
Electricity production costs ( /kWhel.)
Average costs for all periods
Figure 10 German methodology and input variables for calculating electricity production costs. Source: BMU (2008) Depiction of the methodological
approaches to calculate the costs of electricity generation used in the scientific background reports serving as the basis for the renewable energy source
act (EEG) progress report 2007, extract from renewable energy source act (EEG), progress report 2007, Chapter 15.1 [106].
Component A shall guarantee reasonable profitability for renewable energy projects, taking the generation costs and specific
requirement of each technology into account. The income for power producers shall provide an internal rate of return of free cash
flow after tax similar to a regulated financial activity. On average, the Spanish FIT levels are based on an internal rate of return of 7%.
In the case of the Premium FIT option, the profitability varies between 5% and 9%, depending on the market price (Tembleque L
(2008) personal communication, interview with Luis Jesús Sánchez de Tembleque, CNE, 13 February 2008, Madrid.)
The calculation model takes into account the operation hours per year, the performance of reference plants, the economic
lifetime of projects and amortization period for investments, the investment costs, the tax burdens and benefits, the income from
regional support programs, and the operation and maintenance costs (fuels, O&M costs, costs for insurance, rentals for land use,
etc.). Component B assesses the additional energetic and environmental benefits of each reference plant. This additional compo
nent can increase the internal rate of return (IRR) of renewable energy projects. In order to determine the additional benefits, the
national, technology-specific midterm objectives are compared with the actual growth rates of each technology. If the comparison
Feed-In Tariffs and Other Support Mechanisms for Solar PV Promotion
97
shows that the target will be reached or even overfulfilled, no additional payment is granted based on component B. If one
technology is underdeveloped and the technology-specific midterm targets will not be reached, then component B would consist of
an additional payment which is to increase the IRR by X, a certain number of percentage points. In how far this applies to setting FITs
can be observed within the Royal Decree 661/2007. When it became apparent that some technologies – including biomass, biogas,
and concentrated solar power (CSP) – were still far from reaching the 2010 target, their tariffs were increased to a point that an
average profitability margin of 8% was guaranteed (compared with 7% for all other technologies) [109].
Finally, component C is to measure the impact of the different technologies on the technical management of the electricity grid.
Component C only includes those aspects which are not explicitly remunerated by additional tariff payments. This includes the
capacity to participate in the national electricity market and the forecast of electricity generation. It only applies to power producers
who opt to sell their electricity under the premium FIT (see below). In 2004, component C was taken into account by offering an
additional incentive for participation in the power market (10% of the average electricity price) [110].
1.06.6.4
Duration of Tariff Payment
Fixing the payment duration is equally important for a good FIT mechanism. The duration of the tariff payment is closely related to
the level of tariff payment. If a legislator desires a rather short period of guaranteed tariff payment, the tariff level has to be higher in
order to assure the amortization of costs. If tariff payment is granted for a longer period, the level of remuneration can be reduced.
FIT mechanisms around the world usually guarantee tariff payment for a period of 10–25 years, while a period of 15–20 years is the
most common and successful approach. A payment of 20 years equals the average lifetime of many renewable energy plants. Longer
remuneration periods are normally avoided because otherwise technological innovation might be hampered. Once tariff payment
ends, the producer will have a stronger incentive to reinvest in new and more efficient technologies instead of running the old plant
in order to keep receiving tariff payment.
In Germany and Spain, in the 1990s, tariff payment was only guaranteed for a short period of time of 1 year. Even though power
purchase agreements were sometimes longer (in Spain generally 5 years), tariffs were subject to annual changes. This made
financing of renewable electricity plants difficult. At this time, the remuneration for renewable electricity producers was linked to
the retail electricity price. In Germany, retail electricity prices started to fall in the first years after the liberalization of energy markets
and thus did the remuneration for renewable power producers [111]. Therefore, the 2000 amendment for the first time guaranteed
fixed prices over a period of 20 years for all technologies except hydro power. In Spain, a long payment duration of at least 20 years
was guaranteed from 2007 onward.
1.06.6.5
Financing Mechanism
The costs of generating electricity from renewable energy sources are still higher than in the case of conventionally produced
electricity. Therefore, countries operating under FIT mechanisms have developed different financing mechanisms in order to cover
the additional costs. In almost all countries, the additional costs are distributed equally amongst all electricity consumers. This
financial burden-sharing mechanism permits the support of large shares of renewable electricity with only a marginal increase of the
final consumer’s electricity bill.
In this case, the national government only acts as a regulator of private actors in the electricity market by determining tariff
payment and establishing the purchase obligation. However, no government financing is included under these conditions. In order
to pass the price from the producer of renewable electricity to the final consumer, the costs, that is, the aggregated tariff payments,
must be passed along the electricity supply chain. This is how it is done in Germany.
First, the producer of renewable electricity receives the tariff payment from his or her local grid operator. By legal obligation
through the FIT scheme, this grid operator is obliged to pay, connect, and transmit the produced electricity. Normally, renewable
electricity producers get connected to the next distribution system operator (DSO). In some cases, however, a producer of a large
plant might also decide to connect directly to higher voltage lines, through the transmission system operator (TSO). Afterward, the
costs and the accounting data are passed to the next highest level in the electricity system until the national TSO aggregates all costs
and divides it by the total amount of renewable electricity produced. The costs are then equally distributed amongst all national
supply companies in relation to the total amount of electricity provided to the final consumer (see Figure 11, from Jacobs and Kiene
[112]). This way, all final consumers pay the same for the total amount of renewable electricity produced in a given territory.
In Spain, financing of the FIT mechanisms is also largely through a small increase of the electricity price of the final consumers.
However, as the Spanish electricity market is not fully liberalized, electricity prices for certain consumer groups are still regulated by
governmental authorities. Therefore, costs related to electricity generation, transportation, and distribution and other costs related
to the electricity system are not fully passed on to the final consumers. The resulting ‘gap’ between the actual costs of the national
electricity system and the income through selling the power leads to a national deficit, which has to be covered by the state budget.
According to estimates of the Spanish Energy Council CNE, the electric deficit has accumulated to more than €15 billion between
2000 and 2008 [113]. This is one of the reasons why the Spanish government decided to keep the cap for solar PV as the national
electricity deficit was to be reduced.
In 2009, a securitization fund was established (Fondo de Titulización del Déficit del Sistema Eléctrico). This fund is intended to enable
power companies to recuperate the money they cannot charge to final consumers – the so-called tariff deficit. The money for the fund
will be raised via the costs of the Spanish electricity system that eventually have to be paid by the final electricity consumer. For