Managerial economics economic tools for todays decision makers 7th edtion by keat young and erfle chapter 04
Bạn đang xem bản rút gọn của tài liệu. Xem và tải ngay bản đầy đủ của tài liệu tại đây (210.5 KB, 32 trang )
Chapter 4
Demand
Elasticity
Chapter Outline
•
•
•
•
•
•
The economic concept of elasticity
The price elasticity of demand
The cross-elasticity of demand
Income elasticity
Other elasticity measures
Elasticity of supply
Copyright ©2014 Pearson Education, Inc. All rights reserved.
4-2
Learning Objectives
• Define and measure elasticity
• Apply the concepts of price elasticity, crosselasticity, and income elasticity
• Understand the determinants of elasticity
• Show how elasticity affects revenue
Copyright ©2014 Pearson Education, Inc. All rights reserved.
4-3
The Economic Concept of Elasticity
• Elasticity: the percentage change in one
variable relative to a percentage change in
another.
percent change in A
Elasticity
percent change in B
Copyright ©2014 Pearson Education, Inc. All rights reserved.
4-4
Price Elasticity of Demand
• Price elasticity of demand: the
percentage change in quantity demanded
divided by the percentage change in price
% Quantity
Ep
% Price
Copyright ©2014 Pearson Education, Inc. All rights reserved.
4-5
Price Elasticity of Demand
• Arc price elasticity: elasticity which is
measured over a discrete interval of the
demand curve
Q2 Q1
P2 P1
Ep
(Q1 Q2 ) / 2 ( P1 P2 ) / 2
Ep = arc price elasticity
Q1 = original quantity demanded
Q2 = new quantity demanded
P1 = original price
P2 = new price
Copyright ©2014 Pearson Education, Inc. All rights reserved.
4-6
Price Elasticity of Demand
• Point elasticity: elasticity measured at a
given point of a demand (or supply) curve.
Instead of estimating over a range of prices,
it is the elasticity at a specific price. The
point elasticity of a linear demand function
can be expressed as:
Q P1
p
P Q1
Copyright ©2014 Pearson Education, Inc. All rights reserved.
4-7
Price Elasticity of Demand
• When demand is nonlinear, the calculation of
ΔQ/ΔP is somewhat more complicated because the
slope of a curve changes. This slope is obtained
using the calculus concept of derivative. In this
instance,
Ed= dQ/dP * P1/Q1
• The derivative of Q with respect to P (i.e., dQ/dP) is
simply the instantaneous version of slope.
Copyright ©2014 Pearson Education, Inc. All rights reserved.
4-8
Price Elasticity of Demand
• An example of a nonlinear demand curves
is one with constant elasticity
• such a curve has a nonlinear equation:
Q = aP-b
• where –b is the elasticity coefficient
Copyright ©2014 Pearson Education, Inc. All rights reserved.
4-9
Price Elasticity of Demand
• Categories of elasticity
• Relative elasticity of demand: Ep > 1
• Relative inelasticity of demand: 0 < Ep < 1
• Unitary elasticity of demand: Ep = 1
• Perfect elasticity: Ep = ∞
• Perfect inelasticity: Ep = 0
Copyright ©2014 Pearson Education, Inc. All rights reserved.
4-10
Price Elasticity of Demand
• Factors affecting demand elasticity
–
–
–
–
ease of substitution
proportion of total expenditures
length of time period
durability of product
• possibility of postponing purchase
• possibility of repair
• used product market
Copyright ©2014 Pearson Education, Inc. All rights reserved.
4-11
Price Elasticity of Demand
• Derived demand: the demand for items
that go into the production of a final
commodity, such as materials, machinery,
and labor.
– The demand for such components of a final
product is called derived demand.
– The demand for such a product or factor exists
because there is demand for the final product.
Copyright ©2014 Pearson Education, Inc. All rights reserved.
4-12
Price Elasticity of Demand
• The derived demand curve will be more
inelastic:
– the more essential is the component
– the more inelastic is the demand curve for the
final product
– the smaller is the fraction of total cost going to
this component
– the more inelastic is the supply curve of
cooperating factors
Copyright ©2014 Pearson Education, Inc. All rights reserved.
4-13
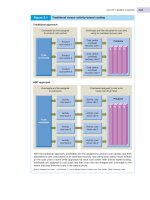
Price Elasticity of Demand
Short Run vs. Long Run
•A long-run demand curve
will generally be more elastic
than a short-run curve.
•As the time period
lengthens consumers find
ways to adjust to the price
change, via substitution or
shifting consumption.
Copyright ©2014 Pearson Education, Inc. All rights reserved.
4-14
Price Elasticity of Demand
• The relationship between price and revenue
depends on elasticity
Copyright ©2014 Pearson Education, Inc. All rights reserved.
4-15
Price Elasticity of Demand
• Marginal revenue: the change in total revenue
resulting from changing quantity by one unit
Total Revenue
MR
Quantity
Copyright ©2014 Pearson Education, Inc. All rights reserved.
4-16
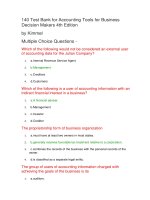
Price Elasticity of Demand
• As price decreases
– revenue rises when
demand is elastic
– revenue falls when it
is inelastic
– revenue reaches its
peak if elasticity =1
The lower chart shows
the effect of elasticity
on total revenue.
Copyright ©2014 Pearson Education, Inc. All rights reserved.
4-17
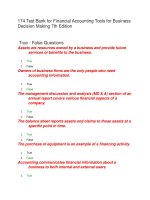
Price Elasticity of Demand
• Marginal revenue curve
is twice as steep as the
demand curve
Copyright ©2014 Pearson Education, Inc. All rights reserved.
4-18
Price Elasticity of Demand
• At the point where
marginal revenue
crosses the X-axis, the
demand curve is
unitary elastic and
total revenue reaches
a maximum.
Copyright ©2014 Pearson Education, Inc. All rights reserved.
4-19
Price Elasticity of Demand
• Elasticity examples
–
–
–
–
–
coffee: short run -0.2, long run -0.33
kitchen and household appliances: -0.63
meals at restaurants: -2.27
airline travel in U.S.: -1.98
U.S. oil demand: short run -.06, long run -.45
Copyright ©2014 Pearson Education, Inc. All rights reserved.
4-20
Cross-price Elasticity of Demand
• Cross-price elasticity of demand: the
percentage change in quantity consumed of
one product as a result of a 1 percent
change in the price of a related product
% Q A
Ex
%PB
Copyright ©2014 Pearson Education, Inc. All rights reserved.
4-21
Cross-price Elasticity of Demand
• Arc cross-elasticity-relates the percentage
change in quantity to the percentage
change in the price of another product
(either a substitute or a complement).
Q2 A Q1 A
P2 B P1B
EX
(Q1 A Q2 A ) / 2 ( P1B P2 B ) / 2
Copyright ©2014 Pearson Education, Inc. All rights reserved.
4-22
Cross-price Elasticity of Demand
• The sign of cross-elasticity for substitutes is
positive
– The sign of cross-elasticity for complements is
negative.
– Two products are considered good substitutes or
complements when the coefficient is larger than
0.5 (in ab. value).
Copyright ©2014 Pearson Education, Inc. All rights reserved.
4-23
Cross-price Elasticity of Demand
• Cross-price elasticity of demand examples:
– Residential demand for electric energy with
respect to prices of gas energy was low, about
+0.13.
– The cross-elasticity of demand for beef with
respect to pork prices was calculated to be about
+0.25. With respect to prices of chicken, it was
about +0.12. Both numbers indicate that the
products are substitutes.
Copyright ©2014 Pearson Education, Inc. All rights reserved.
4-24
Income Elasticity
• Income elasticity of demand: the
percentage change in quantity demanded
caused by a 1 percent change in income
%Q
EY
% Y
(Y is shorthand for income)
Copyright ©2014 Pearson Education, Inc. All rights reserved.
4-25